6.3 Grism and Prism Spectroscopy
HRC has been unavailable since January 2007. Information about the HRC is provided for archival purposes.
The ACS filter wheels include four dispersing elements for low resolution slitless spectroscopy over the field of view of the three ACS channels. One grism (G800L) provides low resolution spectra from 5500 Å to 10,500 Å for both the WFC and HRC. A prism (PR200L) in the HRC covered 1700 Å to beyond 3900 Å, although reliable wavelength and flux calibration was guaranteed only up to 3500 Å. For the SBC, a LiF prism (PR110L) covers the range 1150 Å to ~1800 Å, and a CaF2 prism (PR130L) is useful from 1250 Å to ~1800 Å. The grism provides first order spectra with almost constant dispersion as a function of wavelength but with second order overlap beyond ~10,000 Å. The prisms have non-linear dispersion with maximum resolution at shorter wavelengths and much lower resolving power at longer wavelengths. Table 6.3 summarizes the essential features of the four ACS dispersers in the five supported modes.
Table 6.3: Optical parameters of ACS dispersers.
Disperser | Channel | Wavelength range (Å) | Resolving | Å/pixel | Tilt [a](deg) |
|---|---|---|---|---|---|
G800L | WFC | 1st order: 5500 to 10500 | 100 @ 8000 Å | 39.8 [b] | –2 |
2nd order: 5000 to 8500 | 200 @ 8000 Å | 20.7 [b] | –2 | ||
HRC | 1st order: 5500 to 10500 | 140 @ 8000 Å | 23.9 [c] | –38 | |
2nd order: 5500 to 8500 | 280 @ 8000 Å | 12.0 [c] | –38 | ||
PR200L | HRC | 1700 to 3900 | 59 @ 2500 Å | 21.3 | –1 |
PR110L | SBC | 1150 to 1800 | 79 @ 1500 Å | 9.5 | 0 |
PR130L | SBC | 1250 to 1800 | 96 @ 1500 Å | 7.8 | 0 |
a Tilt with respect to the positive X-axis of the data frame.
b The dispersion varies over the field by ±11%; the tabulated value refers to the field center.
c The dispersion varies over the field by ±2%; the tabulated value refers to the field center.
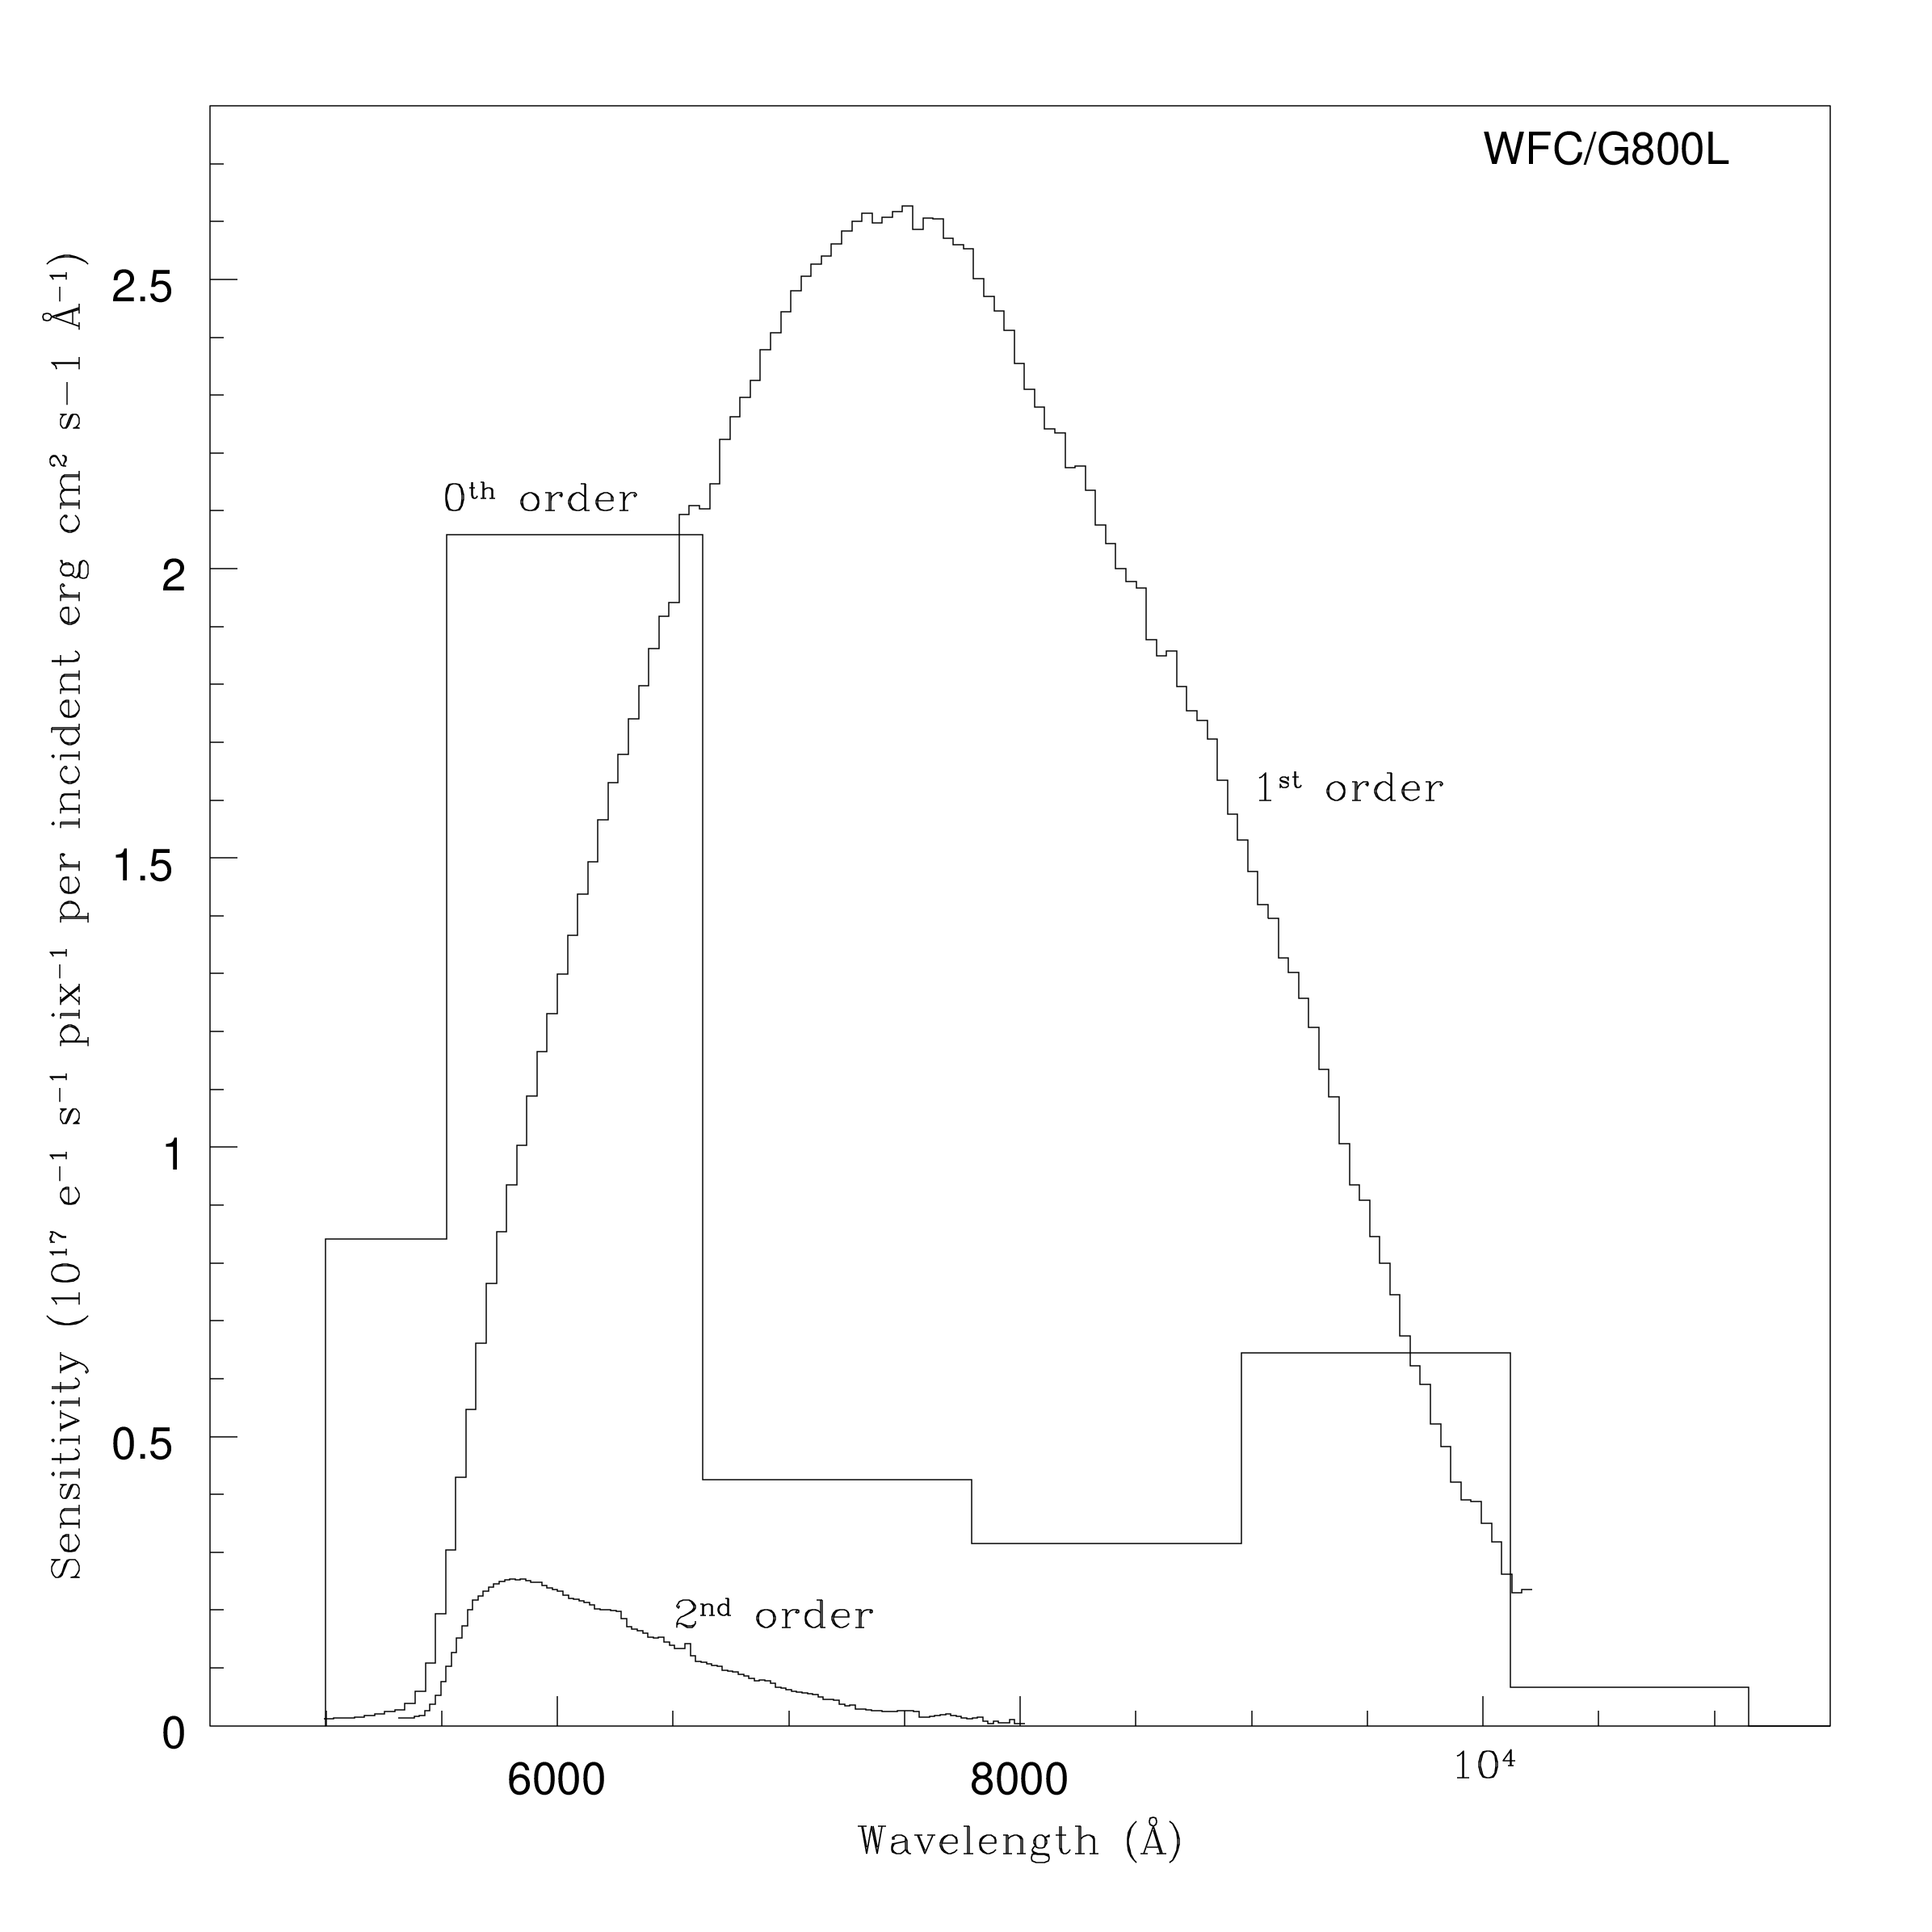
6.3.1 WFC G800L
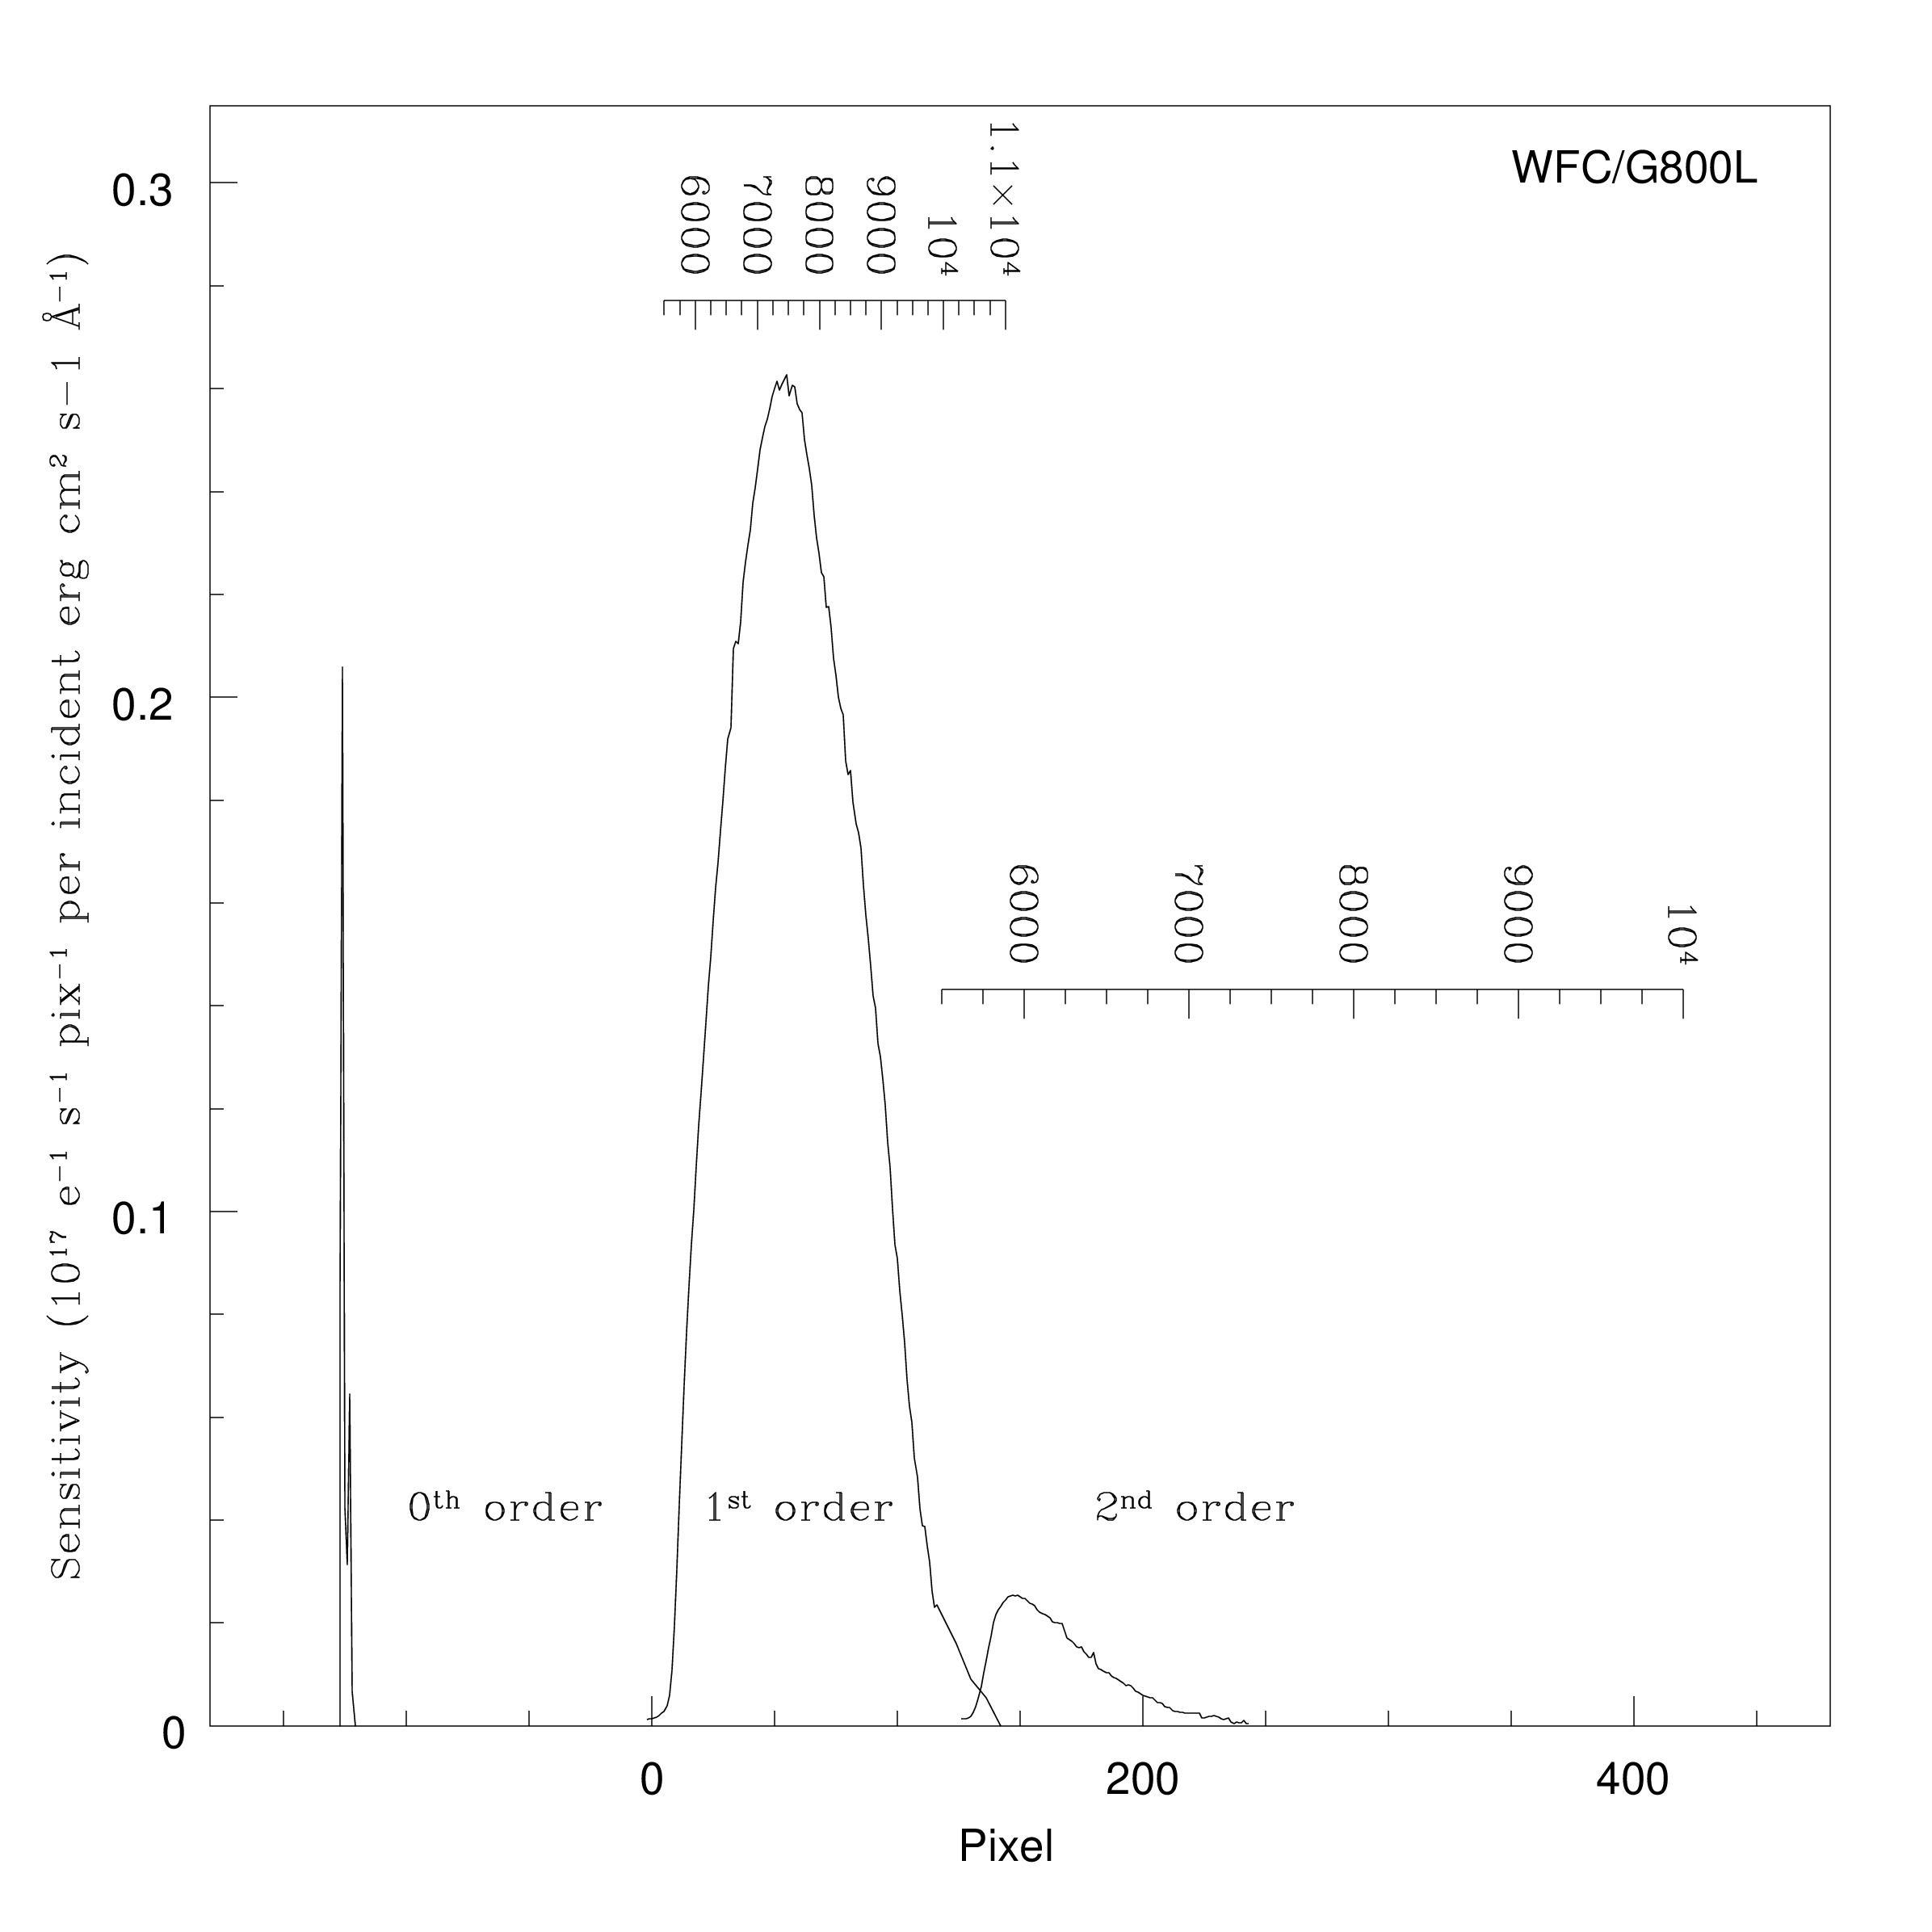
The G800L grism provides two-pixel resolving power, R, from 69 (at 5500 Å) to 131 (at 10,500 Å) for first order spectra over the whole accessible WFC field of 202 x 202 arcsec2. Two-pixel resolving power is given by R = \lambda / (2~\mathrm{pixels} \times d_{\lambda}) for dλ ~ 40 Å. Figure 6.15 shows the wavelength range and sensitivity for the zeroth, first, and second order WFC spectra. Figure 6.16 shows the same plot as a function of pixel range, where pixel 0 is the position of the direct image.
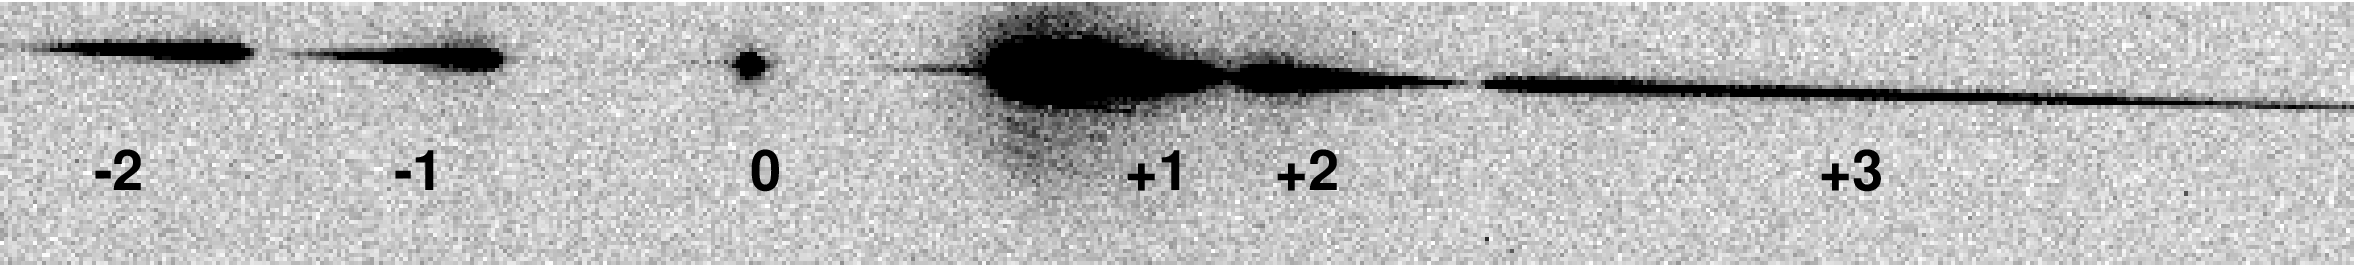
Figure 6.17 shows the full G800L spectrum of the white dwarf GD153 (V = 13.35 mag) obtained in one 60 second exposure. The first order is contaminated by the second order beyond ~10,000 Å. The total flux in the zeroth order is 2.5% of that in the first order, so locating the zeroth order is a less effective method of obtaining the wavelength zero point of weak spectra than using a matched pair of direct and grism images. The third and fourth orders contain about 1% of the flux in the first order, and the negative orders contain about 0.5% of that flux. When bright objects are observed, the signal in fainter orders may be mistaken for the spectra of fainter nearby objects. In crowded fields, many spectral orders from different objects may overlap.
Table 6.3 lists the linear dispersion for the first and second order spectra, but their dispersions are better described with second order fits (ACS ISR 2005-08). Because the grism is tilted with respect to the optical axis, the wavelength solutions are field-dependent. This dependence has been calibrated within 0.5 pixels over the whole field; the linear dispersion varies by ±11% from center to corner. The full extent of the spectrum of a bright source (orders –2, –1, 0, 1, 2, 3) is 1200 pixels (60 arcseconds). The higher spectral orders are not in focus, so their spectral resolutions are smaller than expected from their nominally higher dispersions.
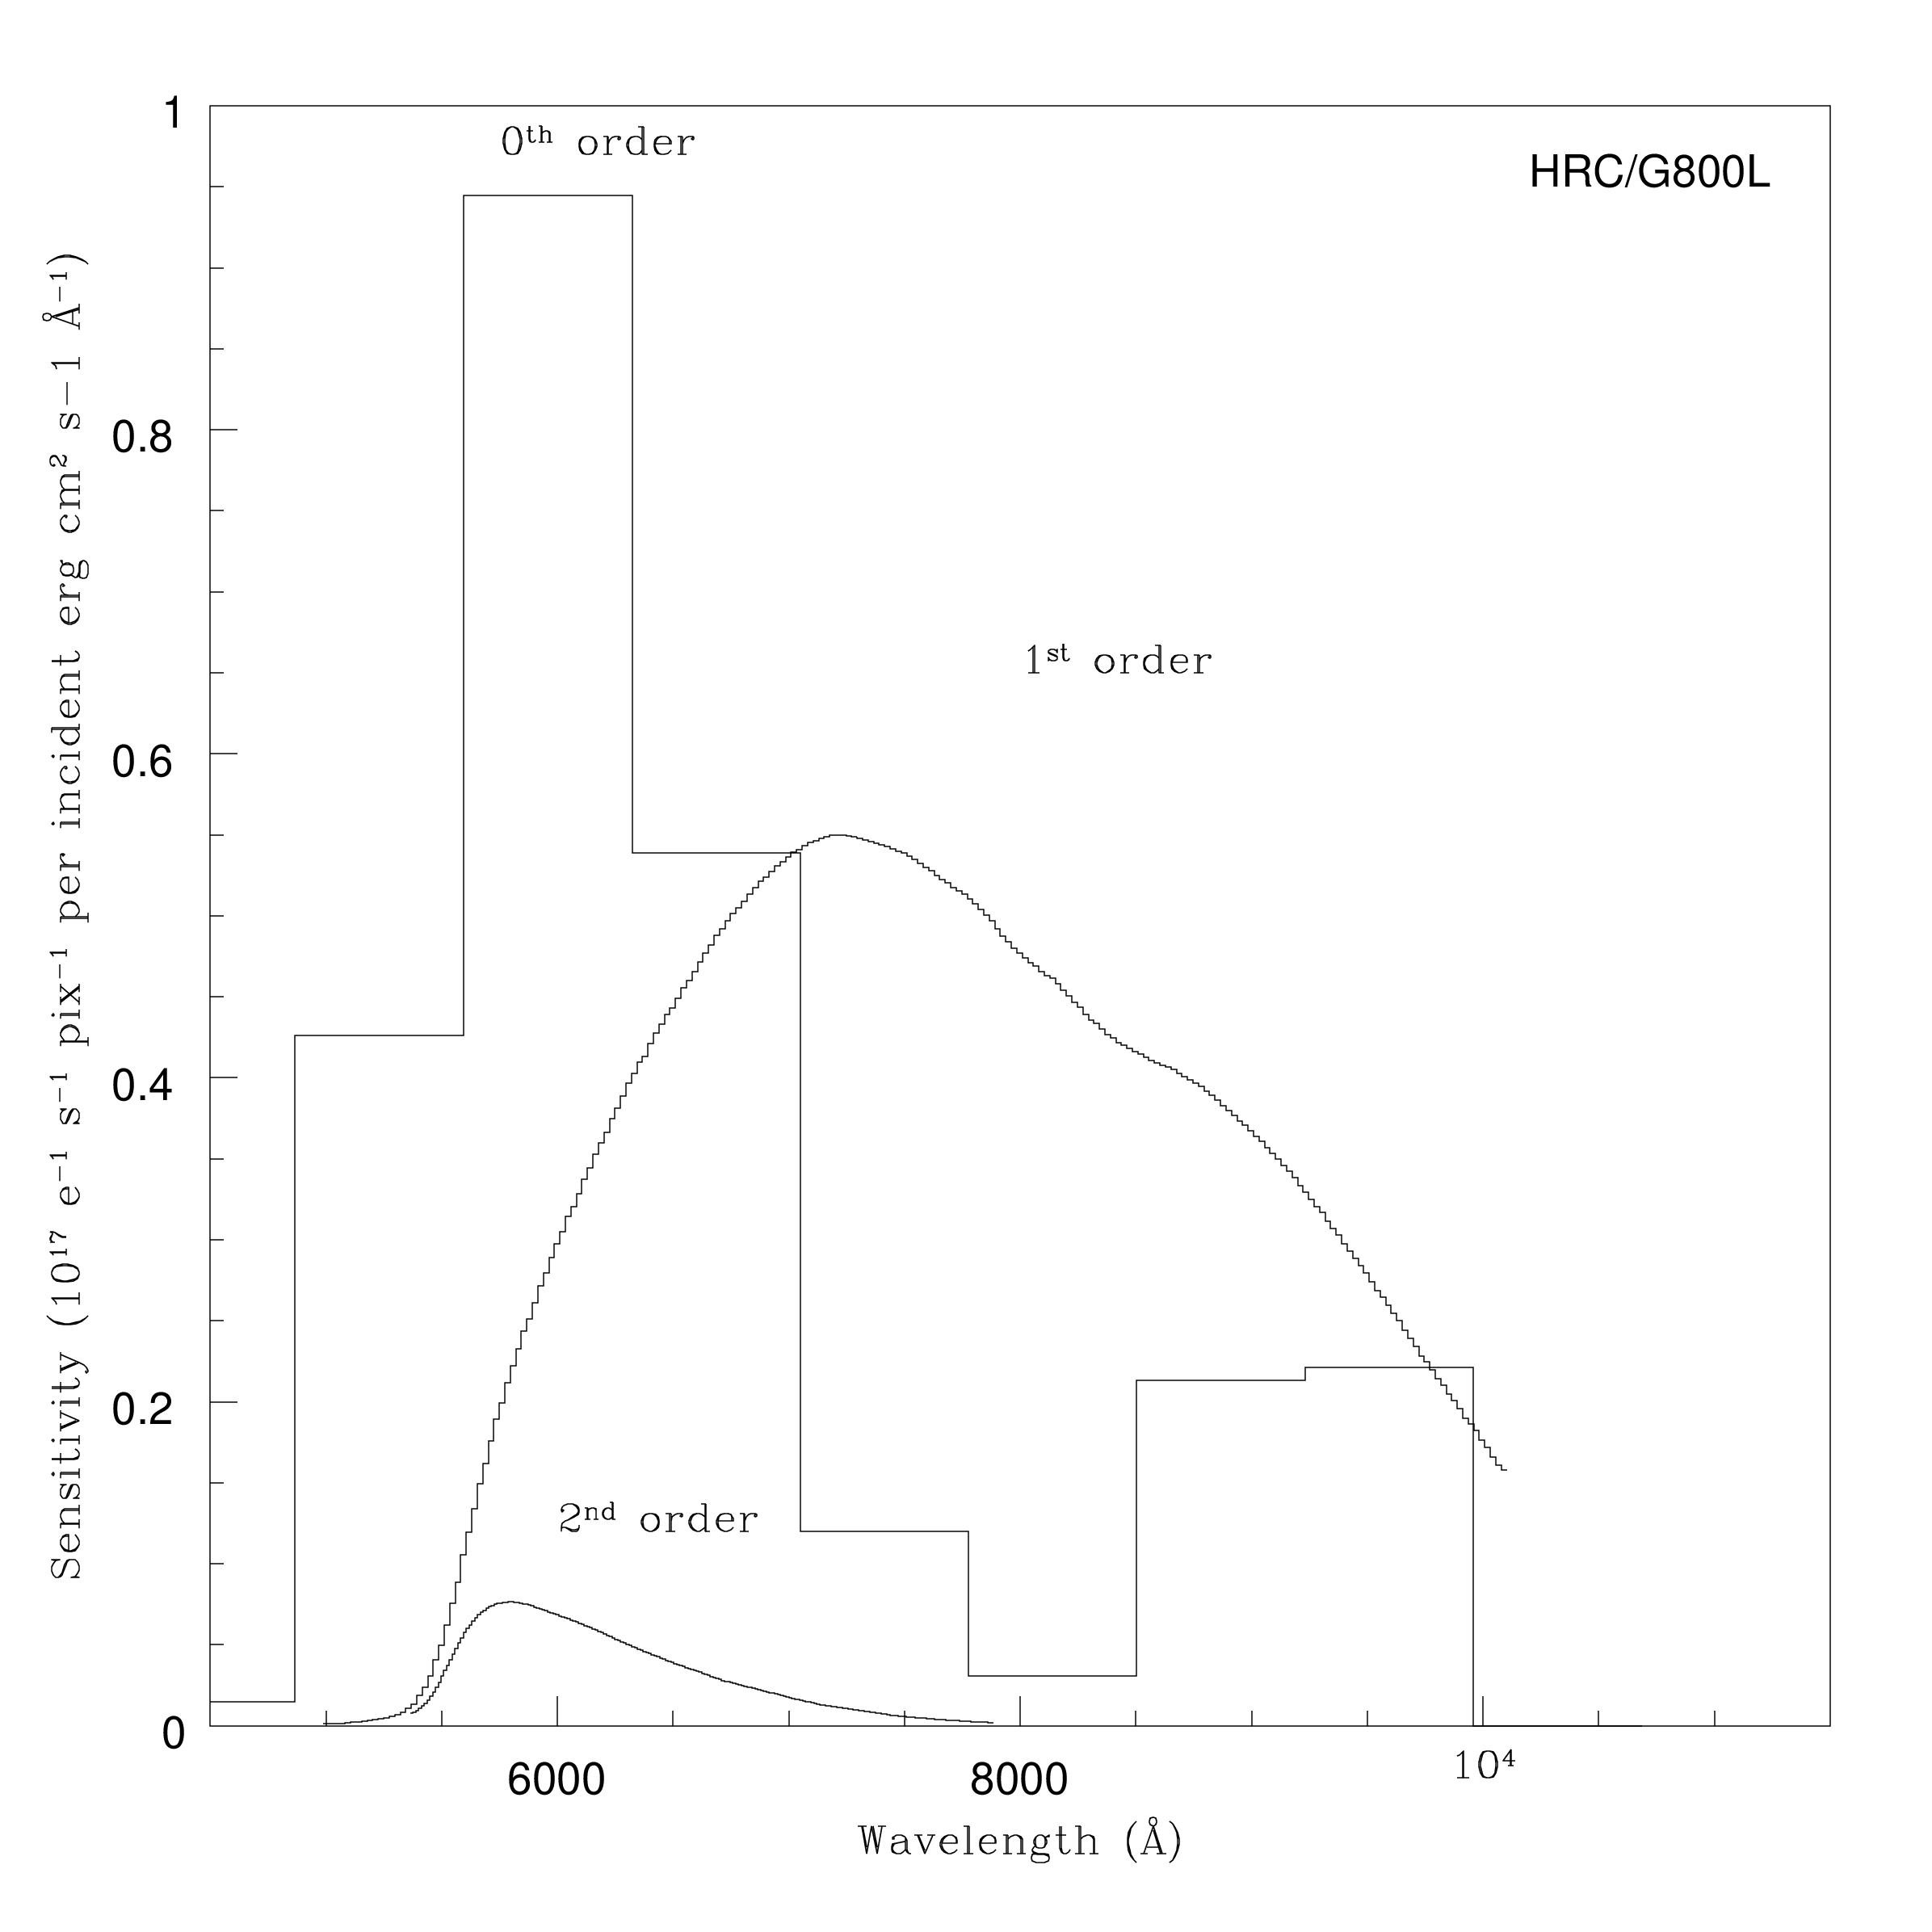
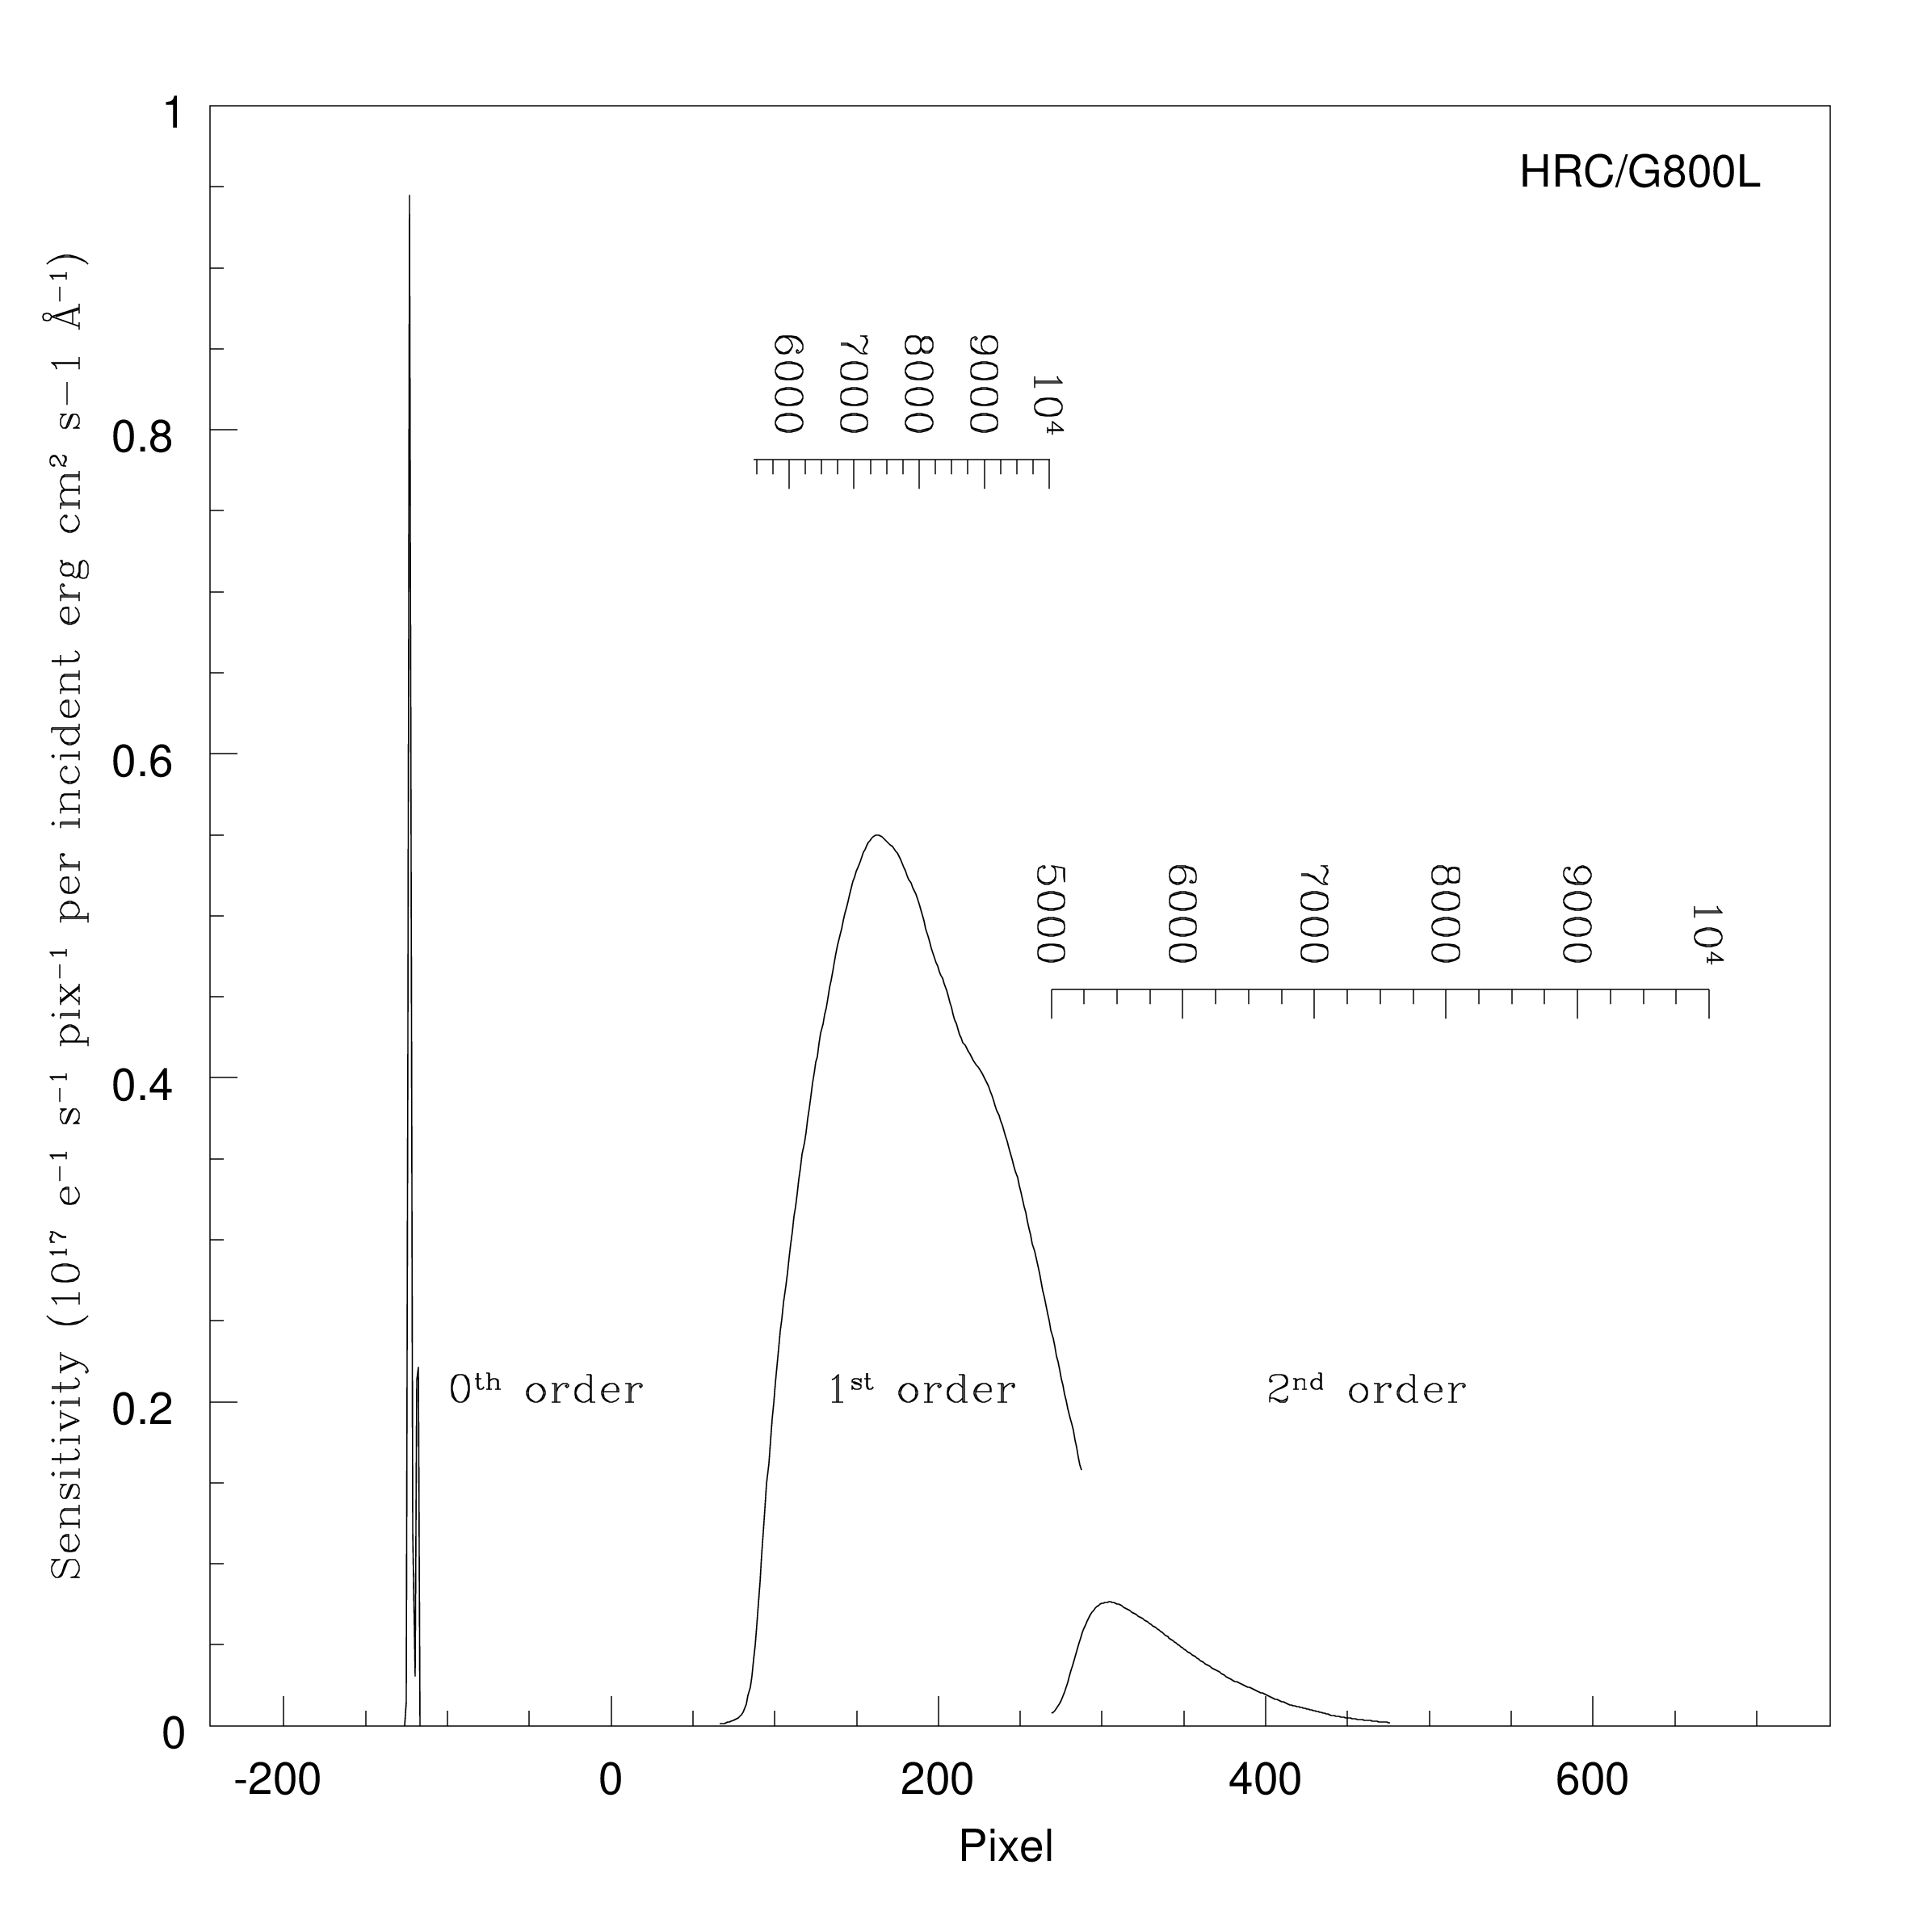
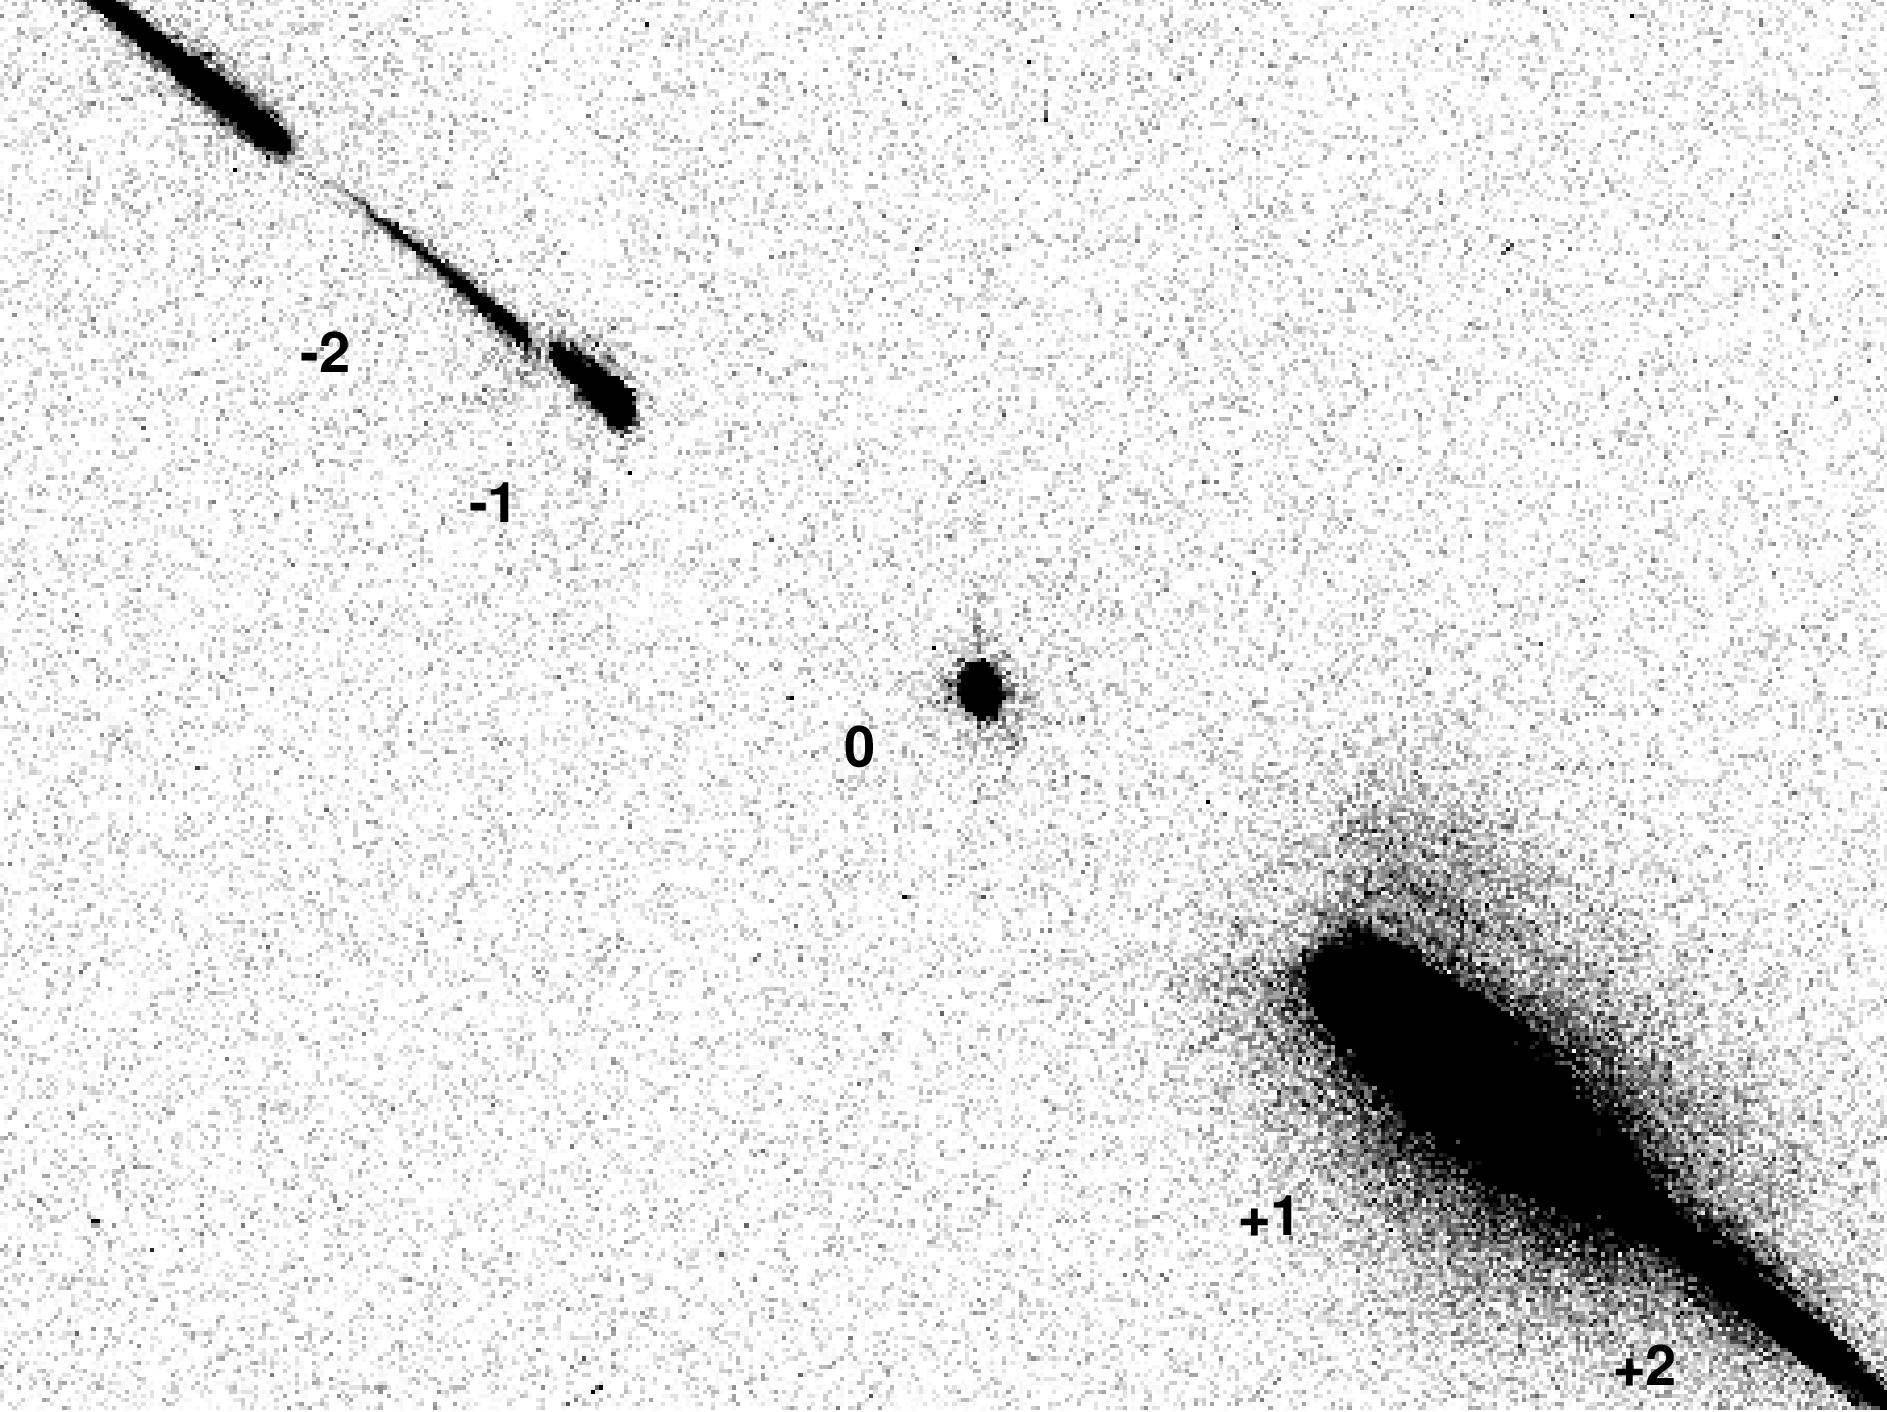
6.3.2 HRC G800L
G800L provided higher spatial resolution with the HRC than with the WFC, but the spectra were tilted at −38° with respect to the HRC's X axis. Figure 6.18 and Figure 6.19 show the ranges and sensitivities of the zeroth, first, and second orders as a function of wavelength and pixel, respectively. Figure 6.20 shows the spectrum of the standard star GD153. Orders –1 through +2 span about 70% of the 1024 detector columns, and the +2 order overlaps the +1 order beyond ~9500 Å. The dispersion varies by ±2% from the center to the corners of the detector. Because of the HRC's limited FOV, many G800L spectra were truncated by the edges of the detector or originated from objects located outside the corresponding direct image.
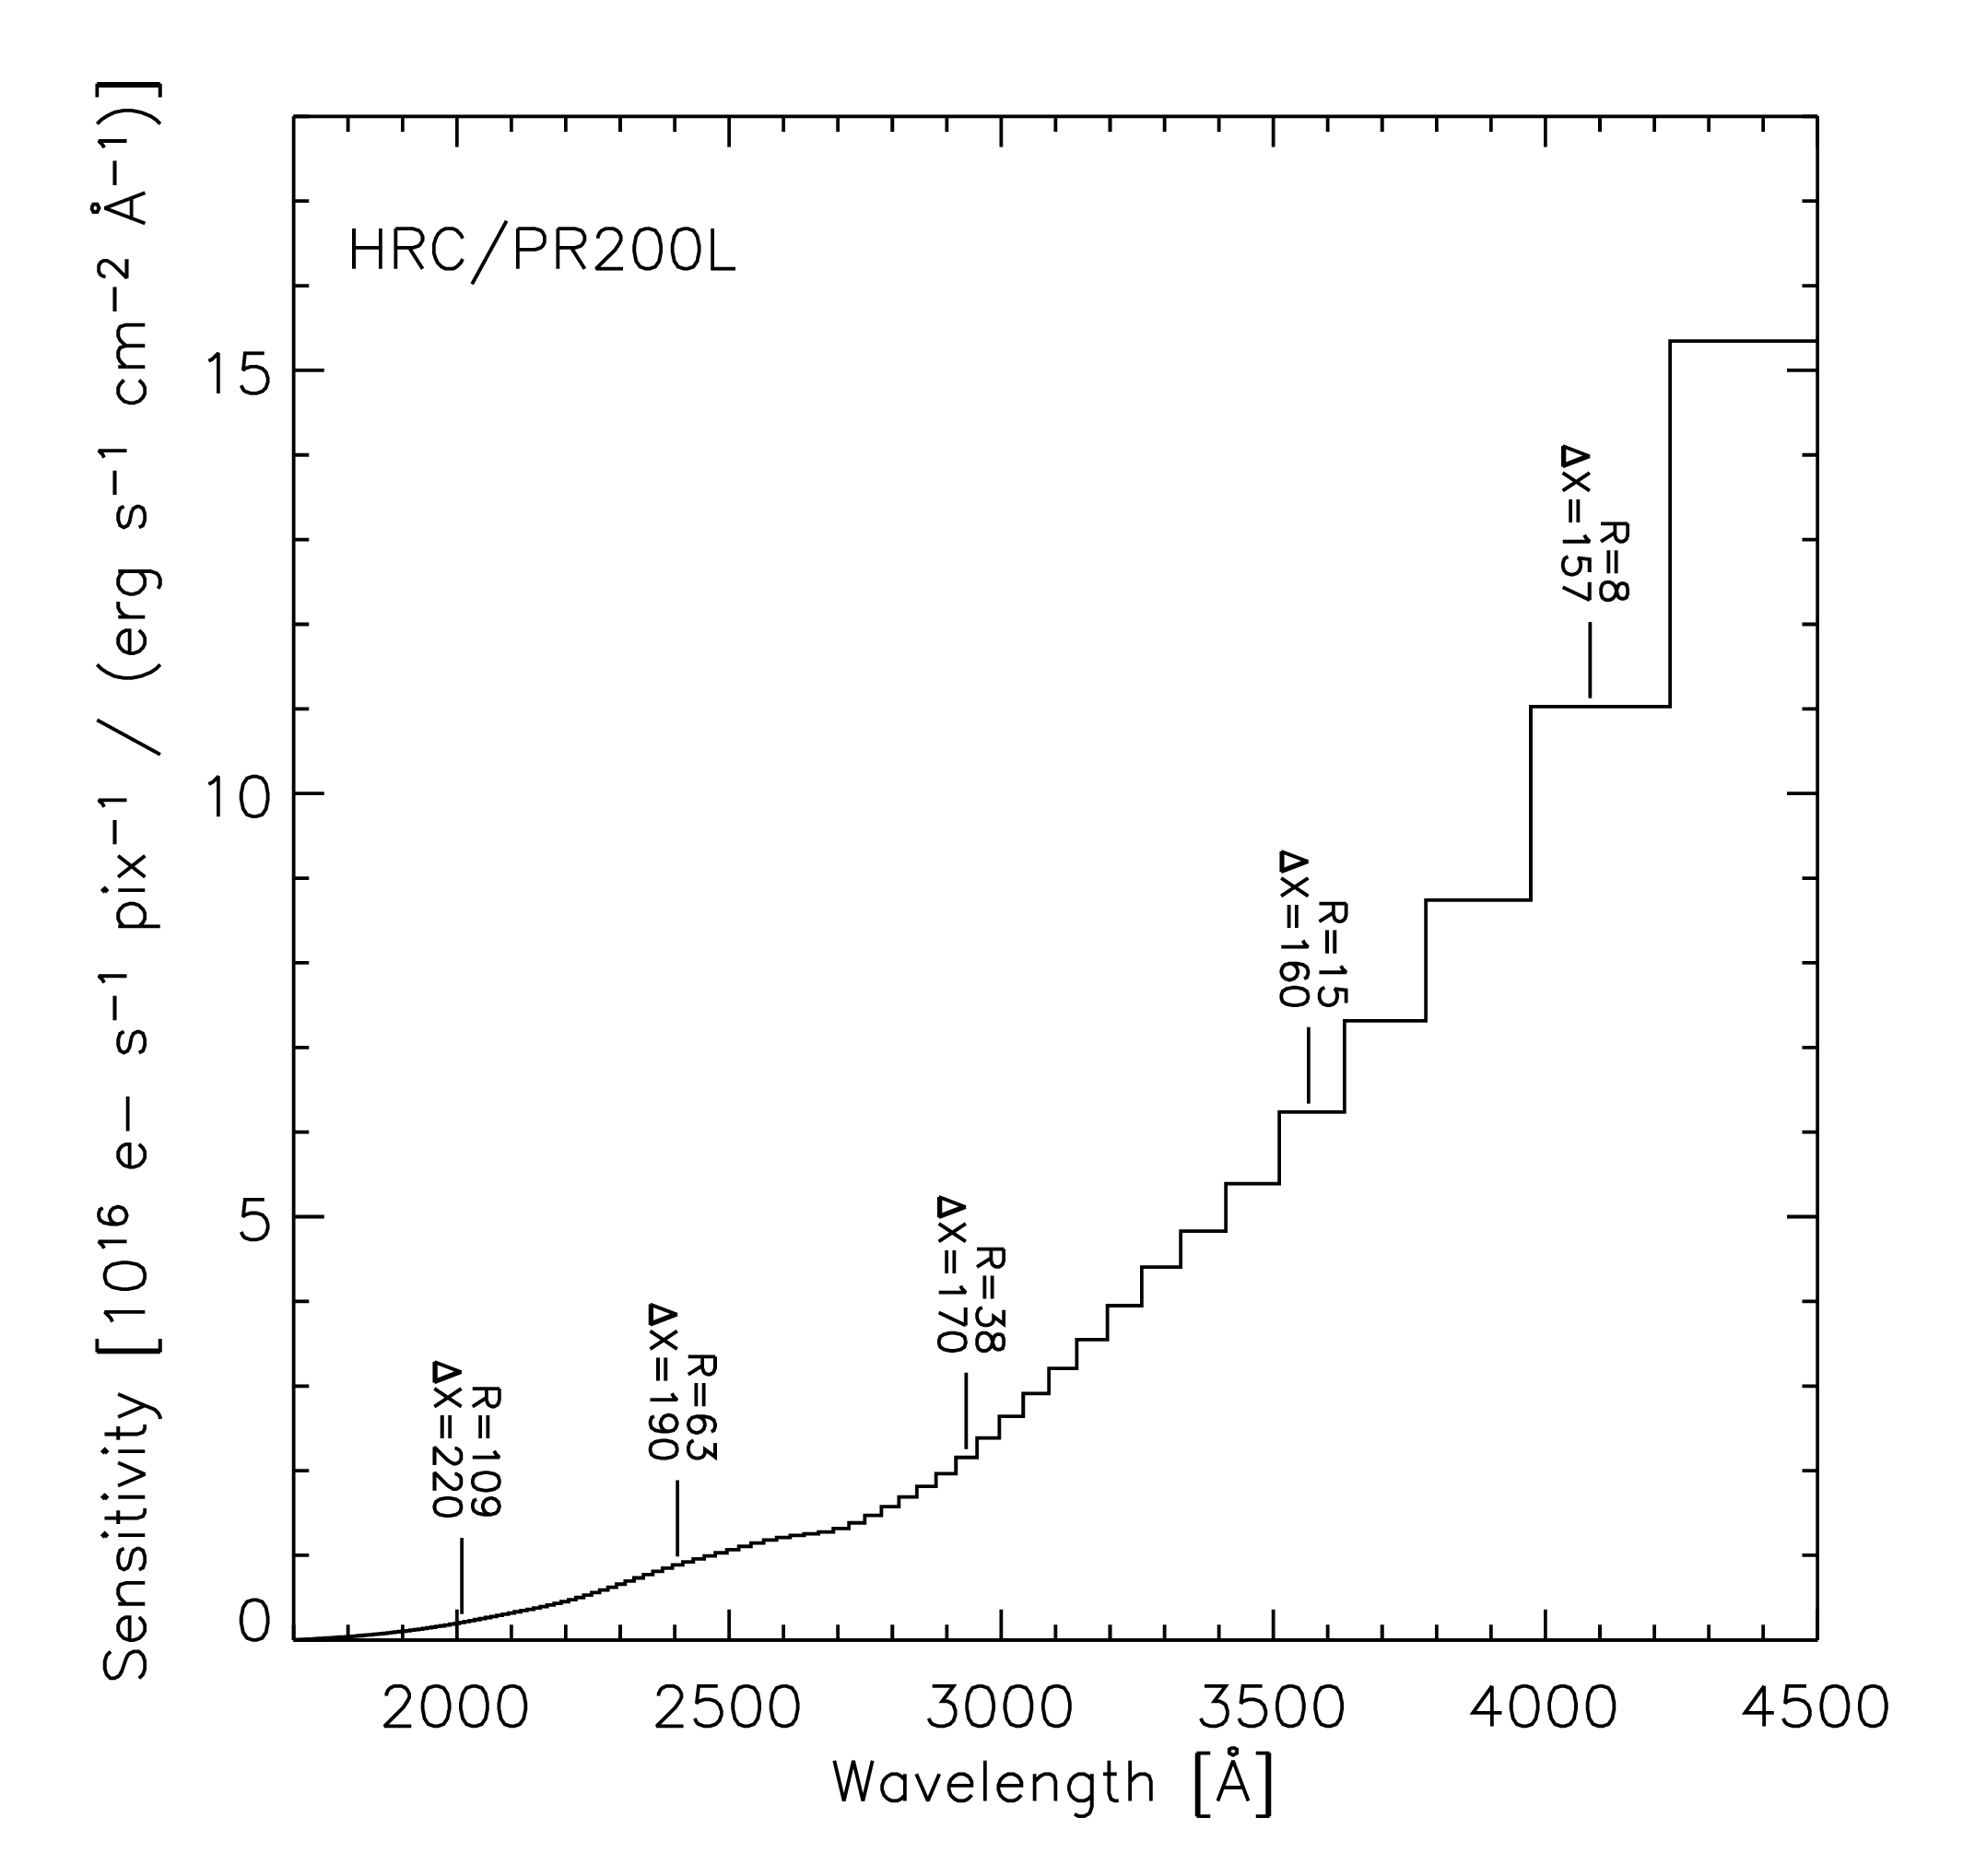
6.3.3 HRC PR200L
Figure 6.21 shows the sensitivity versus wavelength and the wavelength range of the HRC pixels for prism PR200L. The dispersion peaked at 5.3 Å/pix at 1800 Å, but dropped to 105 Å/pix at 3500 Å and then to 563 Å/pix at 5000 Å. Consequently, the spectrum piled up at longer wavelengths, where a range of 1500 Å was spanned by only 8 pixels. For bright objects, this effect could lead to saturation and blooming of the CCD, which could affect other spectra. The dispersion also varied by ±4% at 2000 Å between opposite corners of the detector. The tilt of the prism caused an offset of up to ~250 pixels between the CCD positions of the direct image and the PR200L spectrum of an object (Figure 6.21), and caused a similar amount of vignetting along the low-x side of the HRC image. Consequently, an additional prism aperture was defined with a reference point offset by 7.4 arcseconds from the geometric center of the CCD. The wavelength solution used by the aXe/HSTaXe data reduction software (see Section 6.3.7) accounts for this aperture offset.
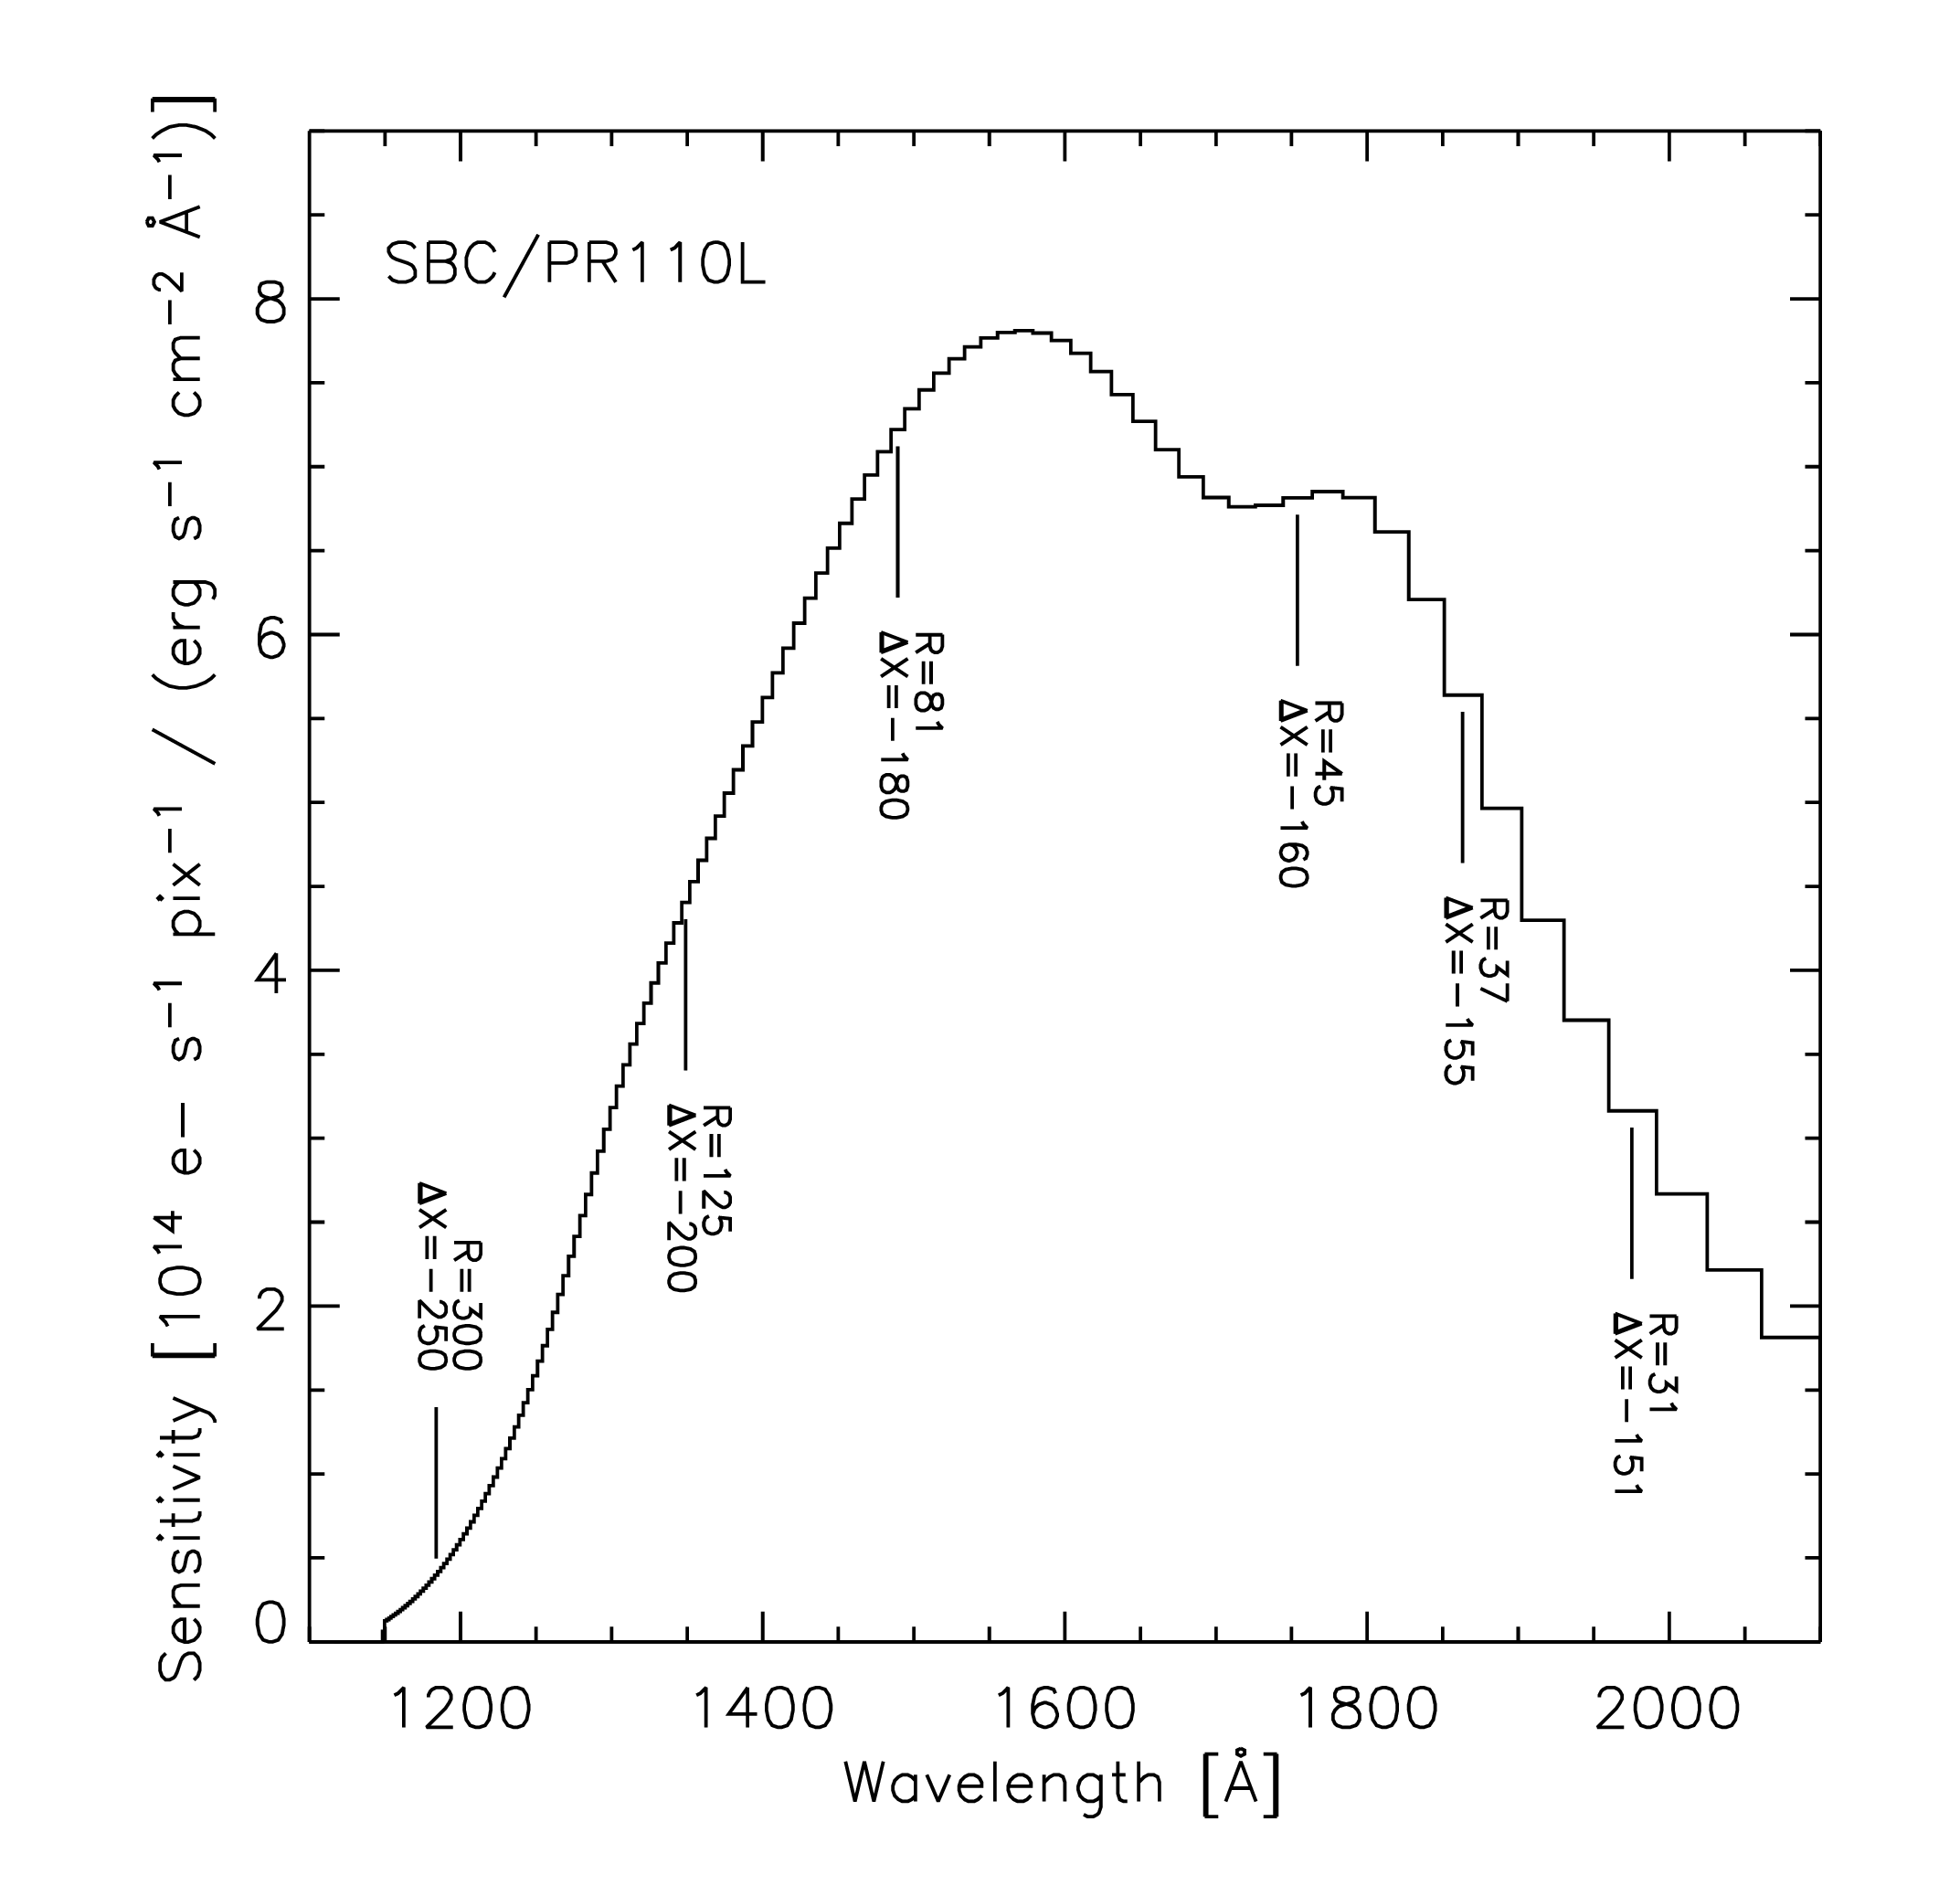
6.3.4 SBC PR110L
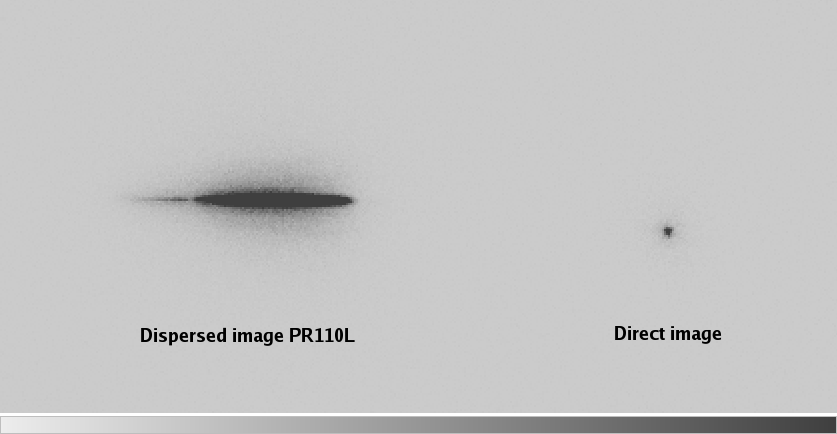
Figure 6.22 shows the sensitivity with wavelength and the wavelength range of the pixels for PR110L. This prism is sensitive below 1200 Å and includes the geocoronal Lyman α line, so it is subject to large background signal. The dispersion is 2.6 Å/pix at Lyman α and decreases to 21.6 Å/pix at 1800 Å. The declining efficiency of the CsI MAMA detector beyond ~1800 Å occurs before the long wavelength pile-up, but observations of standard stars indicate that the throughput is ~1000 times higher at 4000 Å than indicated in Figure 4.14. Observations of stars redder than spectral type F experience significantly higher counts between 2000 Å and 6000 Å, with a peak count rate at ~3500 Å. For G stars, this peak can be ~3 times larger than the maximum UV count rate. This red leak and the geo-coronal Lyman α must not exceed the MAMA Bright Object Protection (BOP) limits (see Section 4.6). The prism's optical tilt causes an offset of up to ~250 pixels between the positions of the direct image and the PR110L spectrum of an object (Figure 6.22), and causes a similar amount of vignetting along the high-x side of the SBC image. Figure 6.23 demonstrates this offset with the summed direct image and PR110L image of the standard star WD1657+343. An appropriately offset aperture is automatically implemented by the planning software for all PR110L observations. The wavelength solution used by aXe/HSTaXe (Section 6.3.7) accounts for this aperture offset.
6.3.5 SBC PR130L
The short wavelength cut-off of the PR130L prism at 1250 Å excludes the geo-coronal Lyman α, so PR130L is the preferred disperser for faint object detection between 1250 Å and 1800 Å. The dispersion varies from 1.65 Å/pixel at 1250 Å to 20.2 Å/pixel at 1800 Å. Figure 6.24 shows the sensitivity versus wavelength, along with the resolving power (R) and the offset from the direct image in pixels (Δx) as functions of wavelength. As for PR110L, Bright Object Protection must be considered when using this prism, even though the background count rate is lower (see Section 4.6). Just like the other prisms, the direct and dispersed images use different apertures with a small angle maneuver between them. This aperture offset is accounted for in the aXe/HSTaXe software (Section 6.3.7).

6.3.6 Observation Strategy
The normal observing technique for all ACS spectroscopy is to obtain a direct image of the field followed by the dispersed grism/prism image. This technique allows the user to determine the wavelength zero points from the positions of the sources in the corresponding direct images. For WFC and HRC, the scheduling system automatically inserts a default direct image for each spectroscopic exposure, e.g., a 3 minute F606W exposure for G800L and a 6 minute F330W exposure for PR200L. The user may override the default image by setting the optional parameter AUTOIMAGE=NO. A direct image can then be manually defined with a different filter and/or exposure time or it can be eliminated entirely if the spectroscopic exposures are repeated or if no wavelength calibration is required. No default direct images are obtained for SBC prism exposures because of Bright Object Protection requirements (Section 7.2). The direct image must always be specified manually and satisfy the BOP limits, which will be more stringent than for the dispersed image. Because of the offsets between the direct imaging and prism apertures, the SAME POS AS option will generally not have the desired effect for prism spectroscopy. Users who wish to specify offsets from the field center by means of the POS TARG option should do so by explicitly specifying the same POS TARG for the direct imaging and prism exposures.
Table 6.4 lists the V detection limits for the ACS grism/prism modes for unreddened O5V, A0V, and G2V stars generated by the ETC. These limits were computed for WFC and HRC using the parameters # Frames=2 and GAIN=2. An average sky background was used, but users should be aware that limiting magnitudes are sensitive to background levels, e.g., the limiting magnitude of an A0V star in the WFC using the F606W filter changes by ±0.4 magnitudes at the background extremes.
Table 6.4: V detection limits for the ACS grism/prism modes.
Mode | V limit (S/N = 5, exposure time = 1 hour) | Reference wavelength (Å) | ||
O5V (Kurucz model) | A0V (Vega) | G2 V (Sun) | ||
WFC/G800L | 24.2 | 24.4 | 24.9 | 7000 |
HRC/G800L | 23.4 | 23.6 | 24.2 | 7000 |
HRC/PR200L | 25.6 | 22.7 | 18.8 | 2500 |
SBC/PR110L | 24.9 | 20.9 | 9.3 | 1500 |
SBC/PR130L | 25.6 | 21.5 | 9.9 | 1500 |
Chapter 9 provides details of the calculations. Depending on the wavelength region, the background must also be taken into account in computing the signal to noise ratio. The background at each pixel consists of the sum of all the dispersed light in all the orders from the background source. For complex fields, the background consists of the dispersed spectrum of the unresolved sources; for crowded fields, overlap in the spectral direction and confusion in the direction perpendicular to the dispersion may limit the utility of the spectra.
The ETC supports all the available spectroscopic modes of the ACS and is available for more extensive calculations. The current version employs the on-orbit determinations of the dispersion solution and sensitivity where available.
6.3.7 Extraction and Calibration of Spectra
Because ACS spectroscopy is slitless, the point spread function of the target modulates the spectral resolution. For extended sources, the size of the target in the dispersion direction limits the achievable resolution (ACS ISR 2001-02). The dispersions of the grism and prisms are well characterized, but the zeroth order of grism spectra are generally too weak to reliably set the wavelength zero point. For typical spacecraft jitter, wavelength zero points to ±0.4 pixels should be routinely achievable using a direct image taken just before or after the grism or prism image. The jitter information can be used to obtain more accurate coordinates for the center of the FOV. These coordinates allow one to determine better relative offsets between the direct and the spectroscopic images. The red wavelength range of each pixel in G800L images is small enough that fringing can modulate the spectra. The peak-to-peak fringe amplitude was about 30% at 9500 Å for the HRC, and it is about 25% for the WFC. Models of the fringing in the WFC and HRC are described in ACS ISR 2003-12. In practice, the fringing is significantly reduced by the smoothing effects of the PSF and intrinsic object size in the dispersion direction. ACS ISR 2008-01 shows that the errors due to fringing are less than 0.1% for continuum sources and can therefore be neglected. For narrow emission lines, however, fringing can cause line flux variations of 12% and more. For realistic scenarios like Wolf Rayet emission lines, variations of ~4% are seen.
The STSCI pipeline does not provide an extracted spectral count rate vs. wavelength, but two software packages, aXe/HSTaXe and slitlessutils, are available to extract, wavelength calibrate, and flux calibrate ACS grism and prism spectra. The HSTaXe GitHub repository also hosts 'cookbooks' in the form of Jupyter Notebooks showing examples of how to preprocess data from ACS and WFC3 slitless-spectroscopic modes and use HSTaXe to extract 1D spectra. The details of these cookbooks are presented in ACS ISR 2023-05. Full details of the original aXe package are presented by Kuemmel et al. 2009, PASP 121, 59.
We have introduced the new Python package, slitlessutils, to extract and simulate wide-field slitless spectroscopy for ACS and WFC3. The package is under active development, but the first stable version is available on GitHub and installable via PyPI with documentation on readthedocs. Although slitlessutils is independent of HSTaXe, it is offers the same spectral extraction algorithm while adding support for multiple orients using the LINEAR algorithm developed by Ryan, Casertano, & Pirzkal (2018). There are worked examples and comparisons to standard data and/or HSTaXe for the each of the main functionalities in the package.
ACS grism extraction for 47,919 sources were performed by the Space Telescope European Coordinating Facility (ST-ECF) and are available via the Hubble Legacy Archive. Information about these extractions is available at the HLA ACS/WFC grism data release web page.
-
ACS Instrument Handbook
- • Acknowledgments
- • Change Log
- • Chapter 1: Introduction
- Chapter 2: Considerations and Changes After SM4
- Chapter 3: ACS Capabilities, Design and Operations
- Chapter 4: Detector Performance
- Chapter 5: Imaging
- Chapter 6: Polarimetry, Coronagraphy, Prism and Grism Spectroscopy
-
Chapter 7: Observing Techniques
- • 7.1 Designing an ACS Observing Proposal
- • 7.2 SBC Bright Object Protection
- • 7.3 Operating Modes
- • 7.4 Patterns and Dithering
- • 7.5 A Road Map for Optimizing Observations
- • 7.6 CCD Gain Selection
- • 7.7 ACS Apertures
- • 7.8 Specifying Orientation on the Sky
- • 7.9 Parallel Observations
- • 7.10 Pointing Stability for Moving Targets
- Chapter 8: Overheads and Orbit-Time Determination
- Chapter 9: Exposure-Time Calculations
-
Chapter 10: Imaging Reference Material
- • 10.1 Introduction
- • 10.2 Using the Information in this Chapter
-
10.3 Throughputs and Correction Tables
- • WFC F435W
- • WFC F475W
- • WFC F502N
- • WFC F550M
- • WFC F555W
- • WFC F606W
- • WFC F625W
- • WFC F658N
- • WFC F660N
- • WFC F775W
- • WFC F814W
- • WFC F850LP
- • WFC G800L
- • WFC CLEAR
- • HRC F220W
- • HRC F250W
- • HRC F330W
- • HRC F344N
- • HRC F435W
- • HRC F475W
- • HRC F502N
- • HRC F550M
- • HRC F555W
- • HRC F606W
- • HRC F625W
- • HRC F658N
- • HRC F660N
- • HRC F775W
- • HRC F814W
- • HRC F850LP
- • HRC F892N
- • HRC G800L
- • HRC PR200L
- • HRC CLEAR
- • SBC F115LP
- • SBC F122M
- • SBC F125LP
- • SBC F140LP
- • SBC F150LP
- • SBC F165LP
- • SBC PR110L
- • SBC PR130L
- • 10.4 Geometric Distortion in ACS
- • Glossary