3.3 Transfer Mode Binary Stars and Extended Objects
In Transfer mode, the FGS scans its IFOV across a target to generate a time-tagged (40 hz) mapping between the position of the IFOV (in both X and Y) and counts in the four PMTs. These data are used to construct the interferogram, or transfer function, of the target via the relation
Sx = (Ax – Bx) / (Ax + Bx)
as described in Chapter 2. The data from multiple scans are cross correlated and co-added to obtain a high SNR transfer function.
In essence, Transfer mode observing is conceptually equivalent to sampling an object’s PSF with milliarcsecond pixels. This enables the FGS to resolve structure on scales finer than HST’s diffraction limit, making it ideal for studying close binary systems and/or extended objects.
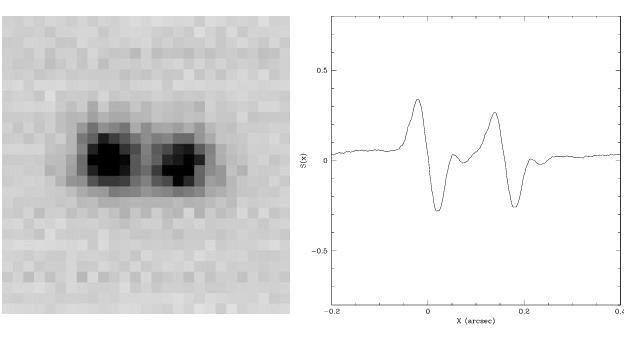
The transfer function of a multiple star system is a normalized linear superposition of the S-Curves of the individual stars, with each S-curve scaled and shifted by the relative brightness and angular separation of the components. If the components are widely separated (> ~60 mas), two S-Curves are clearly observed in the transfer function, as illustrated in the left panel of Figure 3.1. Smaller separations result in merged S-Curves with modulation and morphology differing significantly from that of a single star. Figure 4.3 illustrates these points.
By using point source S-curves from the calibration library one can deconvolve the composite observed transfer function of a binary star into component S-Curves (done by either Fourier Transforms or semi-automated model fitting) to determine the separation, position angle, and relative brightness of the components. If enough epochs of data are available, the time-tagged position angles and angular separations can be used to construct the apparent relative orbit, from which one can derive the parameters P, a, i, ω and Ω which define the true relative orbit. Note that the semi-major axis is an angular quantity; to convert it to a physical length, one must know the object’s distance (which can be obtained from parallax measurements).
3.3.1 Observing Binaries: The FGS vs. HST’s Cameras
The FGS, while capable of very-high angular resolution observations, is not an “imaging” instrument like HST’s cameras. However, the ability to sample the S-curve with milli-arcsecond resolution allows the FGS to resolve structure on scales too fine for the cameras. To illustrate, we present a comparison between binary observations with HST’s Planetary Camera (PC) and with FGS1r in Figure 3.1. The image at left is a PC snapshot image of the Wolf-Rayet + OB binary WR 146 (Niemela et al. 1998). To the right is a simulated FGS1r “image” of this binary shown at the same scale. With the 0.042" pixels of the PC, the binary pair is clearly resolved. Based on point-spread function (PSF) photometry, Niemela et al. publish a separation of 168 ±31 mas for this pair. In comparison, an analysis of the FGS “observation” of the binary yields a separation of 168±1 mas, a far more accurate result.
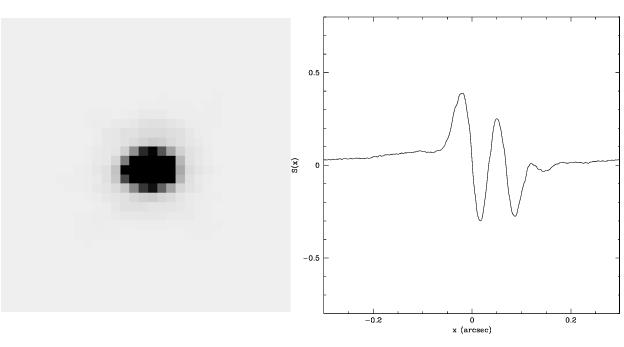
In Figure 3.2, we show a TinyTIM simulation of a PC image (as a stand-in for WFC3) of a 70 mas binary and an FGS observation of the same simulated pair. Note the PC image suggests—by its shape—that the observed binary is not a point source. However, it would be difficult to determine an accurate component separation or brightness ratio from this image. This is not a problem for the FGS, where both components are easily resolved, and an accurate separation and mass ratio can be determined.
3.3.2 Transfer Mode Performance
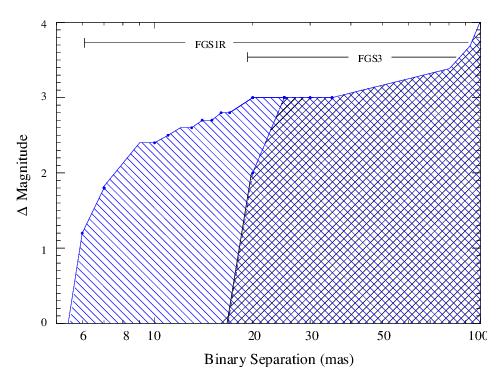
The most relevant way to express the FGS Transfer mode performance is through its ability to detect and to resolve components of a multiple component system. Figure 3.3 is a plot of the predicted parameter space defined by the separation in milli-arcseconds and the relative brightness of the components of a binary system. The shaded areas are the domains of success in resolving binary systems for both FGS3 and FGS1r. The extension of FGS1r into the smaller separation parameter space is attributed to an optimized S-Curve achieved by proper adjustment of the articulating mirror assembly (see Chapter 2 for more details), and to the fact that its fringes are highly stable in time. (FGS3, by comparison, suffers a persistent random variability of its x-axis fringe which precludes it from reliably studying binary systems with separations less than about 20 mas.) These data originate from simulations and are supported by a special assessment test run aboard the spacecraft in May 1998 as well as GO science data (see Appendix B for more details).
Table 3.1: FGS1r TRANSFER Mode Performance: Binary Star
Minimum | Estimated | MaximumΔMag | Maximum V |
|---|---|---|---|
71 | – | 1.0 | 14.0 |
10a | – | 1.0 | 15.0 |
15 | 2 | 2.0 | 16.6 |
20 | 1 | 2.5 | 16.2 |
20 | 2 | 3.0 | 16.2 |
50 | 1 | 3.5 | 15.5 |
1 This represents detection of non-singularity under ideal conditions. Reliable measurements of the angular separation might not be achievable.


