5.2 Transfer Mode Calibrations and Error Sources
Table 5.2 summarizes Transfer mode sources of error and associated calibrations. Each entry is described in the subsections below.
A Transfer mode observation contains multiple scans of a target. To obtain optimal S/N values, the individual scans are cross-correlated, binned, and co-added. The reliability of this process is dominated by spacecraft jitter for targets with V < 14.5, and by photometric noise for fainter targets.
Background and Dark Subtraction
Targets fainter than V ~ 14.5 are increasingly affected by dark counts which reduces the amplitude of the S-Curve (since these contributions are not coherent with the light from the star. see Chapter 7). The instrumental dark counts have been measured as part of the STScI FGS calibration program (and are listed in Table 2.1). These values are needed for the analysis of data from Transfer mode observations of stars with V>14.
Table 5.2: FGS1r Transfer Mode Calibrations and Error-Source Summary
Correction | Pre-Calibration Error Extent | Calibration Error | Comments |
|---|---|---|---|
Background and detector noise | – | – | For bright backgrounds, use data serendipitously acquired during the FGS servo slew to the target. For dark measurements, use STScI calibration data. |
HST jitter | 2–4 mas: quiet; | < 0.1 during quiescence | Use guide star data to remove HST jitter. Highly corrupted scans are deleted. |
Drift | 5–20 mas: 2 guide star FineLock. | < 0.5 | Cross correlation of S-Curve scans during post observation data processing removes drift errors. |
S-Curve temporal variability | ~1% in FGS1r | limits | Monitor standard star (Upgren69). |
S-Curve color dependence | ~2% | limits | Use calibration point source (i.e., an unresolved star) of appropriate (B-V) color. |
PMT Sensitivity Differences
Although individual PMT sensitivities in an FGS differ, these differences do not introduce a significant source of error in Transfer mode observations. Differences in the PMT response manifest themselves as a bias (offset) of the S-Curve. This bias is present in the calibration standard star S-Curves (the single stars) as well, and so the effect is neutralized when deconvolving the science target Transfer Function into its component single S-Curves (provided the spectral colors of the science and reference targets are well matched).
Jitter
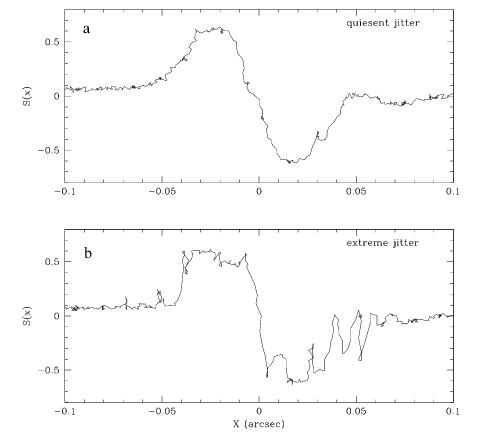
Typically, quiescent vehicular jitter is about 2–4 mas in amplitude on timescales of minutes. With the solar panels installed in March 2002 during SM3B, the large 150 mas amplitude disturbances associated with the day/night orbital transitions of HST do not occur. Spacecraft jitter is removed by using the guide star centroids for quiescent times, or by eliminating intolerably corrupted scans or segments of scans from the co-addition process. For illustration, Figure 5.4 shows the effects of jitter on the FGS1r interferogram (single scan).
Drift
Drift is defined in Chapter 7, and its application to Position mode observations has been discussed earlier in this chapter. Drift is also apparent in Transfer mode observations but its removal from the raw data is straightforward; the cross-correlation of S-Curves, prior to binning and co-adding, automatically accounts for drift. Each individual S-Curve is shifted so that the particular feature of the S-Curve used for the cross correlation coincides with that of the fiducial S-Curve. However, the reliability of implicitly removing the drift is only as good as the accuracy of the cross correlation procedure, which becomes photon noise dominated for stars fainter than V=15 (i.e., cross correlation of scans is not reliable for V>15, hence drift can not be removed from such observations).
For bright stars with V < 13, FGS drift is estimated to degrade the resolution of Transfer mode observations by about 0.5 mas. For fainter stars, the degradation is worse. If an observation of a faint star (V > 15) was subject to typical drift (10 to 12 mas), then the estimated loss of angular resolution would be ~ 3 mas.
Instrumental Stability
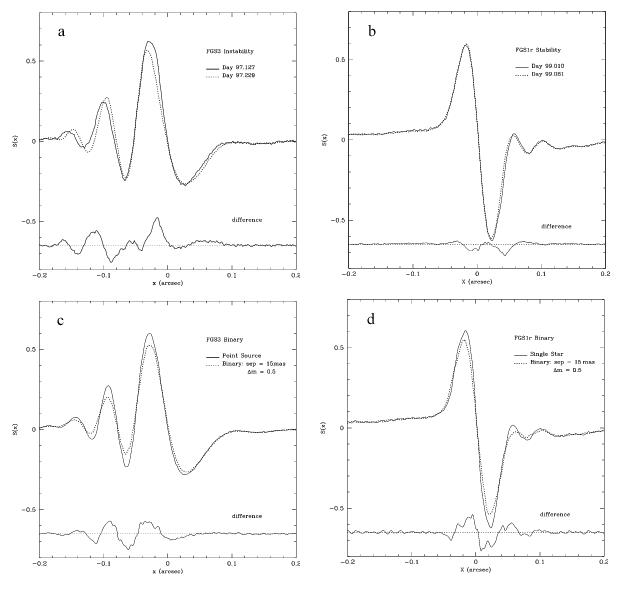
Analysis of observations of resolved objects (i.e, binary systems or extended sources) involves the de-convolution of the observed transfer function using reference S-Curves of point sources. The repeatability, or temporal stability, of point-source S-Curves has a direct effect on the reliability (or accuracy) of the scientific result. FGS3 continued to demonstrate a variability of ~ 15% in its X-axis S-Curve (as determined from repeated observations of a standard star). This effectively rendered FGS3 unreliable for observing close (separations < 20 mas) binary systems. However, FGS1r has demonstrated repeatability at the 2% level, implying reliable measurements of binary systems down to 7 mas.
Figure 5.5 illustrates FGS3’s persistent variability and FGS1r’s stability over comparable timescales. Figure 5.5a shows FGS3’s inherent variability in the S-Curves of the same point source over a 102-day span in 1997. Note this intrinsic variability in the instrument is indistinguishable from its interferometric response to a 15 mas binary with Δm = 0.5 mag (when compared with a point-source, as shown in Figure 5.5c). In contrast, the stability of FGS1r (Figure 5.5b) easily permits detection of the 15 mas binary system (Figure 5.5d) when compared to a point-source. We note the “difference” seen in Figure 5.5dd are due to systematic changes in the observed interferogram (i.e., the object is resolved), not random effects.
As was discussed in Chapter 4, FGS1r has shown a slow “evolution” of its y-axis S-curve. This should not compromise the reliability of this instrument for observing close binary systems; STScI will continue to observe calibration standards in each cycle as needed so that GOs have access to calibration data appropriate of a given epoch.
Interferometric Response and Source Color
The morphology and amplitude of the S-Curve is sensitive to the spectral color of the source. The point-source reference S-Curve used for comparison to the observed fringes of a science target should match the color of the target to within δ(B - V) = 0.3, especially when analyzing observations of close binaries (separations < ~40 mas). The point source standards observed by FGS1r as part of the yearly observatory calibration plans are chosen to meet the needs of the cycle’s GO science program. This includes consideration of both the science target colors as well as the filter (F583W or F5ND) to be used by the GOs. For example, the cycle 10 FGS1r reference star color library is given in the Table 5.3.
Table 5.3: Library of cycle 10 calibration point source S-curves
Star | R.A. | Declination | V mag | B-V | Filter |
|---|---|---|---|---|---|
WD0148+476 | 01 52 02.9 | +47 00 06 | 12.5 | 0.0 | F583W |
Latcol-B | 05 59 27.3 | +22 34 39 | 10.5 | 0.2 | F583W |
Upgren69 | 00 42 42.2 | +85 14 14 | 9.6 | 0.5 | F583W |
HD 233877 | 11 52 54.1 | +49 23 46 | 9.7 | 1.1 | F583W |
SAO185689 | 17 45 06.9 | -29 08 37 | 9.3 | 1.5 | F583W |
Latcol-A | 05 59 20.1 | +22 34 50 | 9.7 | 1.9 | F583W |
μ Col | 05 45 59.8 | -32 18 23 | 5.2 | -0.3 | F5ND |
HD 143101 | 16 01 06.5 | -54 34 40 | 6.1 | 0.2 | F5ND |
HD 31975 | 04 53 05.6 | -72 24 27 | 6.3 | 0.5 | F5ND |
HD 37501 | 05 34 57.4 | -61 10 34 | 6.3 | 0.8 | F5ND |
HD 59149 | 07 29 30.7 | +19 37 59 | 6.7 | 1.3 | F5ND |
Transfer Mode Scale as a Function of HST Roll Angle
Testing of FGS1r during its commissioning in Cycle 7 revealed that the measured separation and position angle of the stars in a binary system is sensitive to the system’s orientation relative to the interferometer axis and hence the HST roll angle. Over time, as a system is observed at a variety of HST roll angles, this introduces systematic errors into the derivation of the binary’s apparent orbit. The error in the measured separation of the stars can be as large as ~ 1% of the true projected separations, so measurements of wide binaries are affected more than those of close systems. The effect is believed to be due to a small rotation error of the Koesters prism(s) about the normal to its entrance face.
During Cycle 9 a wide binary (KUI 83, component separation ~0.3”) was observed with FGS1r in Transfer mode at three different HST roll angles (V3roll = 25, 43, 60 degrees). The measured total separation of the components was constant to about 1 mas, indicating that the scale is not dependent upon vehicle roll, in contradiction to the Cycle 7 results. STScI will monitor this aspect of FGS1r’s performance, but at a low frequency (approximately every 2 to 3 years).

