4.5 Uncertainties in Transfer Mode Data
This section discusses several error sources associated with analysis of Transfer Mode data:
- Spacecraft jitter.
- FGS drift.
- Temporal variability of the S-curves.
- Wavelength dependence of the S-curves.
- Roll dependence of the FGS plate scale.
Spacecraft Jitter
When the FGS is used as an astrometer in Transfer Mode the observer typically specifies between 15 and 35 individual scans of the target in an exposure. Periods of extreme spacecraft jitter or telemetry dropouts can compromise the data from an individual scan. The usually mild jitter of the spacecraft is tolerable in the averaging process. But for incidents of extreme jitter, it is best to disqualify all corrupted scans from further analysis, an option supported by ptrans.
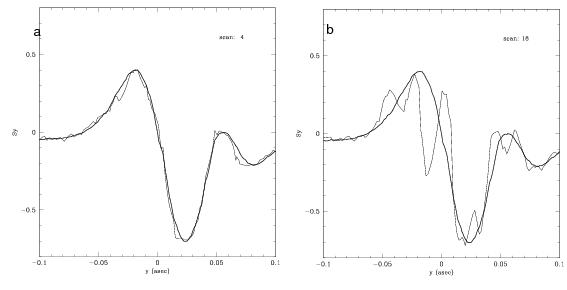
To obtain high signal-to-noise S-curves, the single scans must be cross-correlated and co-added. Any (small) spacecraft motion that occurs during each scan will effectively blur the individual S-curves, ultimately causing the co-added S-curve to suffer some loss of spatial resolution. (Experience has shown that using the 40hz guide star data to “de-jitter” the Transfer Mode scans yields no benefits because the guide star centroids are photon noise dominated over such short integration periods.) Figure 4.13 compares the S-curves from two scans in the same exposure, one obtained during a time of nominal HST jitter (Figure 4.13a), and the other observed during a time of high spacecraft jitter (Figure 4.13b - HST was emerging from orbit “night” into orbit “day”, a terminator transition). The badly jittered scan is best deleted from the co-addition. These plots were produced with ptrans. In each figure, the individual scan is plotted along with the current iteration’s coadded, unsmoothed S-curve.
Spacecraft and FGS Drift
As discussed in the calibration chapter, astrometry stars observed in Position Mode more than once in a given visit reveal that the FGS’s field of view drifts across the sky over the course of an HST orbit. This drift is also apparent in Transfer Mode observations. The cross-correlation of S-curves prior to co-adding automatically accounts for (removes) drift in Transfer Mode observations. Each single-scan S-curve is shifted so that the particular feature of the S-curve used for the cross correlation (typically the 100 mas region centered on the fringe’s zero point crossing) coincides with that of the fiducial S-curve. The reliability of implicitly removing the drift is only as good as the accuracy of the cross correlation procedure.
Proper cross correlation is relatively straightforward for bright objects (V < 14), but for fainter objects it becomes more difficult, just as binning and co-adding becomes all the more important. In such cases it might be advantageous to construct a drift model iteratively by time tagging the shifts determined by the cross-correlation procedure. Fitting of these shifts to a linear or quadratic drift model might align the individual S-curves more reliably than a procedure that depends solely on individual photon noise dominated scans. For bright stars with V < 14, drift in the FGS is estimated to degrade the resolution of Transfer Mode observations by about 1 mas. For fainter stars, the degradation will increase significantly in a way that depends on details of HST’s orbital environment during the visit. It’s noted in the discussion of drift in the FGS Instrument Handbook that the origin of this phenomenon is not well understood. It is not repeatable, and its amplitude depends weakly upon the declination of HST’s V1 axis. If a particular observation of a faint star (V > 15) was subject to typical drift of ~10 to 12 mas, then the estimated loss of angular resolution would be of order 4 mas.
Temporal Variability of S-Curves
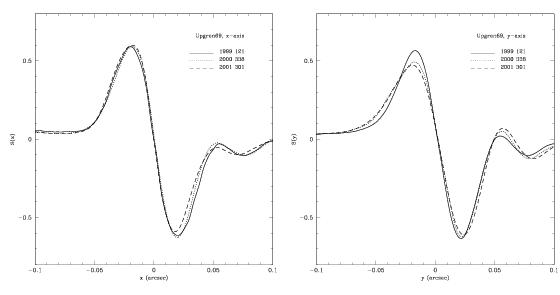
Measurements of the standard star Upgren69 through the period when FGS3 functioned as the astrometric science instrument revealed a persistent but random temporal variability of the S-curve morphology and amplitude along both the x and y-axis. The large variability (~10%) of its x-axis S-curve rendered the instrument unusable for reliably resolving binary systems with separations less than ~20 mas.
Fortunately, FGS1r has not shown this behavior. Instead, changes in the FGS1r S-curves since October 1998 (the last time the AMA was adjusted) have been monotonic, and varies on long, year-like time scales. (FGS3’s x-axis S-curves randomly varied on time scales of orbits!) Figure 4.14 plots the x and y-axis FGS1r S-curves obtained from observations in May 1998, Dec. 2000, and Oct. 2001. The x-axis S-curves have changed little over this time, while those along the y-axis showed considerable monotonic evolution between 1998 and 2000. Since late 2000, however, the changes have slowed dramatically. This evolution is thought to be a result of desorption of H2O from graphite epoxy within the FGS which changes the alignment of the FGS with the telescope’s optical axis. Because of HST’s spherically aberrated wavefront, higher order aberrations are induced which results in the S-curve evolution. A comprehensive discussion of this topic is provided in the FGS Instrument Handbook.
- Obtain an observation of a calibration reference star at nearly the same time of the science observation.
- Select from the library of calibration S-curves the one obtained closest in time to the science observation.
- Determine a correction algorithm which interpolates in time between S-curves taken from the S-curve library.
Calibration standards for binary and/or multi-component systems with small (sub-diffraction limited) separations may have to be observed close in time (~weeks) with the science target (as part of the GO proposal, or in coordination with the FGS calibration program). For less constrained programs, such as observations wide binary systems, selection of reference S-curves from the calibration library that are obtained within a year of the science observation should be adequate. (As part of the routine FGS calibration program, the standards in the FGS S-curve library are observed every cycle if needed to support the GO proposals.)
Interferometric Response and the Source’s Spectral Color
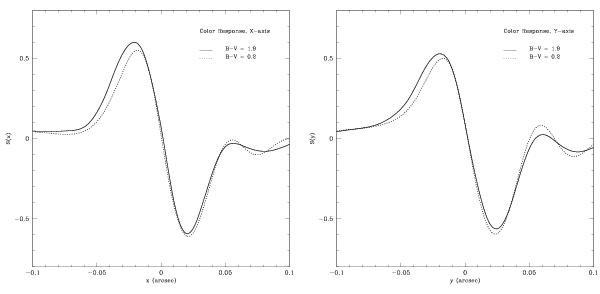
The FGS interferometric response is sensitive to the spectral color of the observed source. Semi-empirical modeling and observational experience has shown that when the color difference δ(B-V) between a standard reference star and a science target exceeds about 0.3 magnitudes, the residuals of the binary-fit deconvolution rise and the derived parameters determining the component separation, position angle, and relative brightness becomes less reliable. This effect is most important for binary’s with separations less than HST’s diffraction limit. Wider systems are much less sensitive, although the fits of derived models to the data degrades.
The FGS calibration program includes observations of standard, unresolved (presumed single) stars whose colors are comparable - within 0.2 to 0.3 magnitudes - to the targets in that cycle’s GO programs. Typically these are observed once per Cycle (if needed) and are available from the calibration library, which can be downloaded from the FGS Website. For a non-subtle illustration of the importance of this effect, Figure 4.15 compares the S-curves from observations (separated by hours to minimize temporal variations) of two standards which differ in δ(B-V) by 1.7 magnitudes (B-V = 0.2 and 1.9 for the dashed and solid lines, respectively).


