5.1 Position Mode Calibrations and Error Sources
FGS science data is processed at three distinct levels: the exposure, the visit, and the epoch. Each of these levels is subject to different sources of error. Table 5.1 summarizes the accuracies of Position mode calibrations. Most of the errors listed are statistical. Multi-epoch observations reduces the impact of these errors in the science data.
Table 5.1: FGS1r Position Mode Calibration and Error Source Summary
| Type of Calibration Correction | Pre-Calibration Error Extent | Calibration Error (mas) | Comments |
|---|---|---|---|
Exposure Level (per observation) Calibration Corrections: | |||
background and detector dark counts | – | – | Addressed by increasing the integration time for each centroid determination when observing faint stars. (to preserve the NEA). |
Star Selector Encoder fine bit errors | ~1 mas | 0.1 | Correction applied in the SSA,B->X,Y conversion. |
Centroid errors | Magnitude Dependent | ~ 1, V < 15 | Apply median filter. |
Relative PMT sensitivity | –~4 mas (V>15) | 0.1 mas | Analysis removes PMT mismatch effect; used to adjust for position centroid errors. |
Differential velocity aberration | ± 30 mas | 0.1 | Depends on HST velocity vector and target geometry, ephemeris errors |
Relative distortion across FOV (OFAD) | ~ 500 mas | ~0.3 mas | STScI calibration in filter F583W. |
Lateral color correction | ~1 mas relative shift for δ(B-V) = 1 | 0.1 mas | STScI standard yearly calibration at center of FOV. |
Cross filter calibration | ~7 mas | < 0.2 center | Relative positional shifts are calibrated for filters F583W and F5ND at FOV center. |
Visit Level Calibration Corrections: | |||
HST jitter | 2–4 mas: quiet; | < 0.1 during | Correction derived from guide star motion. Large jitter excursions could cause loss of lock or corrupt a data set; disqualify outliers. |
Drift | 5–20 mas: two GS FineLock. | < 0.2 | Special observing strategy for check stars; |
Epoch-Level Calibration Corrections: | |||
Temporal evolution of OFAD and plate scale. | <100> mas/year | 0.2 mas | Long-term stability monitor program: update OFAD coefficients and FGS star selector calibration. |
Exposure level calibrations address the per observation errors. The visit level corrections address the errors after an entire orbit of astrometry data are combined The epoch-level corrections include the long term changes in scale and distortion of the instrument. The residuals after combining data from multiple visits include the plate overlays and, for example, the determination of an object’s parallax and proper motion.
5.1.1 Position Mode Exposure Level Calibrations
The corrections and calibrations described below are applied by the FGS Calibration Pipeline.
Star Selector Encoder Fine Bit Errors
The star selector rotation angles are read as 21 bit integers. The 7 least significant bits (LSBs) are read by an optical resolving device that was calibrated during the manufacturing process. The size of the calibrated correction is about 1 mas with a residual of about 0.1 mas. Errors in the 14 most significant bits (MSBs) are absorbed by the OFAD calibration.
Position Centroiding
The location of a star in the FOV during a Position mode observation is determined by identifying the median of the 40 Hz SSA or SSB samples (while the target is being tracked in FineLock). The median measurement is robust against most spacecraft jitter, short-interval transients and telemetry dropouts. If faint targets (V > 16.0) are observed, the photometric noise results in a large noise equivalent angle. Spacecraft jitter and photometric noise contribute to the standard deviations about the median of up to 2 mas per axis for V < 14.5 and up to 3 mas per axis for V > 15.0. However, the repeatability of the centroid measurement (over smaller intervals of the exposure) is the true assessment of the precision of the measurement, typically 0.7 mas and 1.5 mas for targets where V < 14.5 and V > 15.0 respectively.
PMT Sensitivities and Position Centroid Adjustment
The effect of PMT sensitivity on FGS observations is discussed in Appendix A. In order to accommodate the differences between the two PMTs along each axis, the FGE computes an average difference (DIFF) and average sum (SUM) of their photometric response to the star over the first few FESTIMES in the WalkDown. These values are used in the calculation of the Fine Error Signal. The results are accurate for bright (V < 14.0) objects but become unreliable for fainter targets, a result of the short integration period and increasingly noisy photon statistics. The pipeline gathers photometric data over the entire WalkDown (typically 80 times as many samples) to achieve a better signal-to-noise and more reliable values of DIFF and SUM. These are used to recompute the Fine Error Signal and adjust the (x,y) centroids in post-observation data reduction.
Differential Velocity Aberration
Differential velocity aberration arises as a result of small differences in the angle defined by the HST velocity vector and the line of sight to targets in the FGS FOV. The HST PCS guides for zero differential velocity aberration (DVA) at one position in the FOV. The positions of targets elsewhere in the FOV must be corrected for DVA. Calibration errors in the relative alignment of the FGSs, catalog position errors of the guide stars, and ephemeris errors all contribute—though negligibly—to the errors in the differential velocity aberration correction. The actual adjustment to the target’s positions can be as large as ± 30 mas (depending on the target and velocity vector geometry) but are corrected by post-observation data processing to an accuracy of ± 0.1 mas.
Optical Field Angle Distortion (OFAD) Calibration
Field angle distortion introduces errors in the measurement of the relative angular separation of stars at varied positions across the FGS FOV. The distortion errors originate from:
- Radial distortions induced by the Ritchey-Chretian design of the OTA.
- Manufacturing irregularities in the FGS/OTA optical train.
- The optical reader produces errors in the 14 most significant bits of the 21-bit Star Selector A and B encoder values.
The distortion is independent of target magnitude, color, or exposure time, and depends only on the location of the object in the FGS FOV. The Space Telescope Astrometry Science Team (STAT) has calibrated the optical field angle distortion (OFAD) in FGS3 and maintained this calibration (the OFAD has a slow time dependence).
The data for calibrating FGS1r became available in December 2000. The analysis (by the STAT) was completed in June 2001. The distortion, on average about 500 mas across the FOV, is represented by two fifth-degree two-dimensional polynomials. Post-calibration residual errors are typically ~0.3 mas throughout most of the FOV. The OFAD calibration of FGS1r was part of the FGS1r commissioning calibration plan.
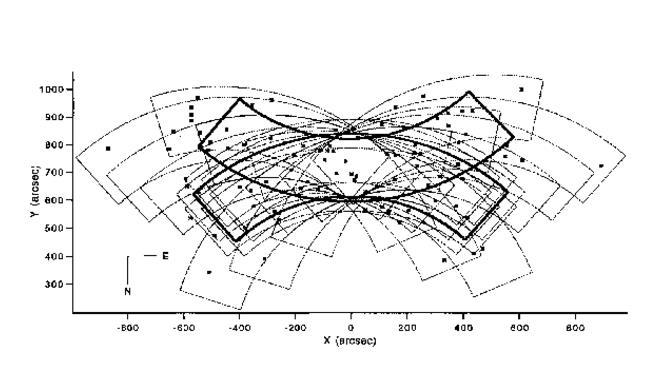
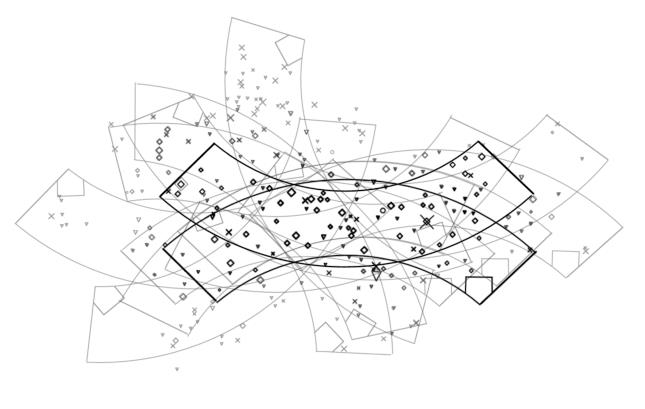
The OFAD residuals for FGS1r are smaller than those of FGS3 due to the design of the calibration test. The FGS3 data were acquired at a time when the roll of HST was restricted to be within 30 degrees of nominal for the date of the observations. The FGS1r test executed when the target field (M35) was close to the “anti-sun” position, i.e., when HST could be rolled over a full 360 degrees. Figure 5.1 shows an overlay of the pointings used for the FGS3 calibration, while Figure 5.2 shows the same for the FGS1r calibration. The freedom to rotate the field of view maximized the apparent effect of the distortions, making them more easily measured compared to the FGS3 test.
The accuracy of the astrometric catalog generated from ground based observations is insufficient for calibrating an FGS as a science instrument. As part of the OFAD calibration, it was necessary to derive an accurate star catalog. This requires that selected stars be observed at several HST pointings. In Figure 5.1 and Figure 5.2, the bold symbols denote stars that were observed as part of the calibration. For the FGS1r calibration, special care was taken to maximize the number of pointings which measured every star.
Lateral Color
The five-element corrector group (see box in Figure 2.1) is a collection of refractive elements tasked with the removal of astigmatism and the final collimation of the beam. It’s refractive properties introduce subtle changes to angle of propagation of the beam as a function of the spectral color of the source. This change causes the apparent position of the star in the FOV to shift slightly, an effect referred to as lateral color. The positional error introduced by is relevant when comparing the relative positions of two targets of extreme colors: for example, a color difference of δ(B – V) = 1 between two targets could introduce a ∼1 mas positional shift. An in-orbit assessment of lateral color associated with FGS1r was performed in December 2000 and again in December 2001 (and will be repeated in December 2002). A dedicated on orbit calibration of the lateral color shift in FGS1r was first performed in December 2000. A field of stars containing a blue star (A0) and a red star (M3) was observed at three HST roll angles that differed by about 60 degrees (the field was near anti-sun, so HST roll angle was unconstrained). The three-orbit test was repeated in December 2001. Since then the lateral color calibration has been monitored every two years. The results of these tests are available from the FGS Web site at:
http://www.stsci.edu/hst/instrumentation/fgs
5.1.2 Position Mode Visit Level Calibrations
Jitter
Significant enhancements to the HST pointing control system and the replacement of the original solar arrays have reduced quiescent vehicular jitter to 2–4 mas. Although small for most HST science applications, the jitter must be removed from astrometry data.
Since astrometric measurements are made sequentially, relating the measurements to one another requires a mapping of each measurement onto a fixed common reference that defines the visit. Guide star positional data, also telemetered at 40 Hz, are used to define jitter characteristics over the course of the visit. Using the time dependent guide star centroids, low frequency jitter (on time scales of minutes) can be removed from the target data.
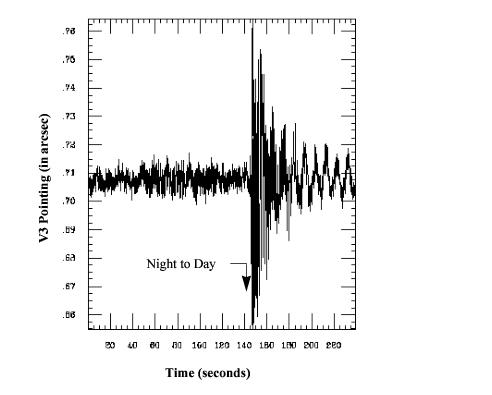
The pre-SM3B solar panels caused high frequency, large-excursion jitter, as HST transitioned to and from orbital day and night. These disturbances ranged in amplitude from 50 to 150 mas and lasted up to several tens of seconds. If particularly frenzied, a temporary or total loss of lock of the guide stars would result. An example of the jitter during the onset of a day/night transition is shown in Figure 5.3. The large vibrations increase the standard deviations of FineLock tracking in the three FGSs by up to a factor of eight over the pre-transition values. Fortunately, such instances were rare.
With the new solar arrays installed during SM3B, the day/night disturbances no longer cause significant vehicle jitter. With the new arrays, HST jitter is characterized by two low amplitude (~5 mas) vibrational modes at 0.5 and 1.2 Hz. A larger, intermittent (and infrequent) disturbance of up to 100 mas persists, however. Fortunately HST’s pointing control law damps this jitter away in about 10 seconds or less.
The overall residual from the “de-jittering” process is only ~ 0.1 mas, the small value testifying to the advantages of using a median filter in the centroid computation and to the excellent tracking of guide stars by the guider FGSs.
Drift
FGS drift was discussed in Chapter 7 with regards to observation strategy, i.e., the use of check stars to track apparent motion of the FOV during the visit so it can be removed during post-observation processing. There are two different classes of drift, depending on whether one or two FGSs guided the HST during the visit. With two FGSs guiding, drift is identified as a slow but correlated wander of the targets observed more than once during the visit. The amount of drift appears to be related to the intensity of the bright Earth entering the telescope during target occultations. Accordingly, the drift is highest for targets in HST’s orbital plane (~ 10 mas) and lowest for those at high inclination (~ 2 mas).
When only one FGS is used to guide the telescope, the drift is typically 20 mas over the course of the visit. The single guide star controls the translational motion of the spacecraft while the HST roll axis is constrained by the gyros. Gyro-induced drift around the dominant guide star ranges from 0.5 to 5 mas/sec, and is typically of order 1 mas/sec. Note the gyro drift is a spacecraft roll, and does not represent the translational motion of a target at the FGS (which will typically be ~0.01mas/sec). Over the course of a visit, the roll drift error measured by the astrometer can build up to 40 mas or more (but is typically less than 20 mas).
Regardless of the size of the drift, it can be characterized and removed by applying a model to the check star motions, provided the visit includes a robustcheck star strategy: a check star observation every 5–6 minutes (described in Chapter 7). At a minimum, two check stars measured three times each are needed to model translational and rotational drift.
Cross Filter Calibrations
For a target star (or any reference stars) brighter than V = 8.0 to be included as part of an FGS observation, it must be observed with the neutral density attenuator F5ND. As a result of the differing thicknesses of F583W and F5ND, and possibly a wedge effect between the two filters, the measured position of the bright target in the FOV will shift relative to the (fainter) reference stars. A cross-filter calibration is required to relate these observations, as relative positional shifts may be as high as 7 mas. Also, further evidence from FGS3 indicates these shifts are field dependent. If the effect is uncorrected, a false parallax will occur between the science and reference targets as the star field is observed at different orientations in the FOV. Since it would be prohibitive to calibrate the cross-filter effect as a function of field location, FGS1r cross-filter calibrations will be restricted to the center of the FOV. For reference, the uncertainty after the FGS3 cross-filter calibration is ~0.5 mas.
5.1.3 Position Mode Epoch-Level Calibrations
Plate Scale and Relative Distortion Stability
For FGS3, the plate scale and OFAD exhibits a temporal dependence on an average time scale of ~4 months and a size of several tens of milli arcseconds (predominately, a scale change). The evolution of the FGS3 OFAD revealed that the variability is probably due to the slow but continued outgassing (even after 10 years!) of the graphite epoxy structures in the FGS. A long-term stability monitoring test is executed bi-monthly to help measure and characterize the distortion and relative plate scale changes and thus update the OFAD. Post-calibration residuals are on average ± 1 mas along the X-axis and Y-axis. Better performance (of order ± 0.5 mas) is achieved in the central region of the FOV.
The FGS1r Position mode stability was coarsely monitored during Cycle 7. Large scale changes in its S-Curve, attributed to outgassing effects, show that the instrument was unstable (for high accuracy astrometry) during its first year in orbit, as expected. In early 1998 the evolution slowed, and by April 1998 FGS1r’s S-curves fully stabilized; a major prerequisite for the OFAD calibration was met.
The OFAD and lateral color calibrations were to have been performed during cycle 8 when the target field was at anti-sun and HST would not be roll constrained. Unfortunately this coincided with and was preempted by the Servicing Mission 3a. Rather than perform the calibrations under less favorable, roll-constrained conditions, STScI decided to defer the observations until December 2000, when the target field again has an anti-sun alignment. The analysis of the OFAD data were carried out as a “calibration out sourced” proposal led by members of the STAT from the University of Texas at Austin. The results of this calibration have been made available to STScI and reside as reference files used by the FGS calibration pipeline.
The science data that has accumulated since the beginning of cycle 8 can be fully calibrated with the OFAD calibration. Any temporal evolution since the beginning of cycle 8 is back-calibrated away by use of the long term monitoring observations that have been executing all along. Check the FGS Web pages for updates with regard to the OFAD calibrations.
Errors Associated with Plate Overlays
The errors associated with several of the corrections described above will not manifest themselves until data from individual visits are compared. The most dominant source of Position mode error are the OFAD and changes in the plate-scale. The derivation of a plate scale solution is described in the FGS Data Handbook. In general, for regions near the center of the pickle, residuals are smaller than 1 mas if the reference star field is adequately populated.


