HST Primer: Scientific Instrument Comparisons
Comparisons of each of the HST imaging and spectroscopic modes are shown.
Hubble Space Telescope observers are presented with several choices of instruments. In many situations, an observer will have to make a selection between complementary cameras of, for example, ACS/WFC and WFC3/UVIS, or of complementary spectrographs, COS and STIS.
The oldest instruments, STIS and ACS, suffer more severely from CTE losses due to the high radiation environment. The damaging effects of continuous radiation exposure on the CCDs are unavoidable, regardless of whether the camera is operating or not. For STIS, a “Summary of changes after SM4” is available at the end of HST Primer: Scientific Instrument STIS. For ACS, a summary of CTE considerations is available on HST Primer: Scientific Instruments ACS, WFC3, and FGS.
For this cycle, Python Exposure Time Calculators (ETCs) for all instruments are available and can be found at http://etc.stsci.edu/. ETCs use a new computing tool called PySynphot (that has replaced the STSDAS synphotsoftware package) and has access to the most up-to-date reference files.
HST Imaging
ACS, STIS, and WFC3 cameras are available this cycle. Decisions on which camera to use will be made based on wavelength, field of view, spatial resolution, sensitivity, and the availability of specific spectral elements or observing modes. The figures below provide a set of plots (based on WFC3 SMOV data1 but still valid for current WFC3 operations) comparing throughput and discovery efficiency for the cameras. Please note that COS/NUV is also available for imaging albeit over a very small field of view. For more information please see Chapter 6 in the COS Instrument Handbook.
In the far-ultraviolet (λ < 2000 Å) the ACS/SBC is the recommended camera over STIS/FUV-MAMA because it is more sensitive and has a larger number of available filters. For the near-ultraviolet (~2000 Å < λ < 3500 Å), WFC3/UVIS is generally recommended over STIS/NUV-MAMA because of its larger field of view and superior sensitivity. The table below summarizes the imaging options at near-UV wavelengths (200 nm - 350 nm)
WFC3/UVIS | STIS/NUV-MAMA | |
|---|---|---|
FOV area (arcsec2) | 162" x 162" (26,183) | 25" x 25" (625) |
Broad-band throughput @ 230, 330 nm | 0.08, 0.19 | 0.026, 0.002 |
Pixel scale (arcsec) | 0.040 | 0.025 |
Number of pixels | 4k x 4k | 1k x 1k |
Read noise (e-) | 3.1 | None |
Dark current | 7 (e-/pix/hr) | 5.4 (cts/pix/hr) |
Number of filters Number of full-field filters Number of quad filters | 13 10 3 | 9 8 (2 ND) 1 ND |
WFC3/UVIS has the highest throughput among HST imaging instruments in the wavelength range extending from its blue cut-off (at 200 nm) to ~400 nm. Beyond that wavelength range, the choice of which HST instrument is best suited for observations depends on the specific requirements of the science program.
Although the absolute throughput of ACS is higher at optical wavelengths, the excellent WFC3/UVIS efficiency in the range of 400 nm to 700 nm, coupled with its 20% smaller pixels, 25% lower read noise, relatively small CTE corrections, and much lower dark current can make it the preferred instrument in some cases of optical imaging. Alternately, the 50% larger ACS/WFC field of view or the availability of imaging polarizers can be considerations potentially important for users. The optimal choice between the two instruments may require careful predictions from their respective ETCs, factoring in detailed observational setup. The table below summarizes imaging options at optical wavelengths (350 nm - 1000 nm)
WFC3/UVIS | ACS/WFC | |
|---|---|---|
FOV area (arcsec2) | 162" x 162" (26,183) | 202" x 202" (40,804) |
Broad-band throughput1 @ B,V, I, z | 0.23,0.28, 0.16, 0.09 | 0.34,0.41, 0.36, 0.20 |
Pixel scale (arcsec) | 0.040 | 0.049 |
Number of pixels | 4k x 4k | 4k x 4k |
Read noise (e-) | 3.1 | 4 |
Dark current (e-/pix/hr) | 7 | 22 |
Number of filters Number of full-field filters Number of quad filters Number of polarizers | 49 32 17 0 | 27 12 15 6 |
1Average throughput at 10 nm bandpass at the pivot wavelength (B = F438W, V = F606W, I = F814W, z = F850LP).
In the near-infrared (8000 Å < λ < 25,000 Å) the WFC3/IR has superior throughput and a much larger field of view than the now-defunct NICMOS. The data obtained with WFC3/IR should be easier to reduce and calibrate due to accurate bias subtraction made possible by the presence of reference pixels. WFC3/IR is currently the only option to perform near-infrared observations with HST since NICMOS is no longer available. For reference purposes, the table below summarizes imaging options at near-infrared wavelengths (800 nm - 2500 nm)
WFC3/IR | NIC3 | NIC2 | NIC1 | |
|---|---|---|---|---|
FOV area (arcsec2) | 123" x 136" (16,728) | 51" x 51" (2601) | 19" x 19" (361) | 11" x 11" (121) |
Broad-band throughput @ 1.1, 1.6 μm | 0.49, 0.50 | 0.13, 0.20 | 0.14, 0.20 | 0.12, 0.18 |
Wavelength range (μm) | 0.9- 1.7 | 0.8 - 2.5 | 0.8 - 2.5 | 0.8 - 1.8 |
Pixel scale (arcsec) | 0.13 | 0.200 | 0.075 | 0.043 |
Number of pixels | 1014 x 1014 | 256 x 256 | 256 x 256 | 256 x 256 |
Read noise, CDS (e-) | 21 | 29 | 26 | 26 |
Number of filters Number of polarizers | 15 0 | 16 0 | 16 3 | 16 3 |
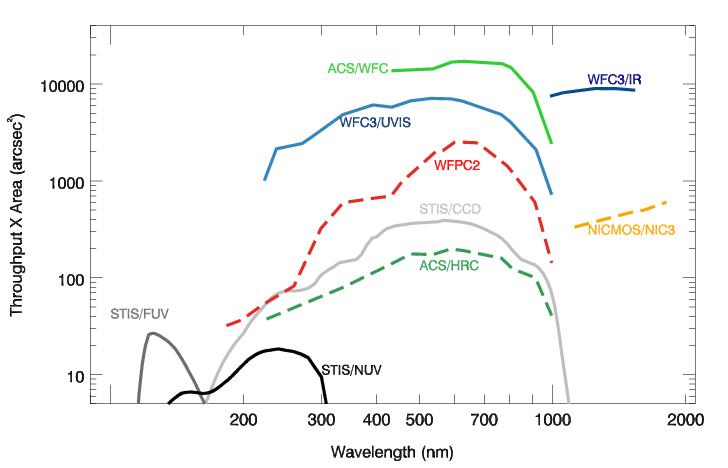
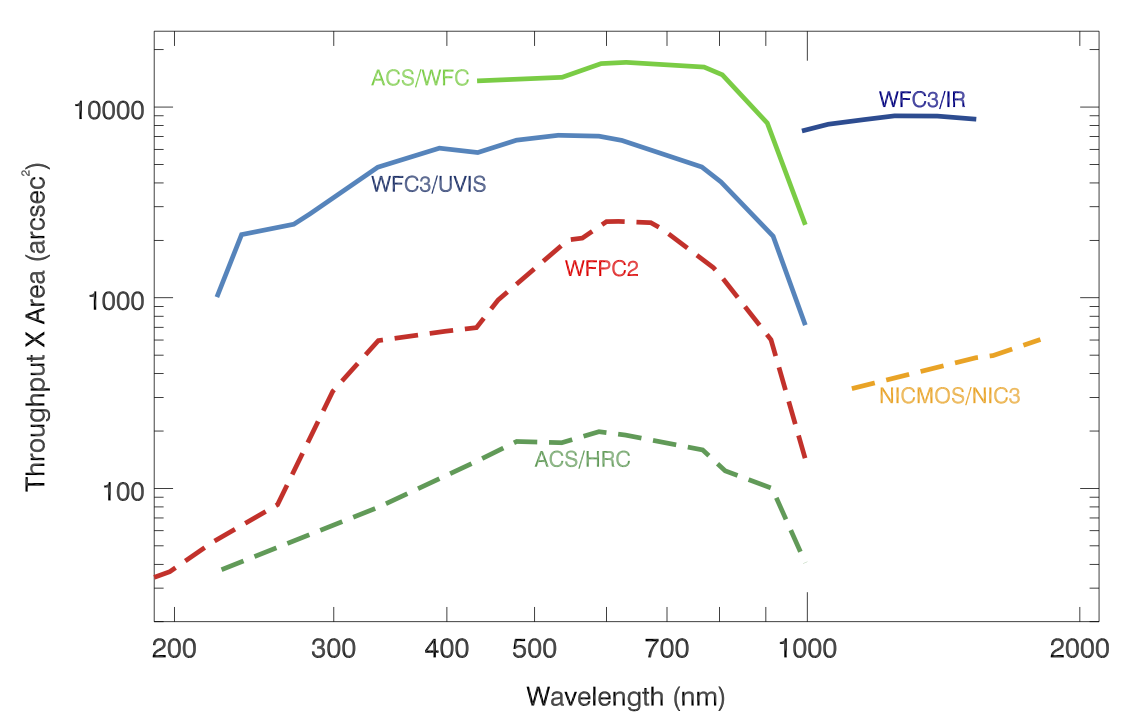
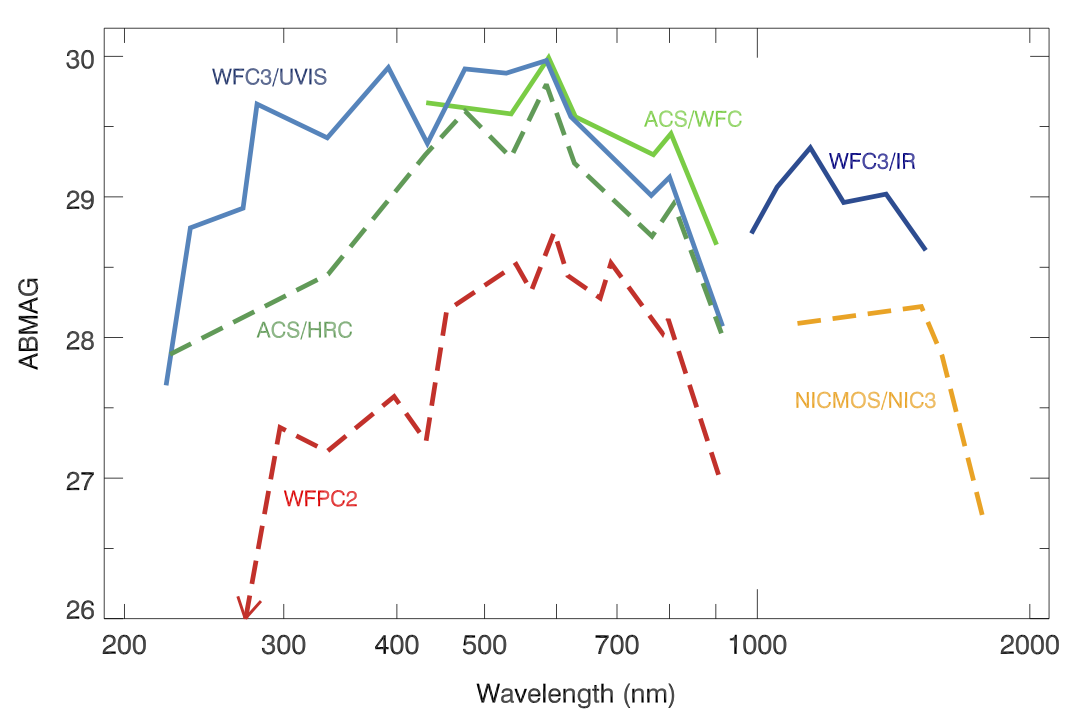
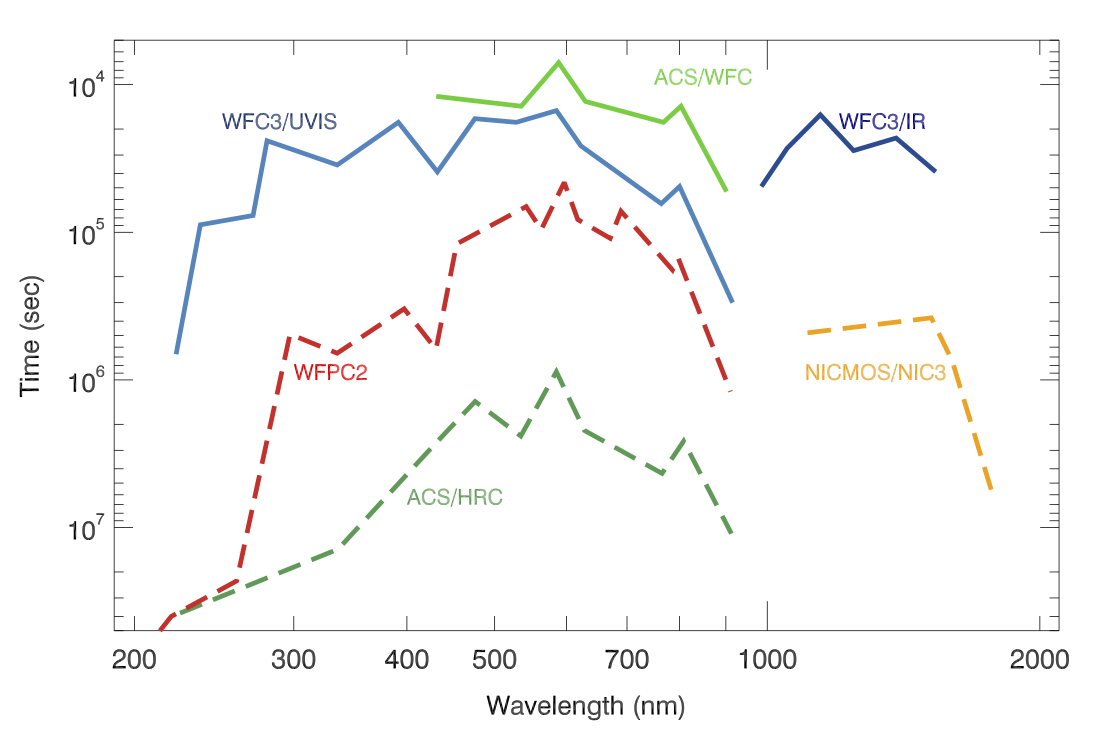
The following four figures present a graphical comparison of the HST imaging detectors with respect to several useful parameters: system throughput, discovery efficiency, limiting magnitude, and extended source survey time.
System throughputs as a function of wavelength are shown below. The plotted quantities are end-to-end throughputs, including filter transmissions calculated at the pivot wavelength of each broadband filter.
Figure 1. HST Total System Throughputs Full lines represent instruments that will be offered this cycle for imaging observations. Dashed lines represent instruments that are not available (HRC, NICMOS) and a previously flown instrument (WFPC2). |
|---|
Discovery efficiencies of the cameras, defined as the system throughput multiplied by the field of view area, are shown below.
Figure 2. HST Survey Discovery Efficiencies Full lines represent instruments that will be offered this cycle for imaging observations. Dashed lines represent instruments that are not available (HRC, NICMOS) and a previously flown instrument (WFPC2). |
|---|
The point source limiting magnitude achieved with a signal-to-noise of 5 in a 10 hour exposure time with optimal extraction is shown below.
Figure 3. Point-Source Limiting Magnitude Full lines represent instruments that will be offered this cycle for imaging observations. Dashed lines represent instruments that are not available (HRC, NICMOS) and a previously flown instrument (WFPC2). |
|---|
The figure below shows the extended source survey time to attain ABMAG = 26 mag in an area of 100 arcmin2.
Figure 4. Extended-Source Survey Time Full lines represent instruments that will be offered this cycle for imaging observations. Dashed lines represent instruments that are not available (HRC, NICMOS) and a previously flown instrument (WFPC2). |
|---|
CTE for ACS/WFC has degraded significantly since it was installed aboard HST in 2002. The charge-trailing caused by poor CTE during ACS/WFC readout can be reduced by positioning a target close to one of the serial registers (e.g.: aperture location 'WFC1-CTE'), or by increasing the image background either naturally (e.g.: longer exposure time; broader filter bandpass) or or artificially (using LED post-flash), although due to the highly non-uniform radial nature of the ACS/WFC post-flash (factor of ~2 from highest in the center to lowest around the FOV edges, unlike the much more uniform WFC3/UVIS post-flash), this is usually not currently recommended with ACS/WFC where photometric comparisons across the FOV and to other earlier observations are the primary goal. It is most useful in ACS/WFC when the scientific goal is merely the initial simple detection of faint sources across the FOV, even if in a very non-uniform manner, and no more. Much effort, both internal and external to the ACS Team, has gone into minimizing the science impact from ACS/WFC charge transfer inefficiency.
The ACS Team has developed a pixel-based CTE correction technique, described by Anderson & Bedin (2010, PASP, 122, 1035), for post-readout deconvolution of charge-trailing. This correction is applicable to ACS/WFC full-frame readouts, to 2K-subarray readouts, and from Cycle 24 onwards, to the smaller subarray readouts. The CALACS pipeline generates both CTE-corrected (FLC/DRC) and CTE-uncorrected (FLT/DRZ) reductions of WFC imagery for full-frame images; for subarray images, the pixel-based CTE correction is available as a stand-alone code in the 'acstools' software suite. Please consult the ACS webpage for the latest details.
Spectrographs
For observations requiring resolutions of R > 15,000, COS is more sensitive than STIS by factors of 10 to 30 in the far-ultraviolet (~1150 Å < l < 2050 Å) and by factors of two to three in the near-ultraviolet (~1700 Å < l < 3200 Å) for some NUV gratings (see COS Instrument Handbook). COS also has a unique but limited capability to observe wavelengths between 900 Å and 1150 Å. However, it does not operate in the optical. Please refer to the COS Instrument Handbook for important factors concerning COS observations in this wavelength range.
COS is optimized for observing faint point source targets, making it the instrument of choice for such objects. COS has an aperture of 2.5" in diameter. COS/FUV spatial resolution is limited to 1", while COS/NUV spatial resolution is approximately 0.06". However, for sources larger than approximately 1" perpendicular to the dispersion direction, portions of the spectrum may overlap on the NUV detector. Therefore, when spatial resolution is required, STIS is usually the preferred instrument. STIS first order NUV and FUV MAMA modes have a spatial resolution of about 0.05" over a 25" long slit, while STIS CCD spectral modes (1900 Å - 10,200 Å) have a spatial resolution of about 0.1" with a 52" long slit.
STIS high dispersion echelle modes have significantly higher spectral resolution than COS (R ~100,000 vs. R ~20,000), which is essential for some science programs. In addition, the STIS/NUV medium-resolution echelle mode, E230M, has a wider wavelength coverage in a single exposure (~800 Å) than does a single COS/NUV medium resolution exposure (100 Å to 120 Å in three discontinuous pieces). Despite the sensitivity advantage of COS in the NUV, when complete coverage of a broad wavelength range is needed, STIS is the more efficient choice. In particular, the sensitivity of the COS/G285M configuration is no longer better than that of STIS configurations of comparable spectral resolution and covering similar wavelength ranges. STIS also has a wider variety of apertures than COS; this includes a number of neutral density apertures that makes STIS the preferred instrument for many UV bright objects. Given the low usage of most COS/NUV modes, it is likely that calibrations for comparable STIS/NUV modes will be more robust. A useful comparison of COS and STIS at ultraviolet wavelengths is given the table below
| COS/FUV | COS/NUV | STIS/FUV | STIS/NUV | ||
|---|---|---|---|---|---|
Spectral coverage (Å) | 900 - 1775 (M) 900 - 2050 (L) | 1700 - 3200 (M) 1650 - 3200 (L) | 1150 - 1700 (M, L) --- | 1650–3100 (M) 1570–3180 (L) | |
Effective area (cm2) 950 Å (FUV) 1300 Å (FUV) 2500 Å (NUV) | 20 (G130M) 3000 (M) 1800 (L) | --- 600 (M) 750 (L) | --- 400 (M) 1700 (L) | --- 350 (M) 900 (L) | |
Resolving power R = λ/dλ | H M M (λ < 1150) L | --- 16,000 - 17,000 13,000 & 1000 - 3000 1500 - 4000 | --- 16,000 - 24,000 --- 2100 - 3200 | 114,000 11,500 - 45,800 --- 1000 | 114,000 9100 - 30,000 --- 500 - 1005 |
Number of pixels along dispersion | 16,3841(32,768)1 | 1024 | 1024 (2048) | 1024 (2048) | |
Background 2 (counts/sec/resel) | 1.00 x 10⁻⁴ (FUVA) 9.54 x 10⁻⁵ (FUVB) | 7.89 x 10⁻³ | 1.5 x 10⁻³ | 9.0x10⁻³ | |
Background Equivalent Flux (ergs/cm2/sec/Å) | 7.6 x 10⁻¹⁷ G130M at 1264 Å | 4.8 x 10⁻¹⁵ G225M at 2160 Å | 9.0 x 10⁻¹⁵ E140M at 1297.5 Å | 8.0 x10⁻¹⁵ E230M at 2581 Å | |
1The first number is number of pixels along the dispersion per segment; the second number is for both segments
2One resel is considered 6x10 pixels for COS/FUV, 3x3 pixels for COS/NUV, 2x5 pixels for STIS/FUV, and 2x3 pixels for STIS/NUV.
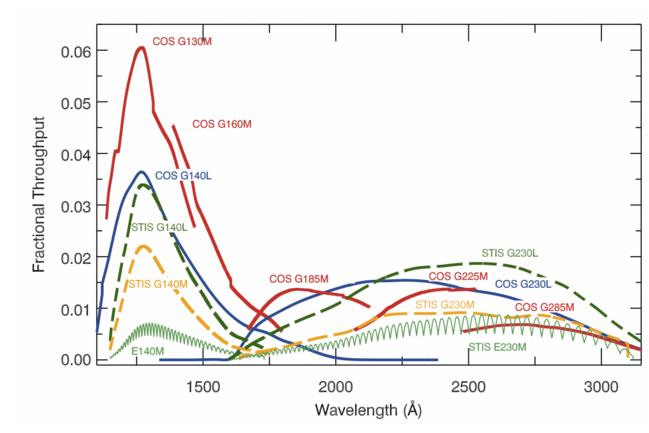
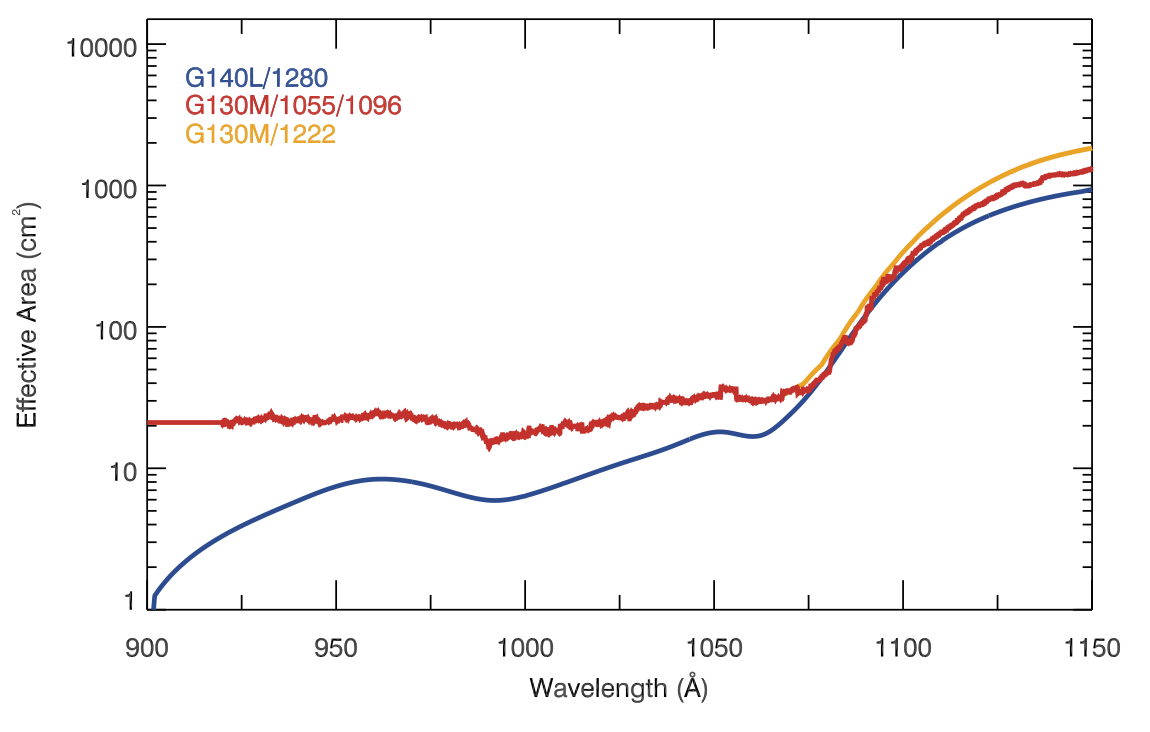
The throughputs of COS and STIS in the ultraviolet, including the effect of the HST OTA, are shown below. STIS throughputs do not include slit losses. The effective area of COS modes below 1150 Å is also shown below. This figure has not been updated for recent throughput changes. For an optimal evaluation of the choice of COS vs STIS, the exposure time calculators (ETCs) should be used.
Figure 5. Throughputs for COS and STIS in the FUV and NUV. |
|---|
Figure 6. Effective Area for COS Below 1150 Å A comparison of the effective area of the G130M modes (red) with that of G140L (blue). The G130M effective area below 920 Å is not well characterized, so the value at 920 Å is used to extrapolate to shorter wavelengths. For comparison, the G130M/1222 cenwave is also shown. |
|---|
For the latest UVIS and IR throughputs, please refer to the WFC3 pages and reports therein.
An additional comparison of COS and STIS may be found in the COS Instrument Handbook, sec. 2.11.
Next: HST Primer: Observing Considerations
References
WFC3 ISR 2009-30: Kalirai, J. S., et al. 2009, "WFC3 SMOV Proposal 11451: The Photometric Performance and Calibration of WFC3/IR"
WFC3 ISR 2011-11: Pirzkal, N., Mack, J., Dahlen, T., and Sabbi, E. 2011, "Sky Flats: Generating Improved WFC3 IR Flat-fields"
WFC3 ISR 2009-31: Kalirai, J. S., et al. 2009, "WFC3 SMOV Proposal 11450: The Photometric Performance and Calibration of WFC3/UVIS"
WFC3 ISR 2010-14: Kalirai, J. S., Baggett, S., Borders, T., and Rajan, A. 2010, "The Photometric Performance of WFC3/UVIS: Temporal Stability Through Year 1"
