2.4 The FGS Interferometric Response
FGS interferometry relates the wavefront tilt to the normalized difference of intensity between the two beams emerging from the Koesters prism (see Figure 2.3). As the tilt varies over small angles (as when the IFOV scans the target), this normalized intensity difference defines the interferogram, or “S-Curve”, given by the relation,
Sx = (Ax – Bx) / (Ax + Bx),
where Ax and Bx are the photon counts from PMTXA and PMTXB respectively, accumulated over 25 milliseconds intervals when the IFOV is at location x. The Y-axis S-Curve is defined in an analogous manner. Figure 1.1, FGS Interferometric Response (the “S-Curve”) shows an S-Curve resulting from several co-added scans of a point source.
Because the FGS is a white light, broad bandpass interferometer, its S-Curve is essentially a single fringe interferogram. The spectral incoherence of white light causes the higher order fringes to be strongly damped. Because the S-Curve is a normalized function, its amplitude is not sensitive to the target’s magnitude provided the background and dark contributions to the input beam are relatively small. However, as fainter targets are observed (i.e., V ≥145), the S-Curve’s amplitude will be reduced (background and dark counts contributions are not coherent with light from the target). Usually the effect of dark + background is easily calibrated and therefore does not compromise the instrument’s scientific performance in either Position or Transfer mode. In a similar fashion the PMT deadtimes, if not accounted for, will reduce the amplitude of the observed fringes for stars brighter than V=~9 when observed with the F583W element. This effect is easily removed during calibration.
2.4.1 The Ideal S-Curve
The intensity of each beam exiting the Koesters prism is the integral of the intensity of each ray along the entire half-face of the prism. When the IFOV is more than 100 milliarcseconds (mas) from the location of the interferometric null, the PMTs of a given channel record nearly equal intensities since the re-combining beams are essentially incoherent over such large optical path differences (the photons constructively and destructively interfere at approximately the same rate). Closer to the interferometric null (at about +/- 40 mas from the null), a signal emerges as the Koesters prism produces exit beams of different relative intensities.
Maximum fringe visibility of the ideal S-Curve min/max extremes is 0.7, occurring at about –20 and +20 mas for the positive and negative fringe maxima, respectively. Thus the “peak-to-peak” amplitude is 1.4. An ideal S-curve is inverse symmetric about the central “zero point crossing”. This crossing occurs when the wavefront’s propagation vector is normal to the Koesters prism entrance face, a condition referred to as interferometric null (jargon derived from guide star tracking or Position mode observing for when a star’s fine error signal has been nulled out).
2.4.2 Actual S-Curves
HST’s Spherical Aberration
The characteristics of real S-Curves depend on several factors: the quality and fabrication of the internal optics, the relative sensitivity of the PMTs, the alignment of the internal optics, the filter in use, the color of the target, and the effect of the spherically aberrated HST primary mirror. Some of the effects can be removed during processing and calibration, while others limit the performance of the instrument.
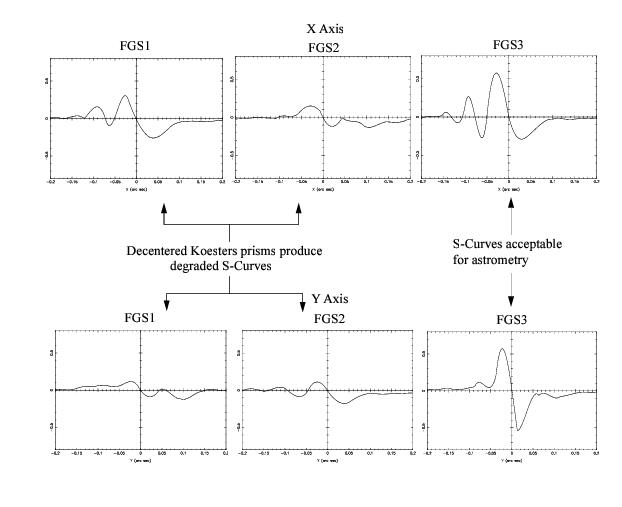
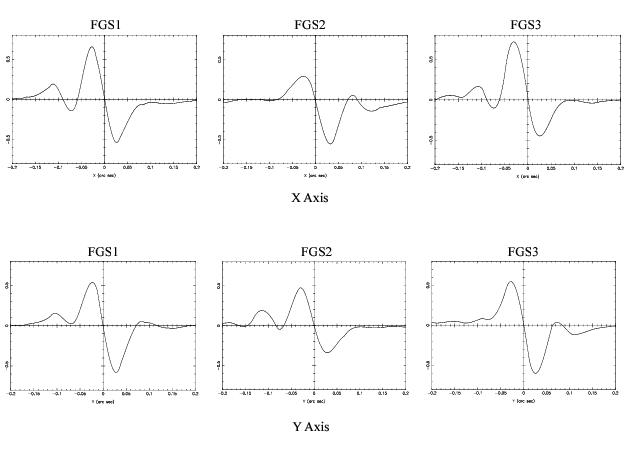
Referring back to Figure 2.3, if the tilt axis is of the incident beam is not at point ‘b,’ the beam is said to be with respect to the Koesters prism. Given the presence of spherical aberration from the HST’s misfigured primary mirror, the wavefront presented to the Koesters prism is not flat but has curvature. This greatly amplifies the effects of misalignments in the FGS optical train. A decentered spherically aberrated beam introduces a phase error between the re-combining transmitted and reflected beams, resulting in degraded S-Curve characteristics. The interferometric response (in filter F583W) of the 3 original FGSs are shown in Figure 2.4. Decenter emerges as morphological deformations and reduced modulation of the fringes. Of the original three FGSs, FGS3 was the only instrument with sufficient fringe visibility to perform as an astrometric science instrument.
Field Dependence and Temporal Stability of the S-Curves
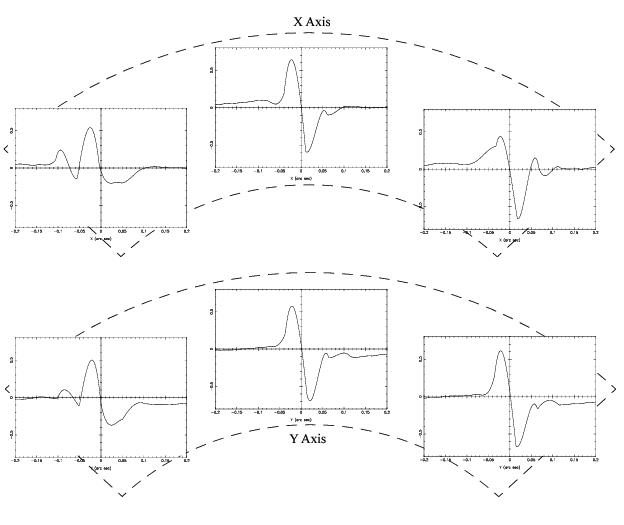
The Star Selectors center the beam on the face of the Koesters prisms while varying the tilt of the wavefront. Errors in the alignment of either the SSA or SSB with respect to the Koesters prisms will decenter the beam on the face of the prisms. Since the servos rotate over large sky angles to bring the IFOV to different positions in the Field of View, misalignments of these elements result in field-dependent S-curves. For this reason, Transfer mode observations should be restricted to the center of the FGS FOV, the only location supported by observatory calibrations.
The S-Curve measurements in the original three FGSs indicated large decenters of the Koesters prisms in FGS1 and FGS2 and field dependency in FGS3. FGS1r also shows field dependence, as can be seen for three positions across the FGS1r FOV in Figure 2.6 (however, note that its x,y fringes are near ideal at the FOV center).
Temporal stability of S-Curves is also a concern. Monitoring of the FGS3 S-Curves along the X-axis showed the instrument suffered from variability of such amplitude that it could not be used to reliably resolve binary systems with projected X-axis separations less than ~ 20 mas. Conversely, FGS1r is far more stable. Its interferometric fringes show much less temporal variation, allowing the observer to confidently distinguish the difference between a point-source and a binary star system with a separation of 8 mas. This, in part, prompted the switch to FGS1r as the Astrometer for Cycle 8 and beyond.


