1.2 COS Physical Configuration
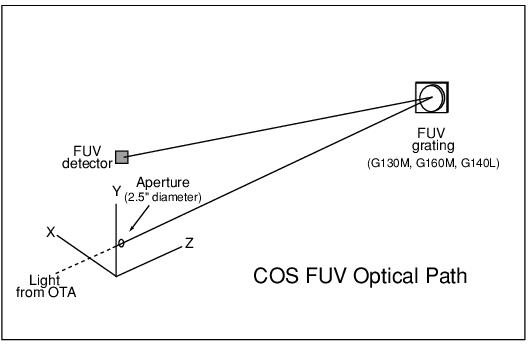
External light enters the aperture mechanism through either the PSA or the BOA and illuminates OSM1, which contains the three FUV gratings and a mirror. Each grating can be set to one of several positions, to obtain different wavelength ranges. The positioning of the OSM1 mechanism is not precisely repeatable, and this can cause small, but significant, variations in how the spectrum or image is projected onto the detector. This non-repeatability can be corrected in post-observation data processing using separate or concurrent (TAGFLASH) calibration lamp exposures (wavecals). The COS FUV channel optical path is illustrated in Figure 1.4.
TIME-TAG science exposures in order to produce concurrent wavelength calibrations (TAGFLASH mode).1.2.1 The COS Detectors
COS uses two detectors, an FUV XDL and an NUV MAMA. Table 1.4 gives an overview of their characteristics.
Table 1.4: COS Detector Characteristics.
Detector Characteristic | FUV XDL | NUV MAMA |
|---|---|---|
Photocathode | CsI (opaque) | Cs2Te (semi-transparent) |
Window | None | MgF2 (re-entrant) |
Wavelength range | <900–2150 Å | 1650–3200 Å |
Active area | 85 × 10 mm1 | 25.6 × 25.6 mm |
Pixel format (full detector) | 16384 × 10241 | 1024 × 1024 |
Image size recorded per spectrum | 1024 × 1024 | |
Pixel size | 6 × 24 μm | 25 × 25 μm |
Spectral resolution element size (= "resel") | 6 × 10 pix2 | 3 × 3 pix |
Plate scale: Along dispersion (per resel) | 0.13 arcsec | 0.075 arcsec |
Plate scale: Cross dispersion (per resel) | 0.92 arcsec | 0.075 arcsec |
Plate scale: Imaging (per resel) | N/A | 0.075 arcsec |
Quantum efficiency | ~26% at 1335 Å | ~10% at 2200 Å |
Typical Dark count rate (away from SAA)3 | 1.13 cnt s–1 cm–2 | 140 cnt s–1 cm–2 |
1 Sizes given are for an individual FUV segment.
2 For most modes.
3 NUV dark rate is time dependent. NUV and FUV dark rates are for 2017. For updated information on NUV and FUV dark rates please see the COS performance monitoring pages.
FUV Channel
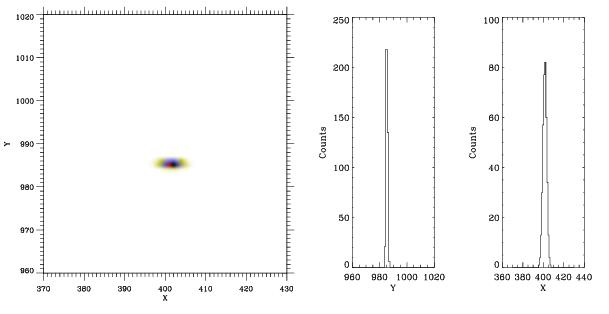
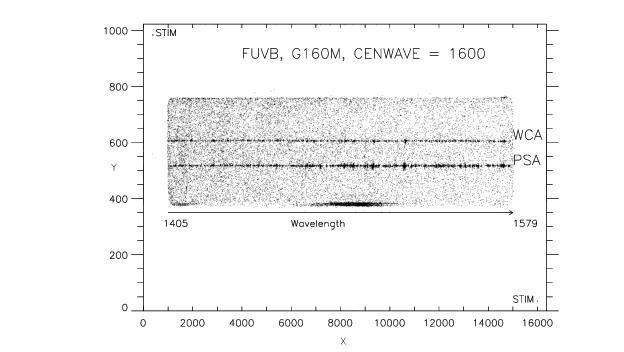
The FUV channel uses a large-format, windowless solar-blind cross delay line (XDL) detector. This is a two-segment photon-counting detector with microchannel plates feeding an XDL anode. The data are digitized to a 16384 × 1024 pixel format for each segment; however the active area is only 14191 × 439 for Segment A (FUVA) and 14374 × 426 for Segment B (FUVB). Because there are no physical pixels, fiducial electronic pulses are recorded at specific times throughout an observation to permit alignment of data to a standard reference frame. These electronic pulses are referred to as "stim pulses." Figure 1.6 schematically shows the COS FUV XDL segments with the locations of the active areas and stim pulses. The stim pulses emulate counts located near the edges of the anode, beyond the illuminated portions of the detector. A zoomed-in image of one of the FUV stim pulses on Segment B is shown in Figure 1.7. An example of an FUV external science spectrum taken with Segment B is shown in Figure 1.8, with a simultaneous wavelength calibration spectrum.
TIME-TAG data this pulse height amplitude (PHA) is sent to the ground along with the position of the event and can be used during data analysis to help identify non-photon events, see Figure 1.9. For FUV XDL ACCUM mode data, only an integrated pulse height distribution (a histogram of the PHA data) for the entire segment is available.A photon landing on an FUV detector segment creates an event (a cascade of electrons) at the backside of the detector which is characterized by a PHA that is detected by the electronics. The detector electronics distinguishes between real and background noise events by the value of the PHA, with background events having low PHAs and real events large PHAs. However, as a region of the detector is exposed to more and more light, the PHAs that it produces become smaller, an effect called "gain sag." Gain sag can cause two effects: the mis-registration of event positions and localized sensitivity loss.
Mis-registration of event positions as a function of PHA is termed "walk." Walk has been identified in both the dispersion (X) and cross-dispersion (Y) directions. A walk correction is made by the COS calibration pipeline for TIME-TAG data (see Section 3.4.5).
Localized sensitivity loss occurs when the PHAs for some pixels become too small to be distinguished from background events, causing events to be missed or filtered out. This results in a localized region of low sensitivity. Eventually, the gain of all of the pixels in a region becomes so small that photons landing on that location no longer create events with valid PHAs, see Figure 1.9. In that case, no events are registered and the region is termed a "dead spot." When this occurs, it is necessary to either increase the high voltage applied to the detector (which increases the PHAs of all the pixels), or to move the aperture so that the science spectra land on a different portion of the detector (which has not been exposed to as much light). The COS FUV detectors have already experienced localized gain sag on regions of the FUVB and FUVA detectors exposed to the bright Ly-α airglow line when the G130M and G140L are used respectively. As a result, the detector high voltage has been raised on several occasions (see Appendix B.1). Furthermore, the default location for the science spectra and target acquisitions is periodically moved to an unsagged region of the detector. For more information on lifetime positions consult Appendix A.1.
NUV Channel
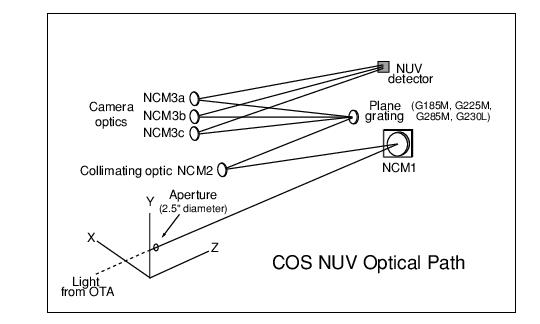
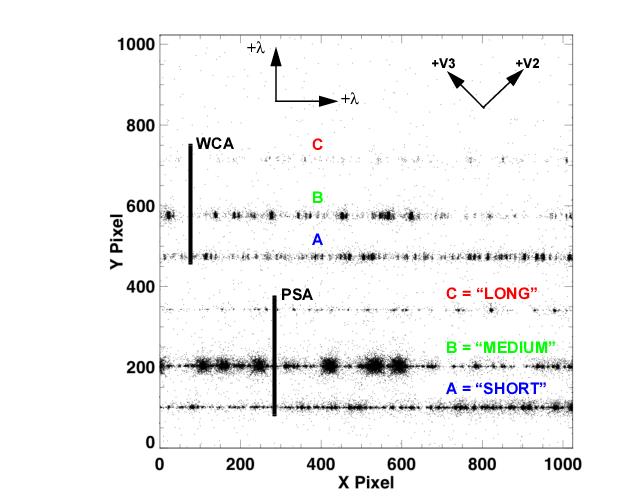
The NUV channel uses a 1024 × 1024 pixel Multi-Anode Micro-channel Array (MAMA) detector. This detector has a semi-transparent cesium telluride photocathode on a magnesium fluoride window, which allows detection of photons with wavelengths from ~1150 to ~3200 Å. The NUV MAMA provides no pulse-height information, but may be used in both ACCUM and TIME-TAG mode. The NUV channel creates three spectrum stripes on the MAMA detector, resulting in three separate stripes for the science data and three for wavelength calibration data as shown in Figure 1.10.
