3.3 Calcos--Structure and Data Flow
The calcos pipeline is comprised of three main components that provide calibration of the COS data. This structure incorporates modules that:
- correct the data for instrument effects (e.g., noise, thermal drifts, geometric distortions, pixel-to-pixel variations in sensitivity),
- generate an exposure-specific wavelength-calibrated scale, and
- extract and produce the final (one-dimensional) flux-calibrated (summed) spectrum for the entire observation.
Both COS FUV and NUV TIME-TAG event lists and ACCUM images are fully calibrated by calcos. Target acquisition exposures are not calibrated by calcos, except for ACQ/IMAGE, although the raw data from these acquisitions are available through the data archive.
As with HST calibration pipelines for other instruments, the choice of which operations are performed during calibration is controlled by calibration switches, which are stored in the primary FITS header. DP sets the switches that are appropriate for a given data type to PERFORM for steps to be carried out by calcos, and then calcos changes them to COMPLETE or SKIPPED in the calibrated files. When DP creates the raw data files, it also populates the headers with the names of the appropriate reference files for each calibration operation. Any calibration step may require zero, one, or more calibration reference files. Exactly how the data are processed depends on whether they are FUV TIME-TAG or ACCUM spectra, NUV TIME-TAG or ACCUM spectra, or NUV images. The names of the keywords containing the switches and reference file names were introduced in Table 2.16, Table 2.17, and Table 2.18, and their roles in the data reduction and the calibration steps are described in the following sections.
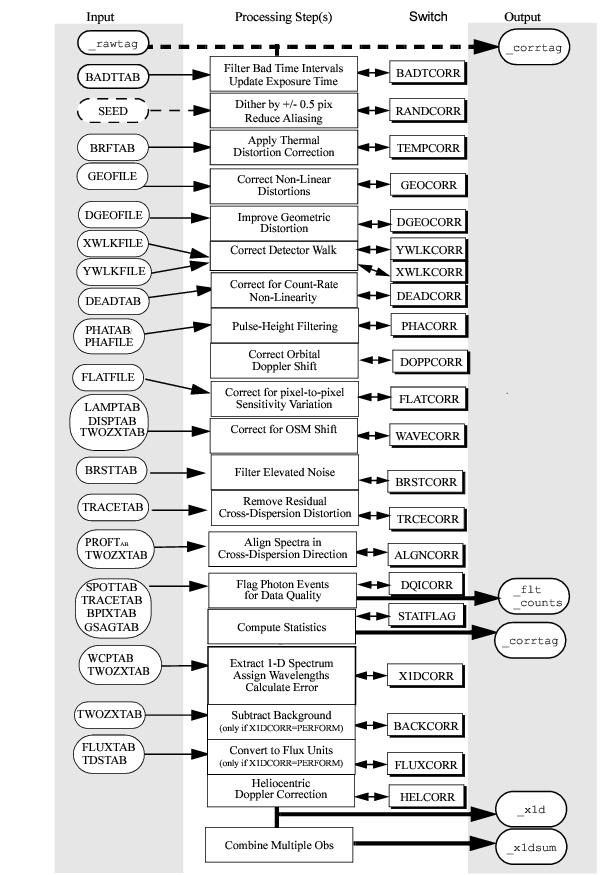
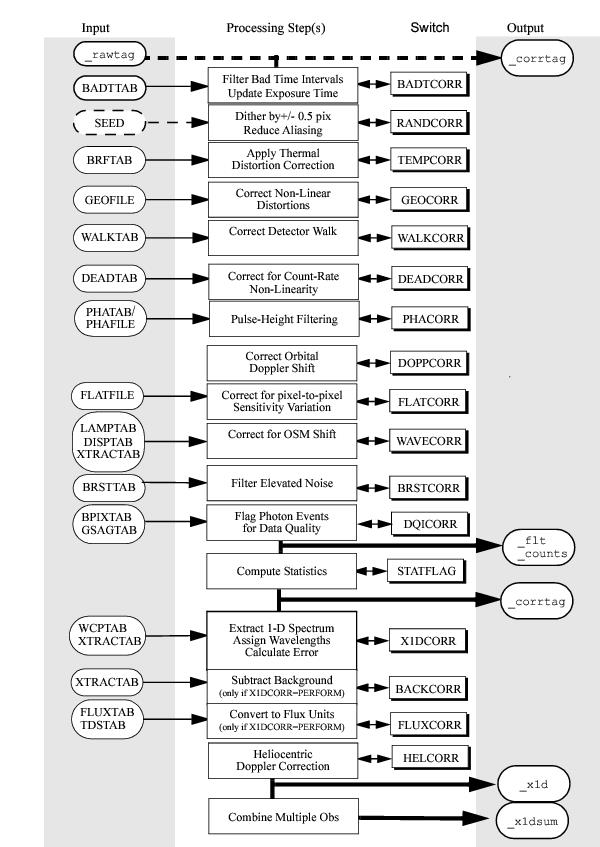
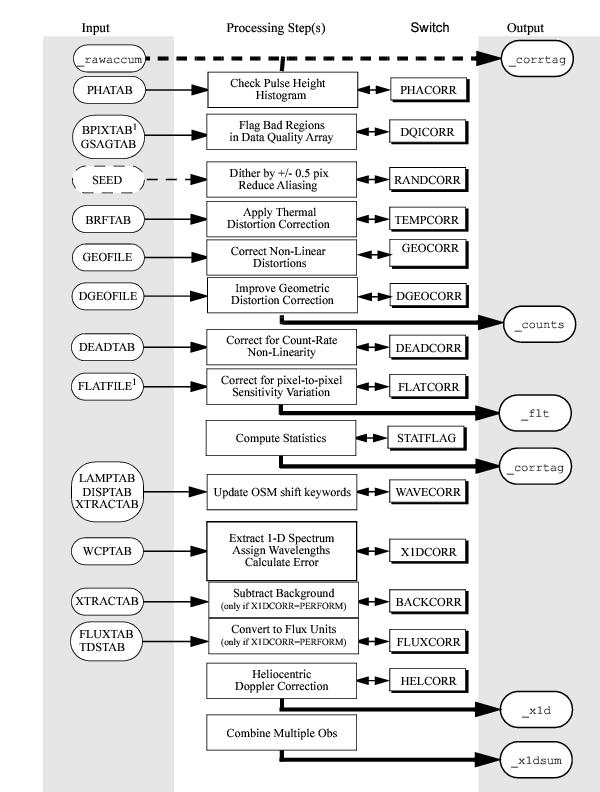
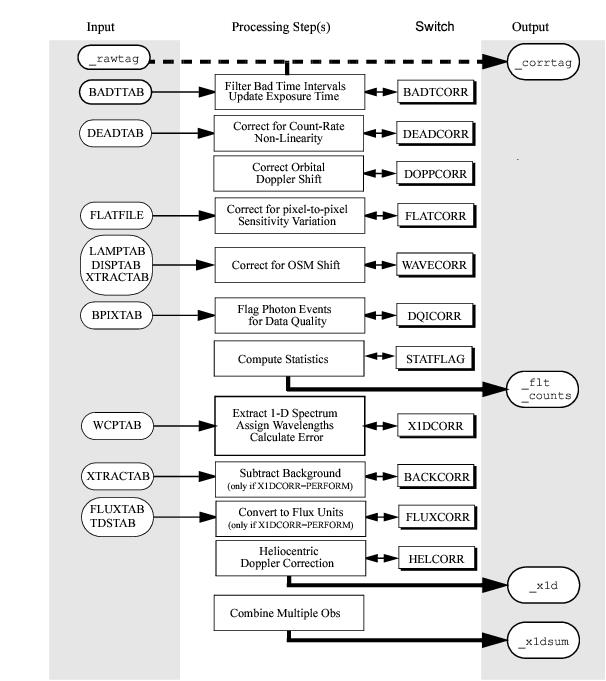
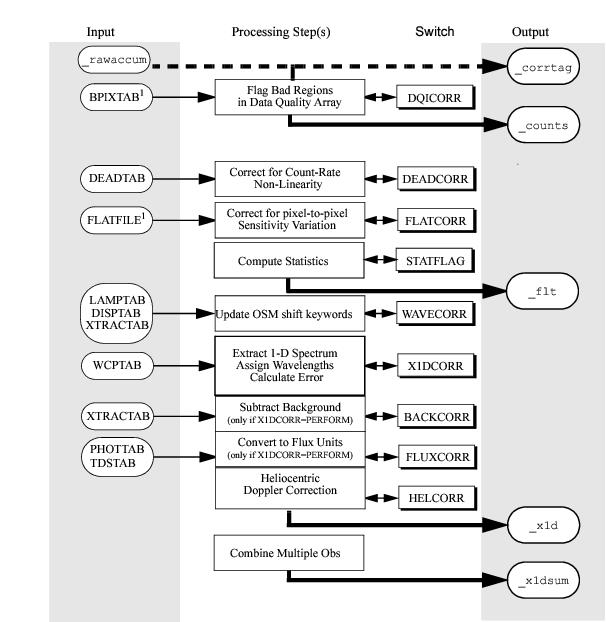
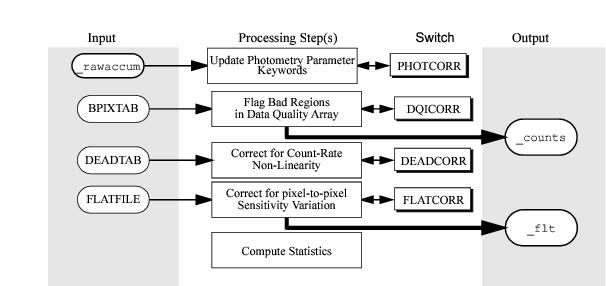
Figure 3.1–Figure 3.6 show how a single raw file moves through the pipeline for FUV TIME-TAG (TWOZONE), FUV TIME-TAG (BOXCAR), FUV ACCUM, NUV TIME-TAG and NUV ACCUM spectroscopic data, and for NUV images. Each figure shows, from left to right, the input files, the processing steps performed by each module, and the output files. Note that in some instances, output files are created and then subsequently modified. In these cases, the file is shown at the end of a dashed arrow at the point it is created and again by a solid arrow at the point where it is finalized. Steps that apply only when spectra are extracted are marked with an * in Figure 3.1 through Figure 3.5. FUV data taken after February 9, 2015 will use the TWOZONE extraction by default, except for the blue modes G130M/1055 and 1096. Users can also confirm which extraction algorithm was used to generate a given FUV data file using the XTRCTALG keyword, which will be set to either BOXCAR or TWOZONE.
For ACCUM data, Doppler corrections are done onboard. Consequently, for these spectra certain reference files are transformed to the coordinate system of the data, rather than the other way around. We note in Figure 3.3 and Figure 3.5 when this is done.
TIME-TAG Spectroscopic Pipeline Flow Chart (TWOZONE).
TIME-TAG Spectroscopic Pipeline Flow Chart (BOXCAR).
ACCUM Spectroscopic Pipeline Flow Chart.
TIME-TAG Spectroscopic Pipeline Flow Chart.
ACCUM Spectroscopic Pipeline Flow Chart.
