2.3 STIS File Structures
All STIS data products are FITS files. Images and two-dimensional spectroscopic data are stored in FITS image extension files, which can be directly manipulated, without conversion, in the stenv environment. These FITS image extension files allow an associated set of STIS science exposures, processed through calibration as a single unit, to be packaged into a single file. The fits.info function in astropy.io.fits can be used to list the complete set of the primary and extension headers of the data files.
Tabular STIS information, such as extracted one-dimensional spectra or the TIME-TAG mode event series, are stored as FITS binary tables with three extensions, as explained below.
2.3.1 STIS FITS Image Extension Files
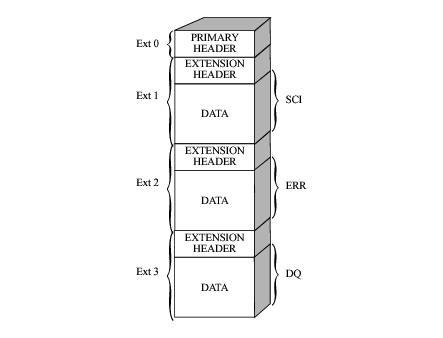
Figure 2.1 illustrates the structure of a STIS FITS image extension file, which contains:
- A primary header that stores keyword information describing the global properties of all of the exposures in the file (e.g., the target name, target coordinates, total summed exposure time of all exposures in the file, optical element, aperture, detector, calibration switches, reference files used).
- A series of image extensions, each containing header keywords with information specific to the given exposure (e.g., exposure time, world coordinate system) and a data array.
- The first, of extension type SCI, stores the science values.
- The second, of extension type ERR, contains the statistical errors, which are propagated through the calibration process. It is unpopulated in raw data files.
- The third, of extension type DQ, stores the data quality values, which flag suspect pixels in the corresponding SCI data. It is unpopulated in raw data files.
The error arrays and data quality values are described in more detail in Section 2.5. Each of these extensions can contain one of several different data types, including images, binary tables and ASCII text tables. The value of the XTENSION keyword in the extension’s header identifies the type of data the extension contains; the value of this keyword may be determined using the fits.info function in astropy.io.fits.
Acquisition Images: Almost all STIS spectroscopic science exposures will have been preceded by an acquisition (and possibly an acquisition/peakup) exposure to place the target in the slit. Keywords in the header of spectroscopic data identify the dataset name of the acquisition (in the ACQNAME keyword).
An acquisition exposure produces a raw data file (rootname_raw.fits) containing three science image extension corresponding to the three stages of the acquisition procedure:
- [SCI,1] is a subarray image (100 × 100 pixels) for point source acquisitions; larger for diffuse acquisitions) of the target area obtained after the initial blind pointing.
- [SCI,2] is a sub-array image of the same size after the coarse centering phase of the acquisition.
- [SCI,3] is a sub-array image (32 × 32 pixels) of the lamp viewed through the 0.2X0.2 aperture (to identify the location of the aperture on the detector).
Acquisition/Peakup Images: An acquisition/peakup exposure will produce a single raw data file for a spiral search peakup, and one for each linear search peakup; that is, if you have performed a peakup that requires SEARCH=LINEARAXIS1 and SEARCH=LINEARAXIS2 scans, then two datasets will be produced: one for each scan. Keywords ACQPEAK1 and ACQPEAK2 in the header of STIS data identify the dataset name of the acquisition/peakup images. The _raw data file produced for an ACQ/PEAK exposure contains one science image extension:
- [SCI,1] is the confirmation image of the target, taken at the end of the peakup, after the final move which places the target in the slit.
To examine the flux values of the individual steps in the ACQ/PEAK, relative to the lowest flux, which has been set to 0, list the entries of the fourth extension, i.e., rootname_raw.fits[4]. Extensions [2] and [3] are the unpopulated ERR and DQ arrays that accompany extension [1].
Direct and Spectral Imaging Data: The intermediate calibrated output product for CCD direct and spectral imaging data is the _flt or _crj file, and the intermediate calibrated product for MAMA data is the _flt or _sfl file, depending on whether the file contains single or multiple imsets (see Table 2.2). The units of the data in these files are counts per pixel. The conversion of the counts to flux (or magnitude) is explained in Section 5.3.1.
The _x2d and _sx2 files hold the geometric distortion corrected imaging data or the flux and wavelength calibrated two-dimensional spectra for long slit first order observations. These are stored as FITS images, as are the raw and calibrated imaging data. The units of the data in the direct images and two dimensional spectra are counts sec-1 and ergs sec-1 cm-2 Å-1 arcsec-2, respectively. The procedure to derive flux information from these data is described in Section 5.3.1 and Section 5.4.1, respectively. Discussion of the one-dimensional extracted spectra is presented in Section 2.3.2 and Section 5.5.
2.3.2 STIS FITS Table Extension Files
All the TIME-TAG and one-dimensional STIS spectra are stored in binary tables, as described below.
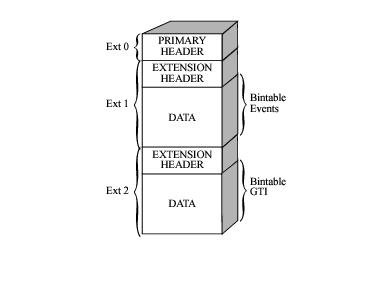
Time-Tag: TIME-TAG mode is used for high time resolution spectroscopy and imaging in the UV (with the MAMA detectors only). TIME-TAG event data (rootname_tag.fits) are contained in a binary table extension. Figure 2.2 shows the format of TIME-TAG tables. The first extension contains the events table, in which each row of the table corresponds to a single event in the data stream and the columns of the table contain scalar quantities that describe the event, as shown in Table 2.4. The second extension contains the good time intervals (GTIs) information, where an uninterrupted period of time is considered as one good time interval. Interruptions in the data taking due to memory overflow or corrupted fine times could result in more than one GTI (see STIS ISR 2000-02).
| Extension 1 | ||
|---|---|---|
| Column Name | Units | Description |
TIME | sec | Elapsed time in seconds since the exposure start time |
AXIS1 | pixel | Pixel coordinate along the spectral axis, |
AXIS2 | pixel | Pixel coordinate along the spatial axis, |
DETAXIS1 | pixel | Pixel coordinate along the spectral axis, |
Extension 2 | ||
Column Name | Units | Description |
START | sec | Start good time interval |
STOP | sec | End good time interval |
The STIS pipeline collapses a TIME-TAG event series into a single time-integrated image and processes it as if it were an ACCUM mode image. Outside of the pipeline the raw TIME-TAG event stream can be manipulated to produce two-dimensional images which are integrated over user-specified times or manipulated directly (see Section 5.6).
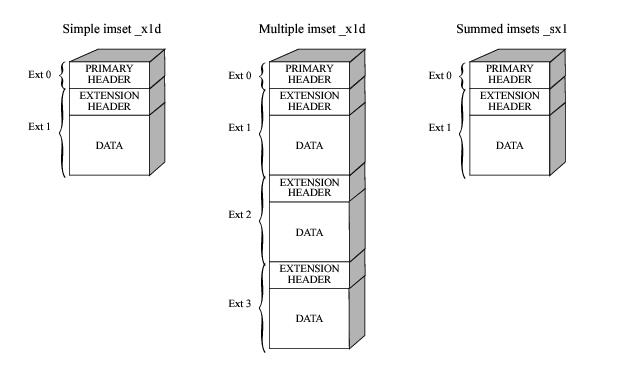
One-Dimensional Extracted Spectra: The STIS pipeline produces aperture extracted one-dimensional spectra and stores them in binary tables (rootname_x1d.fits or rootname_sx1.fits). Figure 2.3 shows the format of the 1-D extracted spectra table. For a single first order spectroscopic observation, the calibrated spectrum is stored in the first row of the first extension of the _x1d file. Each column of the table contains a particular quantity, such as WAVELENGTH or FLUX. Table 2.5 shows the contents of the different columns in a STIS extracted spectrum table. Each table cell can contain either a scalar value or an array of values. The SPORDER column value is equal to 1 for first order spectral data. There will be a separate table extension for each associated exposure in an associated set. For example, if you specified Number_of_Iterations=2 in your Phase II proposal, you will find the extracted spectrum from the second exposure in the second table extension. The _sx2 file, on the other hand, contains one single spectra that is derived from the flat-fielded, co-added, individual repeat observations file rootname_sfl.fits.
For echelle data, each spectral order is extracted from the image and a fully calibrated spectrum of that order is stored in a separate row of the binary table in the first extension of the FITS file. The number of orders (and ultimately the number of rows in the table) in the SPORDER column in this case will be anywhere between 24 and 70 depending on the echelle grating being used.
For more information on how to handle STIS BINTABLE files please refer to the Introduction to the HST Data Handbooks.
Table 2.5: Columns of a STIS Extracted Spectrum Table
Column Name | Contents | Units | Description |
|---|---|---|---|
SPORDER | scalar | Spectral order number | |
NELEM | scalar | Number of valid elements in each array | |
WAVELENGTH | array | Å | Wavelengths corresponding to fluxes |
GROSS | array | counts s-1 | Extracted spectrum before subtracting BACKGROUND |
BACKGROUND | array | counts s-1 | Background that was subtracted to obtain NET |
NET | array | counts s-1 | Difference of GROSS and BACKGROUND arrays |
FLUX | array | erg s-1 cm-2 Å-1 | Flux calibrated NET spectrum |
ERROR | array | erg s-1 cm-2 Å-1 | Internal error estimate |
DQ | array | Data quality flags | |
A2CENTER | scalar | pixel | Nominal spectrum location |
EXTRSIZE | scalar | pixel | Extraction box size |
MAXSRCH | scalar | pixel | Maximum search box for spectrum |
BK1SIZE | scalar | pixel | Size of background box 1 |
BK2SIZE | scalar | pixel | Size of background box 2 |
BK1OFFST | scalar | pixel | Offset location of background box 1 from A2CENTER |
BK2OFFST | scalar | pixel | Offset location of background box 2 from A2CENTER |
EXTRLOCY | array | pixel | Extraction location from _flt, _sfl, or _crj file |
OFFSET | scalar | pixel | Offset from nominal A2CENTER |


