3.2 Structure of calstis
Calstis consists of a series of individual modules that:
- Orchestrate the flow of data through the pipeline.
- Perform the preliminary tasks of basic two-dimensional image reduction (e.g., overscan subtraction, bias subtraction).
- Reject cosmic rays from CCD data.
- Perform the remaining tasks of basic two-dimensional image reduction (e.g., dark subtraction, flat fielding).
- Process the contemporaneously obtained wavecal data to obtain the zero point shifts in the spectral and spatial directions.
- Perform spectroscopic wavelength and flux calibration.
- Sum any REPEATOBS exposures.
Table 3.1 describes in more detail the individual modules in calstis and what they do. The stistools task that can be used to run particular segments of the pipeline independently is also provided (see Section 3.5.2).
Table 3.1
| stistools task | Description of Processing Modules | Module1 |
|---|---|---|
Full Pipeline | ||
calstis | “Wrapper” program calls each of the calstis tasks as needed, according to the switches set in the primary header of the input file. The calstis constituent tasks can instead be executed independently when recalibrating. | calstis0 |
Initial 2-D Image Reduction | ||
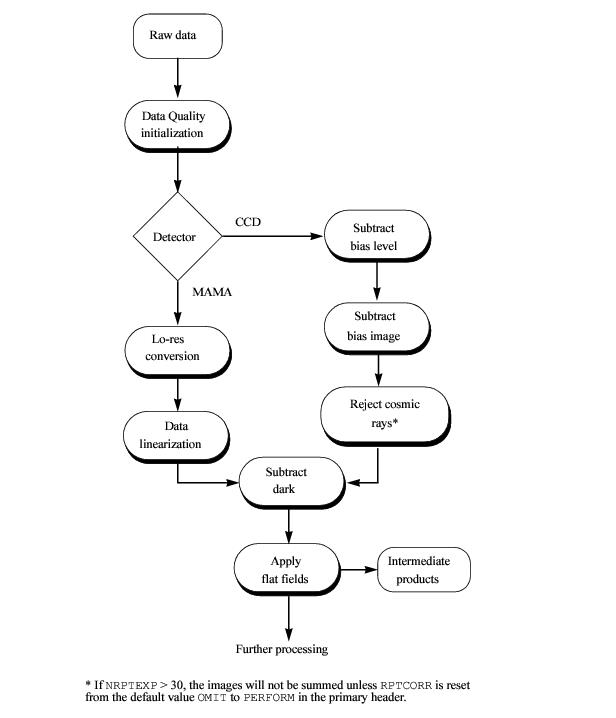
basic2d | Fundamental steps of 2-D image reduction. This module is called to initialize the data quality array from the bad pixel table; to trim the overscan regions, subtract the bias level, and subtract the bias image (before cosmic ray rejection) for CCD data; then to subtract the dark image and perform flat fielding (after cosmic ray rejection for the CCD data). It assigns values to the error arrays and computes some simple statistics. | calstis1 |
ocrreject | Detect and remove cosmic rays in CCD data. This module identifies cosmic rays (by optionally flagging them in the input file) for multiple images taken at the same pointing. The input images are then cleaned and co-added, resulting in a single image with cosmic rays removed. | calstis2 |
Contemporaneous Wavecal Processing | ||
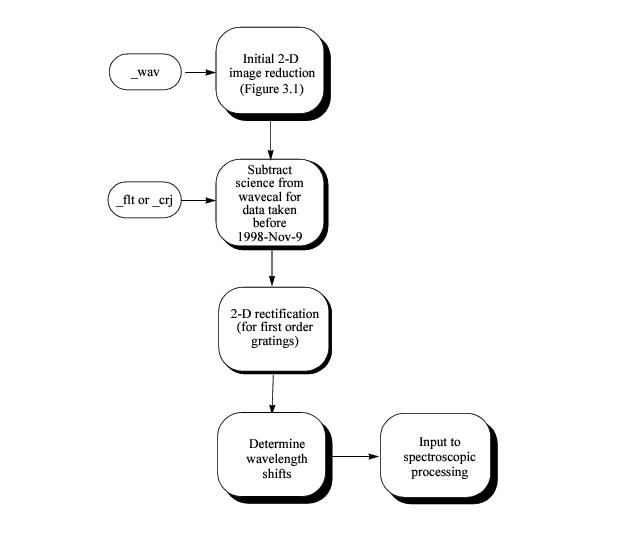
wavecal | Determine MSM offset from wavecal. This step is used in conjunction with calstis7, calstis11, and calstis12. Its purpose is to find the offset of the spectrum from the expected location, owing to nonrepeatability of the mode select mechanism. The shift is written into the SCI extension header of the input wavecal image. | calstis4 |
Subtract science image from wavecal. For CCD wavecal observations taken with the HITM system prior to 1998-Nov-9, the detector was exposed to both the wavecal and the science target (after that date, the external shutter would be closed). This task reads both the wavecal and science images and subtracts the science data (suitably scaled) from the wavecal. Following this step, calstis4 can be used to determine the spectral shift. | calstis11 | |
Write spectral shift value to science header. A series of science images (i.e., CR-SPLIT or REPEATOBS) and wavecals may have been taken, with the wavecals interspersed in time among the science images. For each image in the science files, this task linearly interpolates the wavecals to the time of the science image, and then writes the keyword values | calstis12 | |
Spectroscopic Calibration, Extraction, and Rectification | ||
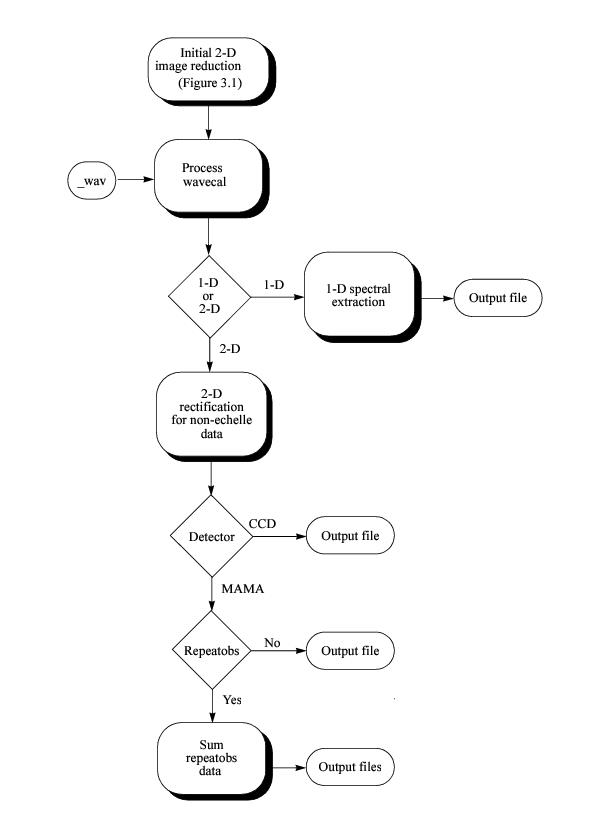
x1d | 1-D spectral extraction. This task is most appropriate for observations of a point source. A spectrum is extracted along a narrow band -- summed over the cross-dispersion direction, with background values subtracted – to produce a 1-D array of net fluxes for each spectral order. By applying the zero point shifts calculated by the previous wavecal step, an array of wavelengths is generated, with each output spectrum written to a separate row of a FITS binary table, together with the arrays of the gross, net, and background count rates. One output table is generated for each image in a series of REPEATOBS data. For echelle observations, x1d and the echelle scattered light correction routine are called iteratively, to calculate the echelle background. | calstis6 |
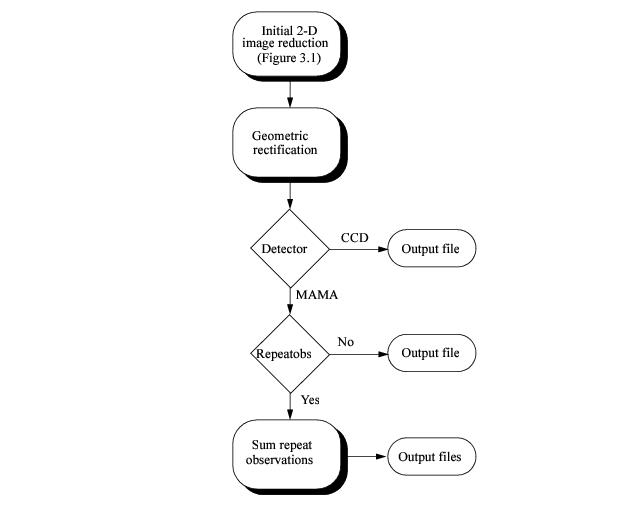
x2d | 2-D rectification. This task performs geometric correction for direct imaging or long-slit spectroscopic data. For the latter, it produces a spectral image that is linear in both wavelength and spatial directions. | calstis7 |
Sum Images | ||
Sum REPEATOBS data. This task adds together (pixel by pixel) multiple MAMA images, and combines them into one FITS file. This would not normally be used for CCD data because they would already have been combined for cosmic ray rejection. | calstis8 | |
1 Referenced in the trailer file.
Below, we present a series of flow charts that provide a more complete overview of the processing of data through the calstis pipeline, starting with the fundamental steps of two-dimensional image reduction. Figure 3.1 shows the initial steps in the routes taken by CCD data and by MAMA data.
NRPTEXP > 1. The output is a geometrically rectified image with suffix _x2d or _sx2, and header keywords that specify the photometric calibration. When geometric correction is not applied, the output will be flat-fielded data with suffix _crj, _flt, or _sfl.
SHIFTA1, SHIFTA2) in the dispersion and cross-dispersion directions, thereby correcting for the lack of repeatability of the mode select mechanism (MSM) or for thermal drift. These keywords are written into the science header of the flat-fielded (MAMA or single exposure CCD) or cosmic ray rejected (CCD) image.One-dimensional spectral extraction produces a one-dimensional spectrum of flux versus wavelength (in the _x1d or _sx1 file), uninterpolated in wavelength space but integrated across an extraction aperture in the spatial direction.


