5.2 Evaluating Target Acquisitions and Guiding
5.2.1 Target Acquisition Basics
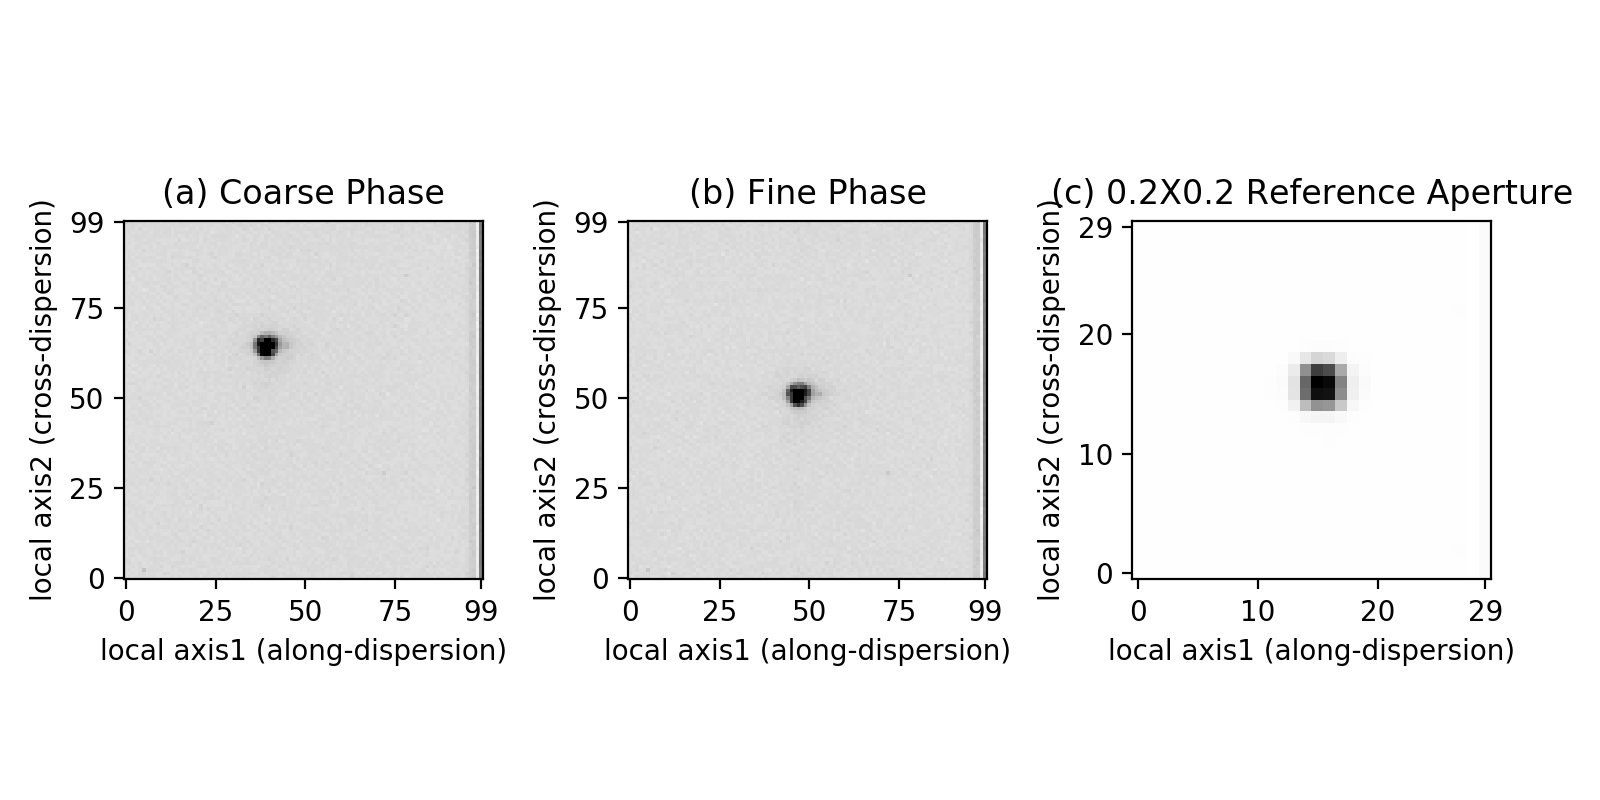
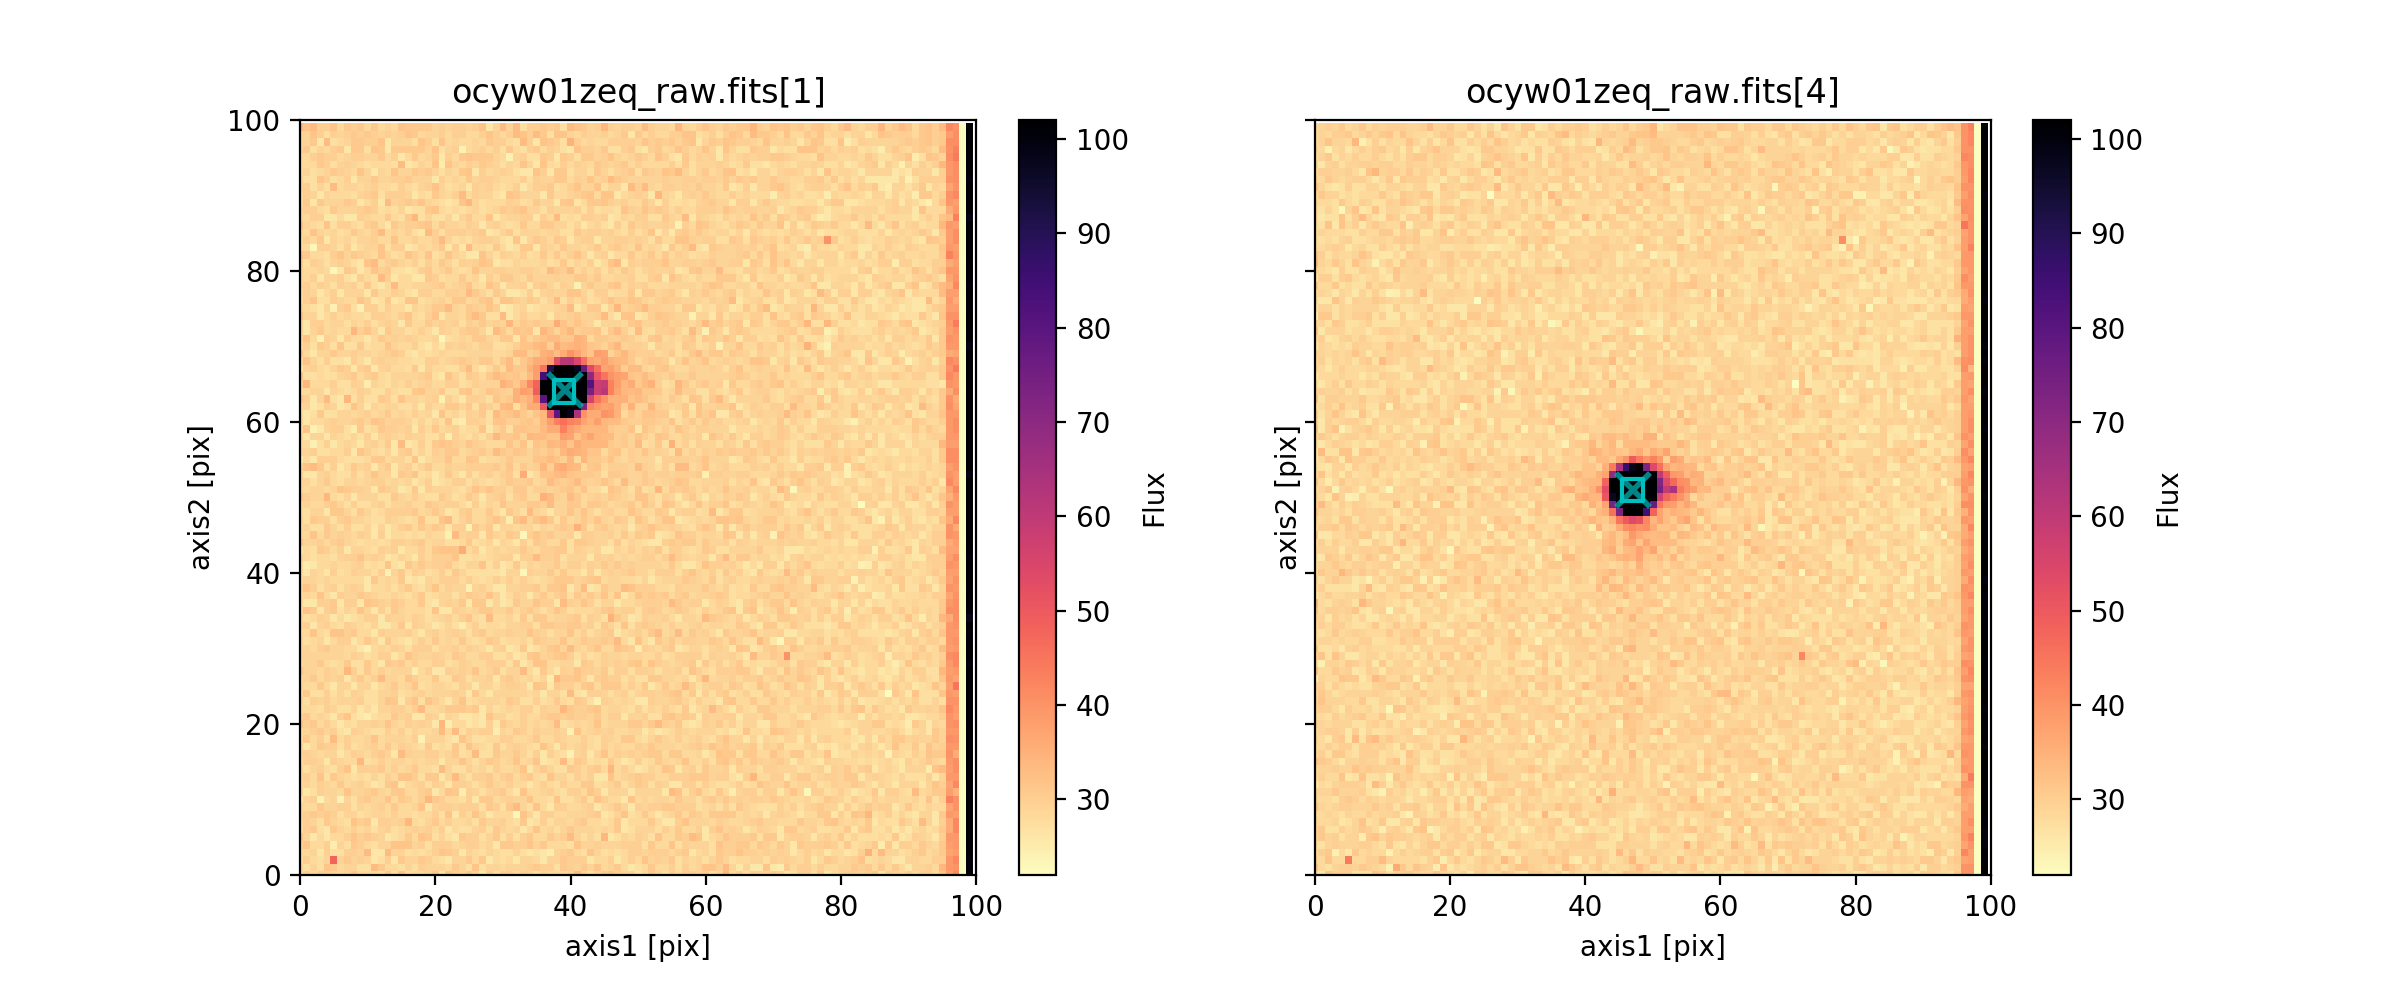
There are two types of STIS target acquisition: ACQ and ACQ/PEAK; for more details on target acquisition, see STIS ISR 97-03 and STIS Instrument Handbook Chapter 8. For ACQ observations, there are three parts to the target acquisition data that you receive. The first is an image of the target in the target acquisition sub-array (100 × 100 pixels for point sources, scaling linearly for diffuse sources) based on the initial pointing (see Figure 5.1a, _raw.fits[’sci’,1]). The software then determines the position of the target with a flux weighted pointing algorithm and calculates the slew needed to place the target at a reference point in the target acquisition sub-array; for diffuse sources, an option to perform a geometric centroiding is available. An image of the target at this corrected position is then obtained (see Figure 5.1b, _raw.fits[’sci’,2])—this is the coarse centering. To perform the fine centering (i.e., to place the object precisely in a slit), a 32 × 32 pixel image of the lamp-illuminated 0.2X0.2 aperture (the "reference aperture") is obtained (see Figure 5.1c _raw.fits[’sci’,3]), and the location of the aperture on the detector is determined. A fine slew is then performed to center the target in the reference aperture, which should be accurate to 0.2 pixels (0.01 arcsec). A final slew to center the target in the science aperture is performed at the start of the following science observation.
If a narrow aperture is used for the science exposures, an ACQ/PEAK acquisition may have been performed to refine the centering of the ACQ. An aperture (often the science aperture) is stepped across the object with a pattern determined by the aperture selected. The flux measured at each step is saved, but the image is not. The telescope is then slewed to center the target in the aperture, and a "confirmation" image (a 32 × 32 pixel grid for imaging mode) of the target viewed through the aperture is obtained and saved. The pattern of fluxes and the confirmation image are delivered in a _raw file. The accuracy of the ACQ/PEAK is 5% of the slit width for a point source with adequate signal-to-noise. See Section 8.3 in the STIS Instrument Handbook.
5.2.2 ACQ Data
The ACQ _raw.fits file contains the initial image of the target, the image of the target after the coarse slew, and the image of the lamp viewed through the 0.2X0.2 aperture:
>>> from astropy.io import fits
>>> fits.info('ocyw01zeq_raw.fits')

Filename: ocyw01zeq_raw.fits
No.    Name      Ver    Type      Cards   Dimensions   Format
  0  PRIMARY       1 PrimaryHDU     208   ()
  1  SCI           1 ImageHDU       105   (100, 100)   int16 (rescales to uint16)
  2  ERR           1 ImageHDU        54   ()
  3  DQ            1 ImageHDU        37   ()
  4  SCI           2 ImageHDU       105   (100, 100)   int16 (rescales to uint16)
  5  ERR           2 ImageHDU        54   ()
  6  DQ            2 ImageHDU        37   ()
  7  SCI           3 ImageHDU       105   (30, 30)   int16 (rescales to uint16)
  8  ERR           3 ImageHDU        54   ()
  9  DQ            3 ImageHDU        39   ()
Note that target acquisition data are always uncalibrated; the ERR and DQ images are unpopulated. An examination of the target images can detect gross errors in the centering of the target. A comparison of the initial image (extension [’sci’,1] or [1]) and post coarse slew image (extension ['sci',2] or [4]) should show the object moving close to the center of the acquisition sub-array, as in Figure 5.1a and Figure 5.1b. It will not be precisely centered, as the MSM’s centering is non-repeatable and measured with the HITM lamp image. This correction is applied before the science exposure.
One can also verify that the maximum flux in a checkbox is consistent in the two images, either by running tastis (Section 5.2.4) or by using Python to find this flux in the keyword MAXCHCNT in the science extension headers:
>>> with fits.open('ocyw01zeq_raw.fits') as f:
       print ("Coarse stage -- ext['SCI',1] = ext[1]:  ", f['SCI',1].header['MAXCHCNT'])
       print ("Fine stage   -- ext['SCI',2] = ext[4]:  ", f['SCI',2].header['MAXCHCNT'])

Coarse stage -- ext['SCI',1] = ext[1]:    6434.0
Fine stage   -- ext['SCI',2] = ext[4]:    6514.0
If the fluxes are not consistent, or if the object did not move closer to the center of the array, there is likely a problem with the acquisition. A more extensive analysis of the ACQ data is performed by tastis (Section 5.2.4).
5.2.3 ACQ/Peak Data
The ACQ/PEAK _raw.fits file contains the final "confirmation" image of the target viewed through the aperture in the first extension and the fluxes measured in the stepping pattern in the fourth extension:
>>> fits.info('od6n05ikq_raw.fits')

Filename: od6n05ikq_raw.fits
No.    Name      Ver    Type      Cards   Dimensions   Format
  0  PRIMARY       1 PrimaryHDU     207   ()
  1  SCI           1 ImageHDU        99   (32, 32)     int16 (rescales to uint16)
  2  ERR           1 ImageHDU        54   ()
  3  DQ            1 ImageHDU        37   ()
  4  PEAKUP        1 ImageHDU        97   (7, 1)       int32
To verify that the ACQ/PEAK worked, use tastis (Section 5.2.4) to analyze this data. Here we describe other ways to examine the data.
One can see the flux values at each stage of the peakup relative to the minimum value, which is set to zero, by examining the ext=4 data with the fits module in astropy.io, e.g.,
>>> fits.getdata('od6n05ikq_raw.fits', ext=4)
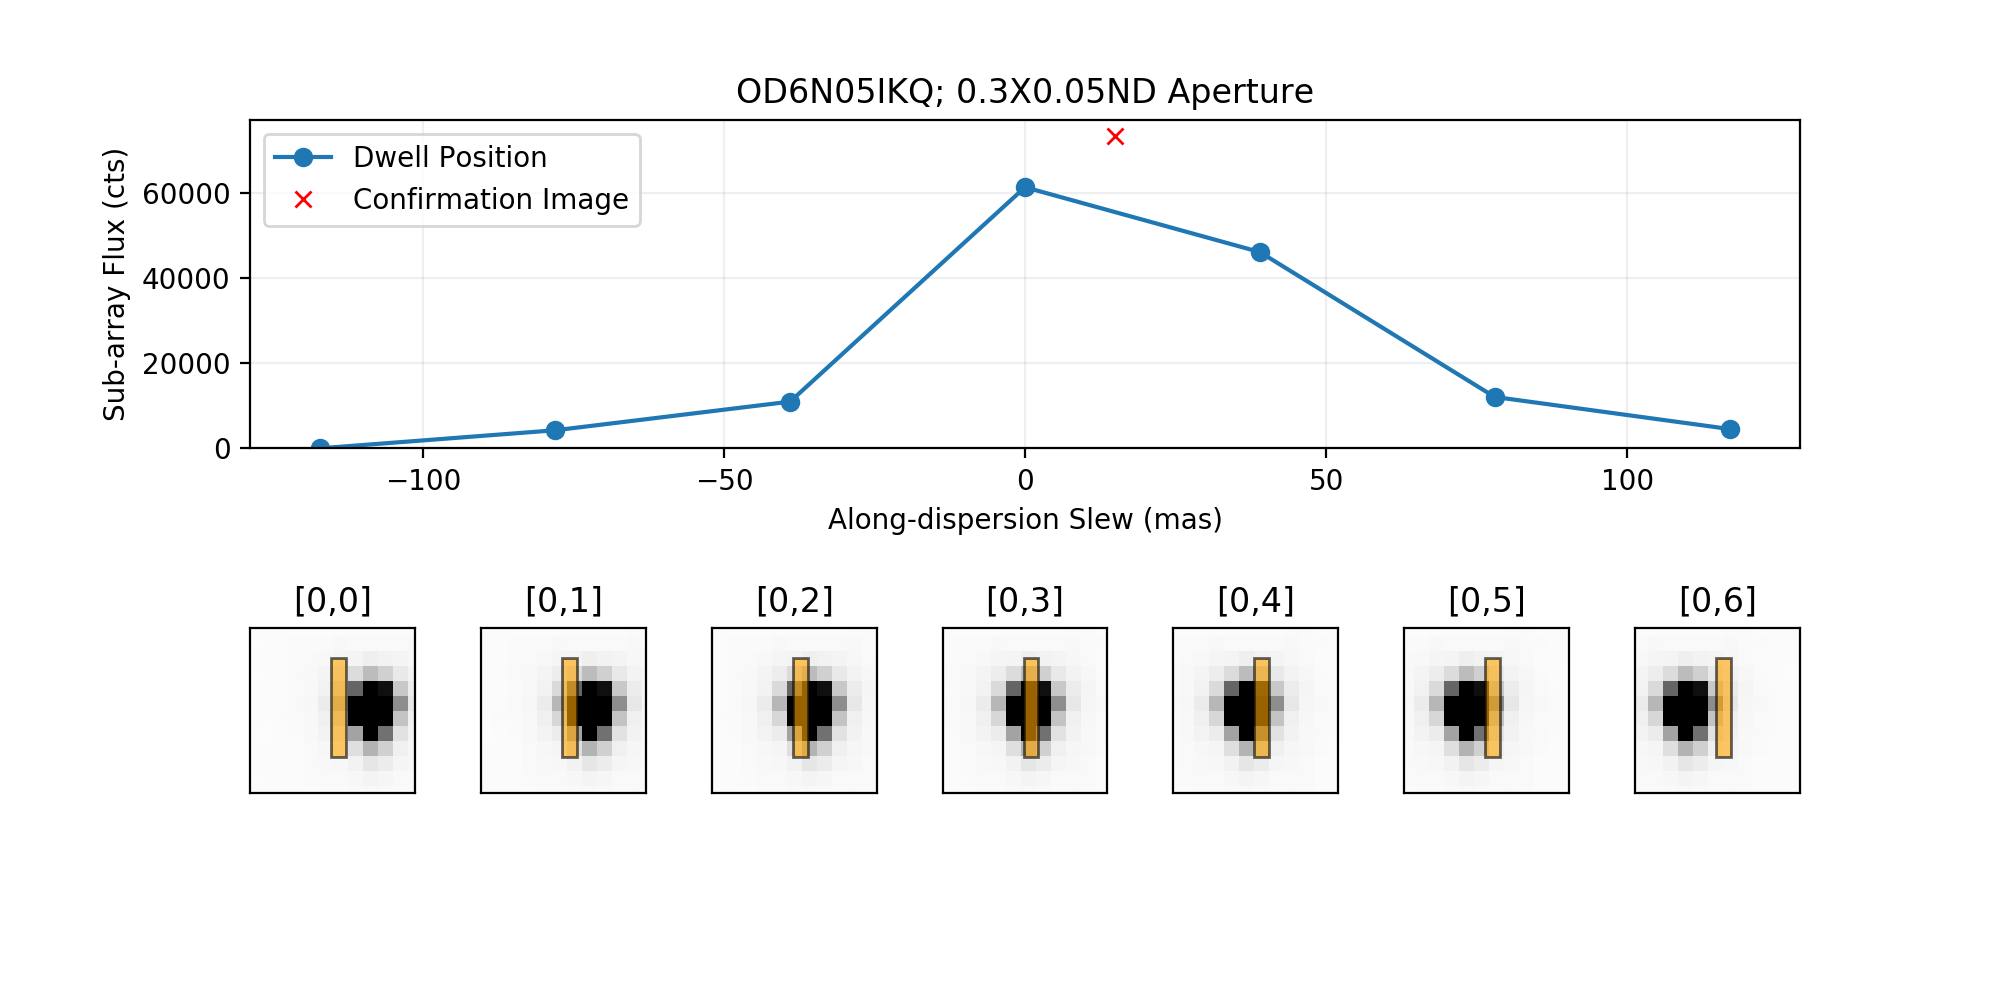
array([[ 0, 4236, 10970, 61423, 46167, 12072, 4531]], dtype=int32)
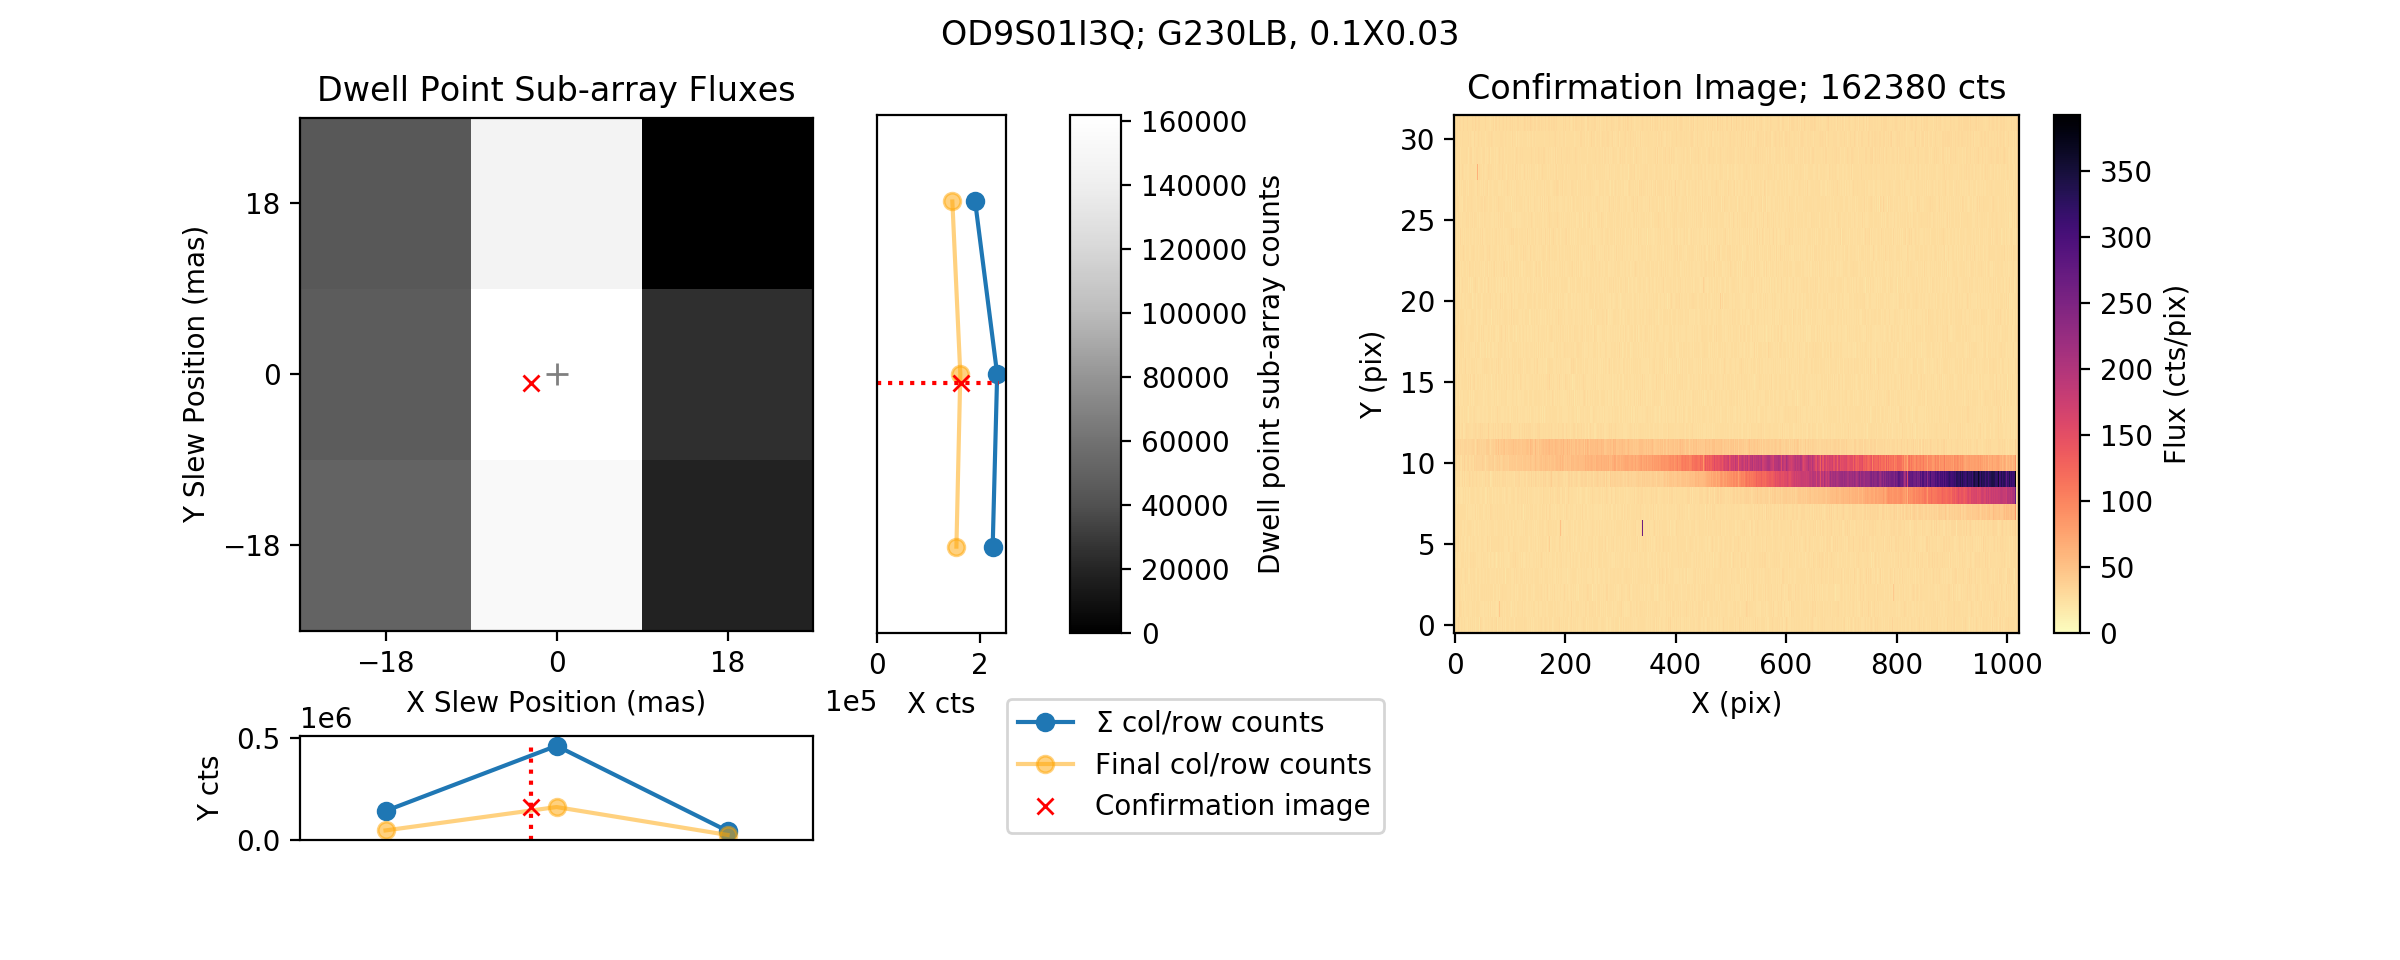
For a 7-step along-dispersion linear peakup, the pixel [0,0] is the leftmost scan position, [0,3] is the middle position, and [0,6] is the rightmost position. See Figure 5.2 for a cross-dispersion linear peakup, the dimensions are reversed.
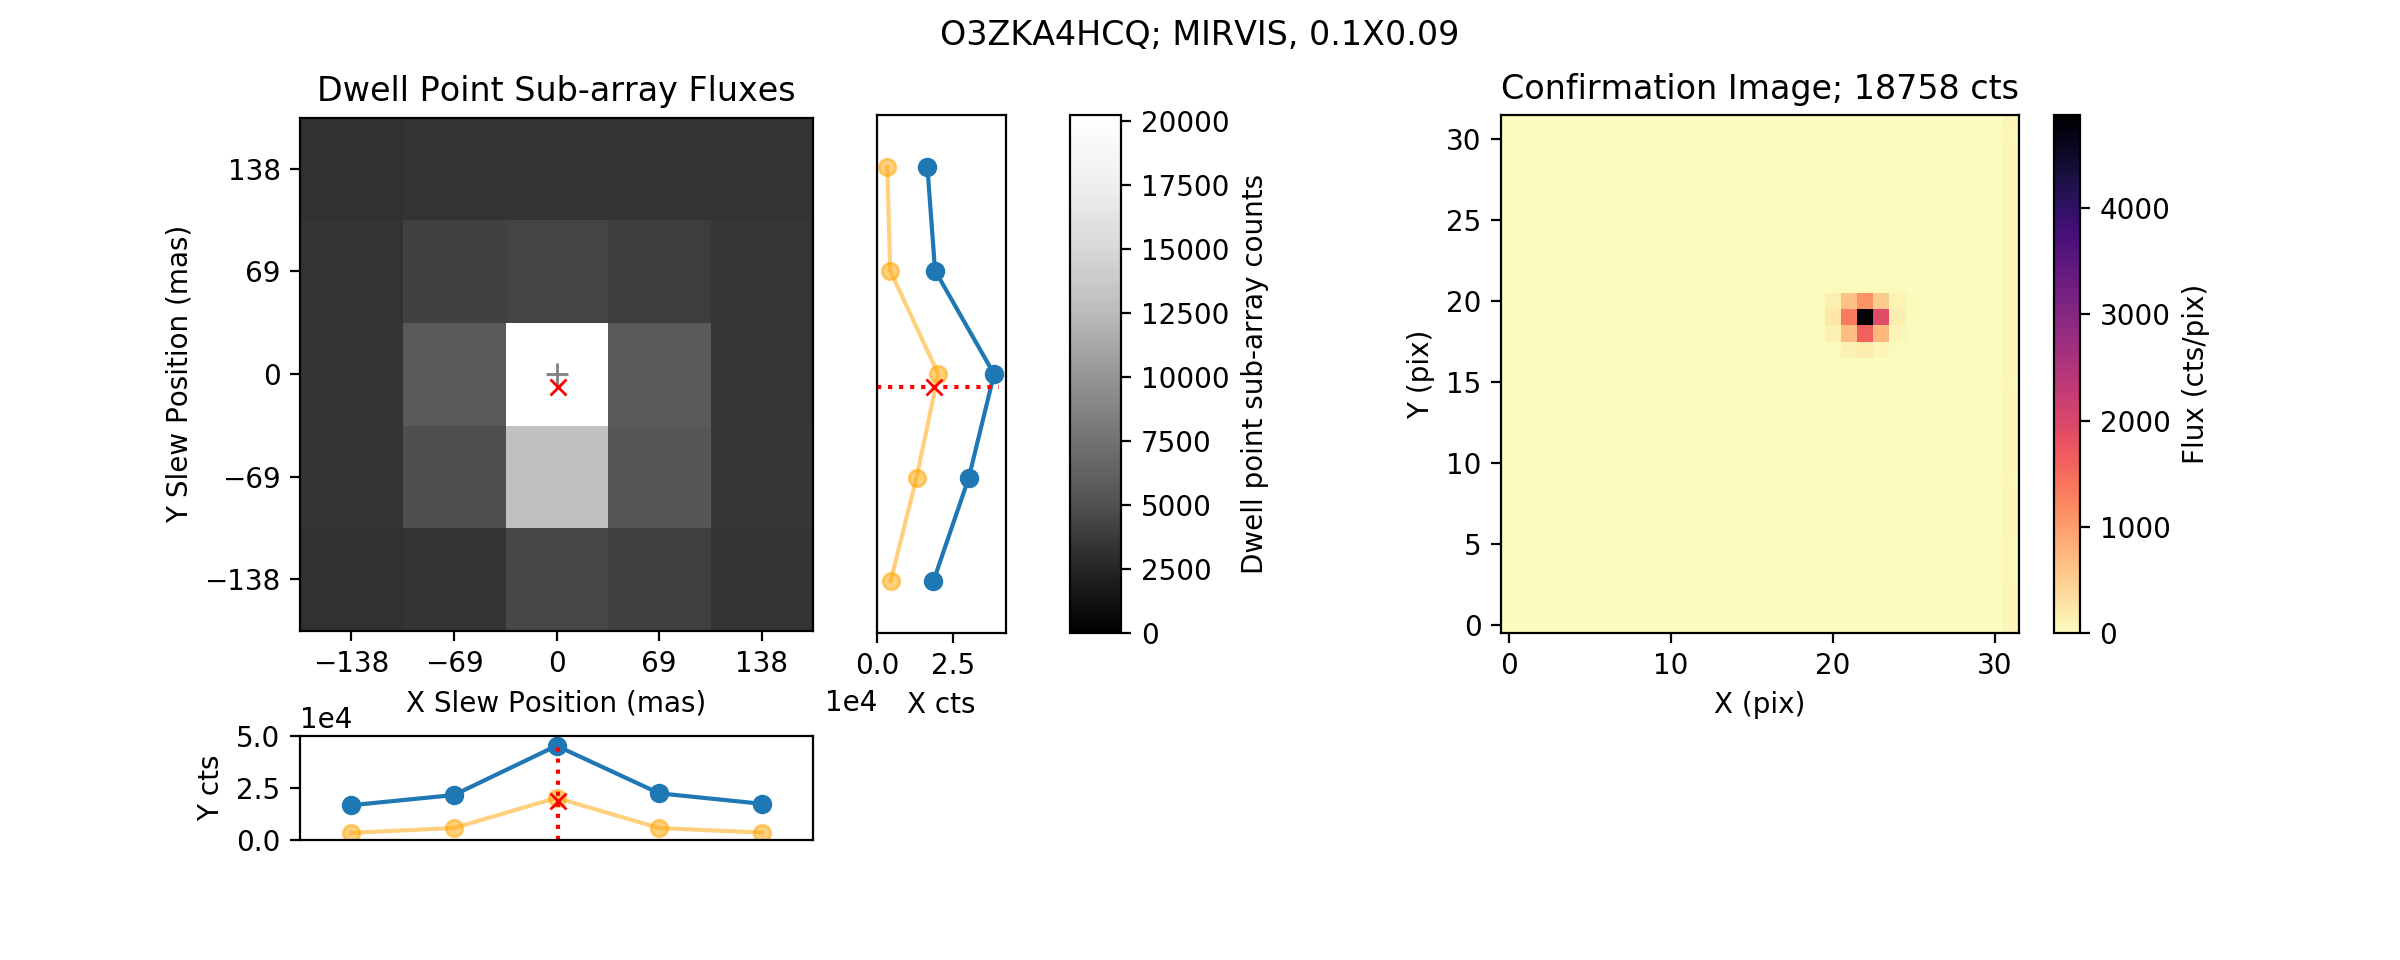
When examining the confirmation image (_raw.fits[4]), note that the slit will be illuminated by the sky even if no target is present. See Figure 5.3 for examples of successful and failed acquisitions.
To determine the flux in the confirmation image, do the following inPython:
>>> fits.getdata('od6n05ikq_raw.fits', ext=1).sum()
106798
The total counts in the image is 106798 in this example. Note that one correction will need to be performed to the total value prior to the comparison. Since the flux values in the peakup have been adjusted by subtracting the minimum value in the sequence, this value needs to be subtracted from the counts in the confirmation image to do a proper comparison. The value can be found in the _raw.fits file ext=0 PEDESTAL keyword as shown in the example below.
>>> fits.getval('od6n05ikq_raw.fits', ext=0, keyword='PEDESTAL')
33233.0
In the example, the PEDESTAL value was 33233 which means the corrected number of counts in the confirmation image is 73565. Comparison of the maximum flux value during the peakup sequence (61423) with the adjusted flux in the confirmation image (73565) should show that the flux in the confirmation image was greater than or equal to the maximum flux in the peakup grid. If this is not the case, then there could be a problem with the peakup acquisition. A more extensive analysis, taking into account the distribution of fluxes across the ACQ/PEAK steps and the magnitude of the fluxes, is performed by tastis (Section 5.2.4).
5.2.4 The tastis Task
The stistools package contains a task, tastis, that will print general information about each input target acquisition image, and will analyze both types of STIS target acquisitions: ACQs and ACQ/PEAKs. For an ACQ, target positions, in global and local (sub-array) coordinates, and the total flux of the target in the maximum checkbox during both acquisition phases (coarse and fine) are displayed; the location of the reference aperture (used during the fine locate phase) is also displayed. For an ACQ/PEAK, the flux values at each step during the peakup, the total flux in the post-slew confirmation image, and the pedestal value subtracted from each dwell point are displayed. For each procedure, diagnostics are performed and the user will either be informed that the procedure appears to have succeeded or will be warned of an apparent problem.
For an ACQ, tastis examines the flux of the brightest object in the original image of the target, the flux of the brightest object in the recentered image of the target, and the flux of the lamp viewed through the reference aperture. It also examines the slews made to recenter the target and to place it at the position of the reference aperture, and the status of the DATAFLAG in the _spt file, which can indicate that an exposure was not performed. For an ACQ/PEAK, tastis analyzes the sequence of fluxes measured in the stepping pattern, compares the peak flux in the stepping pattern to the flux in the confirmation image, and checks the status of the DATAFLAG. If any unexpected values are encountered, a diagnostic message is given to the user. For example, the user is warned if the brightest measured flux in the first and second ACQ images is significantly different, since the same target and flux would normally be dominant in each image. A warning is given if the expected lamp flux is not detected, since failure to illuminate and locate the reference aperture on the detector would result in a misplacement of the target in the slit. An ACQ/PEAK triggers a warning if the flux is too low for good signal-to-noise, the most common cause of poor ACQ/PEAKs. Other diagnostics are documented in the task’s documentation. An example run of tastis is shown below.
>>> stistools.tastis.tastis('ocyw01zeq_raw.fits')

===============================================================================
ocyw01zeq       HST/STIS    MIRVIS      F25ND3             ACQ/POINT
prop: 14084      visit: 01    line: 1   target: GJ3323
obs date, time: 2016-09-22    03:37:22   exposure time: 30.90
dom GS/FGS: S1NF000373F2    sub-dom GS/FGS: S1ND000111F1
ACQ params:     bias sub: 1510   checkbox: 3      method: FLUX CENTROID
subarray (axis1,axis2):   size=(100,100)          corner=(487,466)
-------------------------------------------------------------------------------
Coarse locate phase:           Target flux in max checkbox (DN): 6434

                       global          local
                    axis1 axis2     axis1 axis2
Target location:    525.2  529.3    39.2  64.3

                    axis1 axis2     axis1  axis2         V2      V3
                      (pixels)        (arcsec)            (arcsec)
Estimated slew:     -10.5  13.3    -0.536  0.676        0.099 -0.857
-------------------------------------------------------------------------------
Fine locate phase:            Target flux in max checkbox (DN): 6514

                       global            local
                    axis1 axis2     axis1 axis2
Target location:    533.1  516.0    47.1  51.0
Ref ap location:    536.5  515.5    18.5  15.5

                    axis1 axis2     axis1  axis2         V2      V3
                      (pixels)        (arcsec)           (arcsec)
Estimated slew:     -2.2   0.5     -0.109  0.025      -0.059 -0.095
-------------------------------------------------------------------------------
Total est. slew:    -12.7  13.8    -0.645  0.701         0.039 -0.952
-------------------------------------------------------------------------------
Your ACQ appears to have succeeded, as the fluxes in the coarse
and fine stages agree within 25% and the fine slews were less than
4 pixels as expected

All coordinates are zero-indexed.
===============================================================================
5.2.5 The stistarg Package
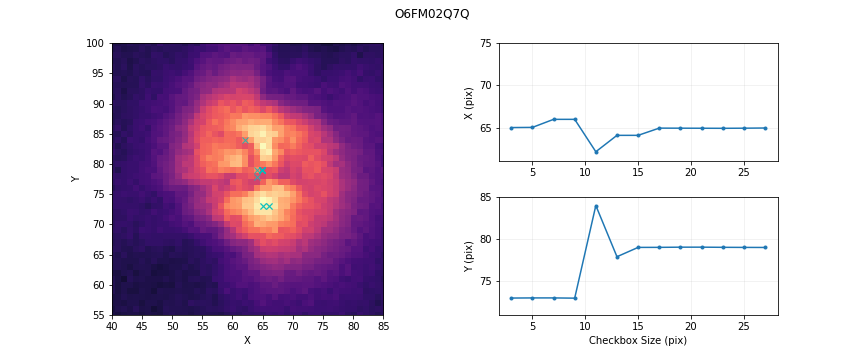
The STIS target acquisition simulator, or stistarg, is a Python package that allows users to simulate and visualize the behavior of the STIS flight software (FSW) on an input image while varying the APT acquisition optional parameters. Inputs are assumed to be in the native STIS plate scale and detector format, so users should scale and trim images from other instruments accordingly. Note that differences in the filter throughputs convolved with the source's SED may affect the flux distribution of extended sources. The stistarg can be run as follows.
>>> import stistarg
>>> st = stistarg.stistarg('ocyw01zeq_raw.fits', display=True)

-------------------------------------------------------------------------------
STIS Target Acquisition Simulator
stistarg.py v2.4
Python v3.6.3
Run time:  2018-11-09 22:58:52
Input Options:   point source, checkbox size = 3

Input File:      ocyw01zeq_raw.fits[1]
Image Subarray:  (95, 100)
Brightest checkbox flux:  6434
Flux center:              axis1 = 39.2 ; axis2 = 64.3  [cyan X]

Input File:      ocyw01zeq_raw.fits[4]
Image Subarray:  (95, 100)
Brightest checkbox flux:  6514
Flux center:              axis1 = 47.1 ; axis2 = 51.0  [cyan X]

(All coordinates are zero-indexed.)
-------------------------------------------------------------------------------
For more details, see the stistarg documentation at https://stistarg.readthedocs.io and the STIS notebook on Evaluating STIS Target Acquisitions.
5.2.6 Guiding Error for Single Guide Star Mode
Tracking on two guide stars has generally provided pointing accuracy sufficient to keep targets well centered in the narrow STIS apertures for several orbits. However, in some cases, observations have been made using only a single guide star instead of the usual two. Either the Principal Investigator has consented to this in consultation with the Program Coordinator when two suitable guide stars could not be found, or one Fine Guidance Sensor failed to acquire its guide star during the guide star acquisition/reacquisition. See Sections 6.3.1 and 6.3.2 in the Introduction to the HST Data Handbooks for keywords to check for the status of the guide star acquisition. In this situation, the roll of the telescope is under GYRO control, which may allow a slow drift of the target on a circular arc centered on the single guide star.
The rate of the drift of the radiant of this circle is unknown for any particular observation, but typically is expected to be in the range of 1.0 to 1.5 milliarcsec/sec (possibly, but very rarely, as large as 5 milliarcsec/sec).
To calculate the approximate magnitude of the drift of the target on the detector, one will need to find the distance of the target from the acquired guide star. The primary header of the observation log file _jif identifies the acquired guide star (GSD_ID) and gives its right ascension (GSD_RA) and declination (GSD_DEC) in degrees. For example, for a target 10 arcmin from the guide star, a drift of the guide-star-to-target radiant of 1 milliarcsec/sec during a 1,000 second exposure would cause the target to move 0.0029 arcsec on the detector. The direction of the motion on the detector can be deduced from header keywords in the science data describing the position angle of the detector (e.g., PA_APER), in combination with the direction perpendicular to the radiant. In many cases, the drift will be a small fraction of a pixel or slit width, although in some cases an image exposure may appear smeared or the target may drift from the slit of a spectroscopic exposure.
Elongation of point sources in direct images can be assessed by examination of the image or contour plots. If a series of spectroscopic images has been made, it may be possible to measure increments in position along the slit or increments in wavelength (due to motion in the dispersion direction) on _x2d images or in _x1d extractions. For example, the values of the parameter A2CENTER in the _x1d file (adjusted for any changes in SHIFTA2) will reveal shifts along the slit. Wavelength shifts may be found by cross-correlation of the spectra. Once a shift has been found in either dimension, the geometry of the drift can be used with the spectroscopic dispersion to find the shift in the other dimension. Compensating adjustments can then be made to SHIFTA1 and SHIFTA2 to make _x1d or _x2d files that can be combined or compared, as discussed in Section 5.4.3.
