3.3 Data Flow Through calstis
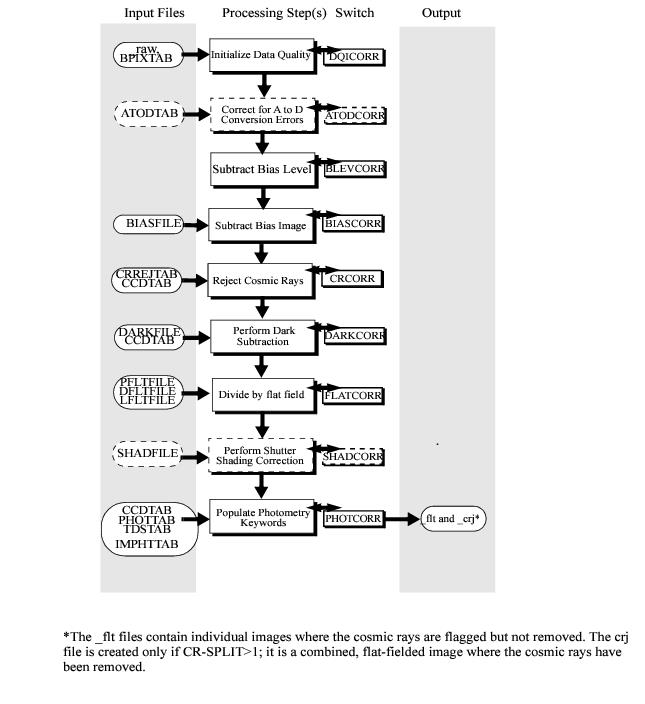
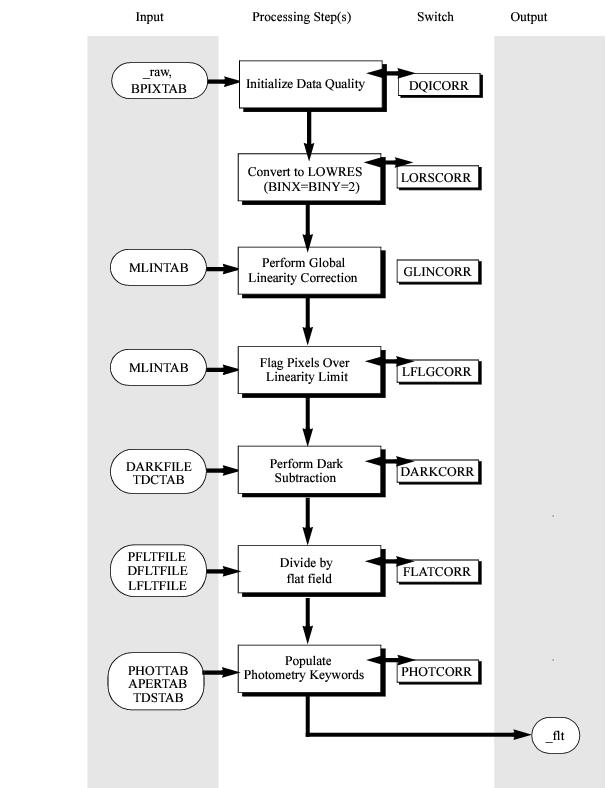
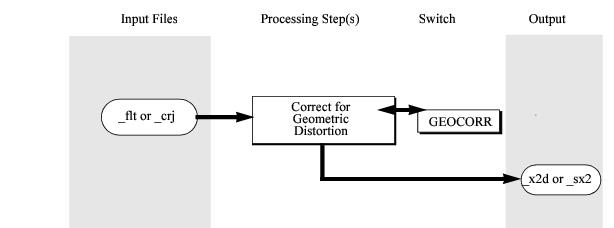
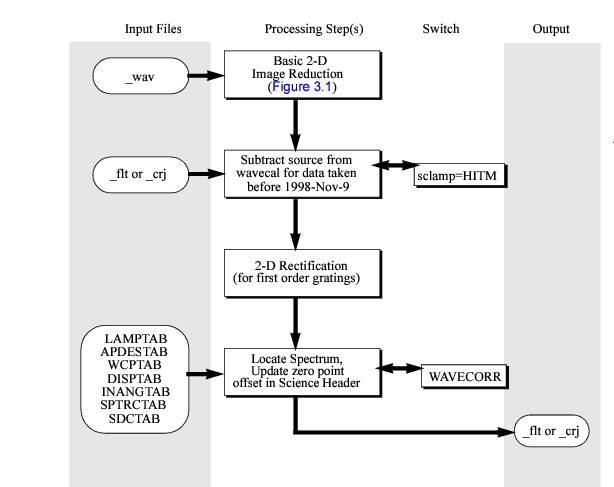
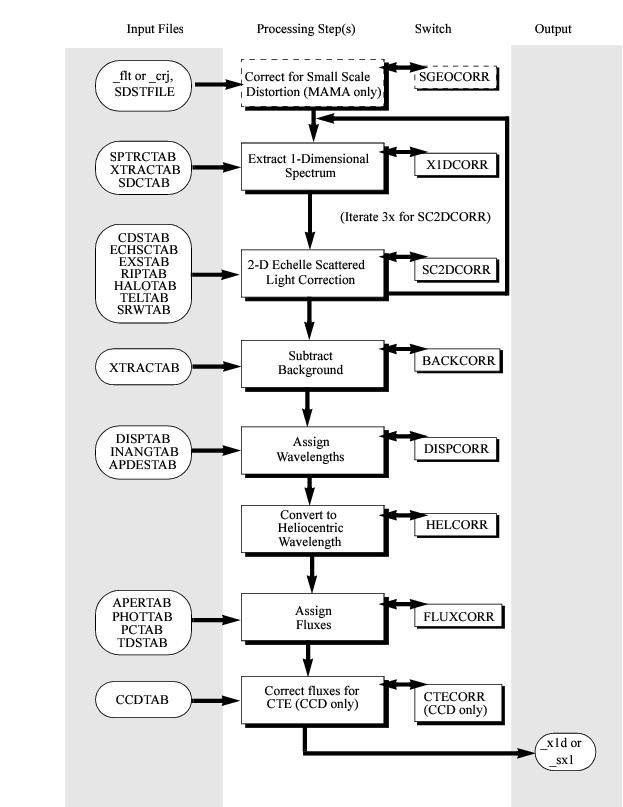
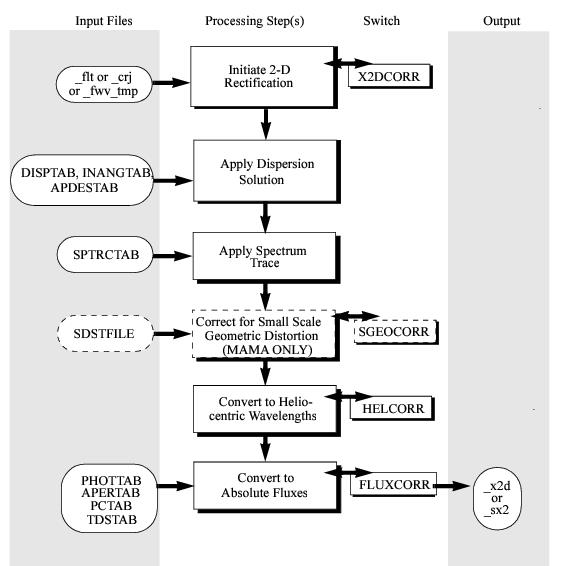
This section details the data flow through the calstis pipeline for each calibrated operating mode, showing the switches, the reference file inputs, the science file inputs, and the output products. These details are shown as flow charts in Figure 3.5 through Figure 3.11. The following section describes the tasks corresponding to the various calibration switches.
Note that some tasks are not implemented at this time. These appear in grey text in the flow charts, and are noted in the descriptions given in the subsequent section.
Figure 3.5: 2-D CCD Data Reduction Common to Imaging and Spectroscopy
Figure 3.6: 2-D MAMA Data Reduction Common to Imaging and Spectroscopy
Figure 3.7: Flow of Imaging Data through Calstis-7, 2-D Rectification
Figure 3.8: Flow of Spectroscopic Data through Calstis-4, wavecal Processing
Figure 3.9: Flow of Spectroscopic Data through calstis-6, 1-D Extraction
Figure 3.10: Flow of Spectroscopic Data through calstis-7, 2-D Rectification
Figure 3.11: Flow through calstis-8, Summing MAMA REPEATOBS Exposures
