4.3 Dark Current, Hot Pixels, and Cosmic Rays
HRC has been unavailable since January 2007. Information about the HRC is provided for archival purposes.
4.3.1 Dark Current
The procedure for creating ACS superdark reference files and applying dark subtraction to science data is described in detail in the doDark portion of Section 3.4.4. Because about a month is needed to collect enough frames to create the dark reference files, the "best" superdark reference file is typically not available in the pipeline for several weeks after the date of observation. Users may verify whether the dark reference file most appropriate to their observations has been delivered for pipeline use by checking the HST Calibration Reference Data System (CRDS) webpage.
Using an old superdark reference file will produce a sub-optimal dark correction, either leaving too many hot or unstable pixels uncorrected and unflagged or creating many negative "holes" caused by the correction of hot pixels which were not actually hot in the science data (i.e., if the detectors were annealed in the interim).
WFC and HRC
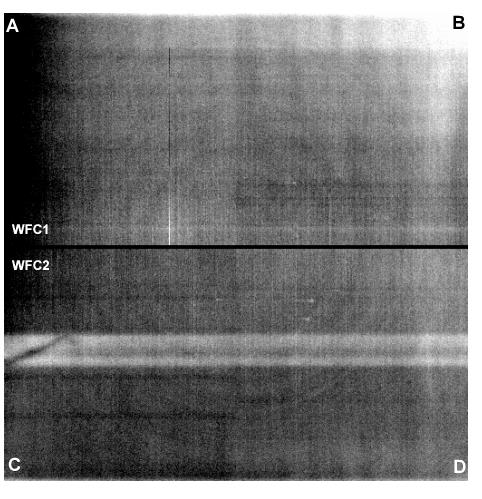
The dark current is not constant across the CCDs. Figure 4.7 shows dark current features in the WFC1 (above) and WFC2 (below) chips. These features were observed in pre-flight tests, and have generally remained stable in orbit.
There is a gradient, most noticeable on the WFC1 chip, going from a dark edge in the amplifier A quadrant (upper left) to a bright corner in the amplifier B quadrant (upper right). There are two horizontal bright bands of elevated dark current in the center of the WFC2 chip. Many faint rings are also visible, all concentric with the center of both chips. These features are likely intrinsic to the chips themselves, artifacts embedded in (or on) the silicon during various stages of the CCD manufacturing process.
Figure 4.7: High S/N Combination of WFC Dark Frames Illustrating Dark Current Structure
The increase in mean dark current for WFC has gone from 6.8 e¯/pixel/hour at launch in March 2002 to 11.1 e¯/pixel/hour (an average of 11.4 for WFC1 and 10.8 for WFC2) in April 2004. Following SM4, a dark current of 20 to 25 e¯/pixel/hour was measured and, as of December 2025, the median dark current was measured to be 53 to 65 e¯/pixel/hour among the four amplifiers.
For HRC the change in dark current was from 9.3 e¯/pixel/hour at launch to 13.4 e¯/pixel/hour in April 2004.
Figure 4.8: ACS/WFC Dark Current Histograms
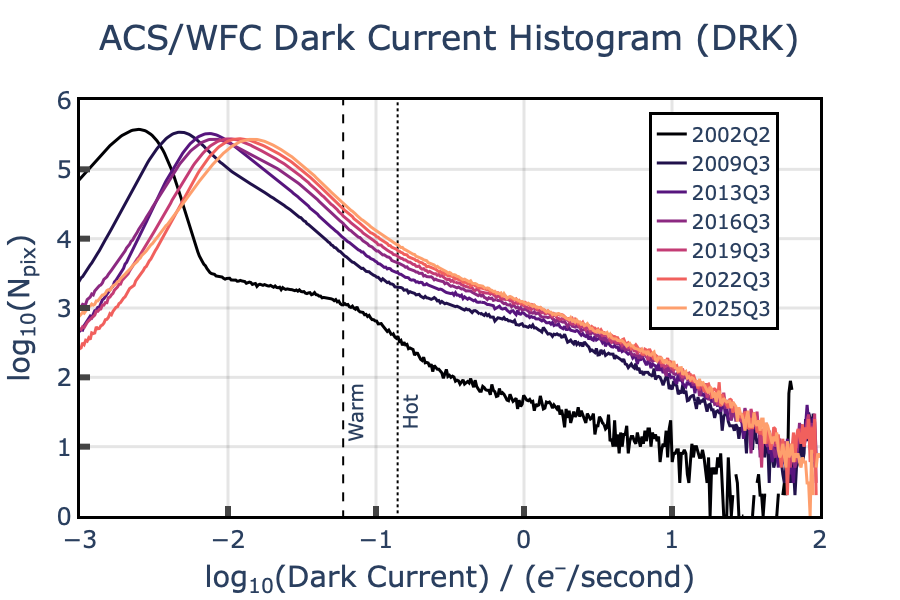
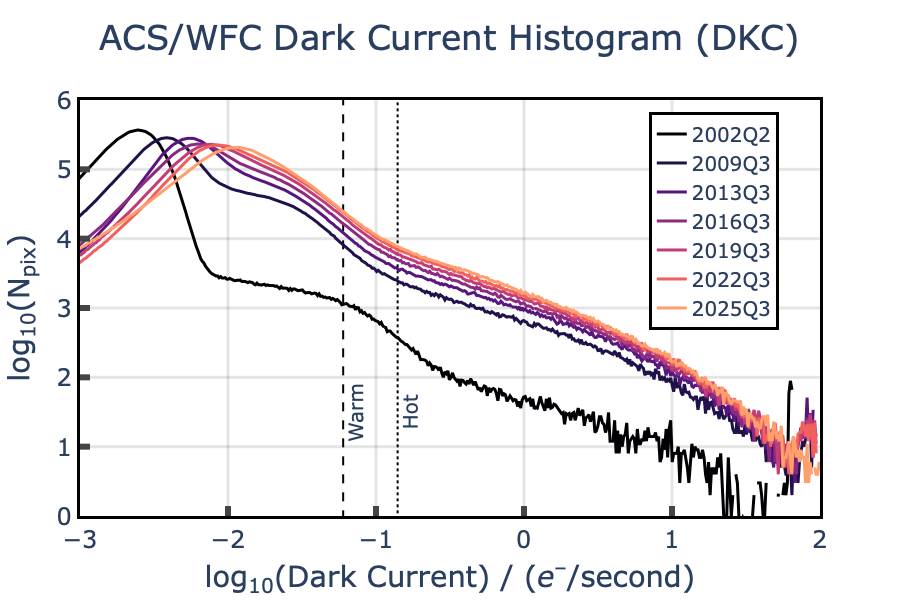
Distribution of dark current in WFC detector pixels over time as measured from normal (top) and CTE-corrected (bottom) superdark images. Over time, the distribution shifts to the right as the global dark current increases. The tail towards higher dark current values also increases in amplitude as the number of hot and warm pixels increases with time. The introduction of post-flash in the dark images in 2015 changed the shape of the distribution slightly, and allowed for a more accurate correction of CTE losses. While the shapes of the normal and CTE-corrected distributions are slightly different, the global dark current rates are similar.
Figure 4.9: HRC Dark Current Histogram
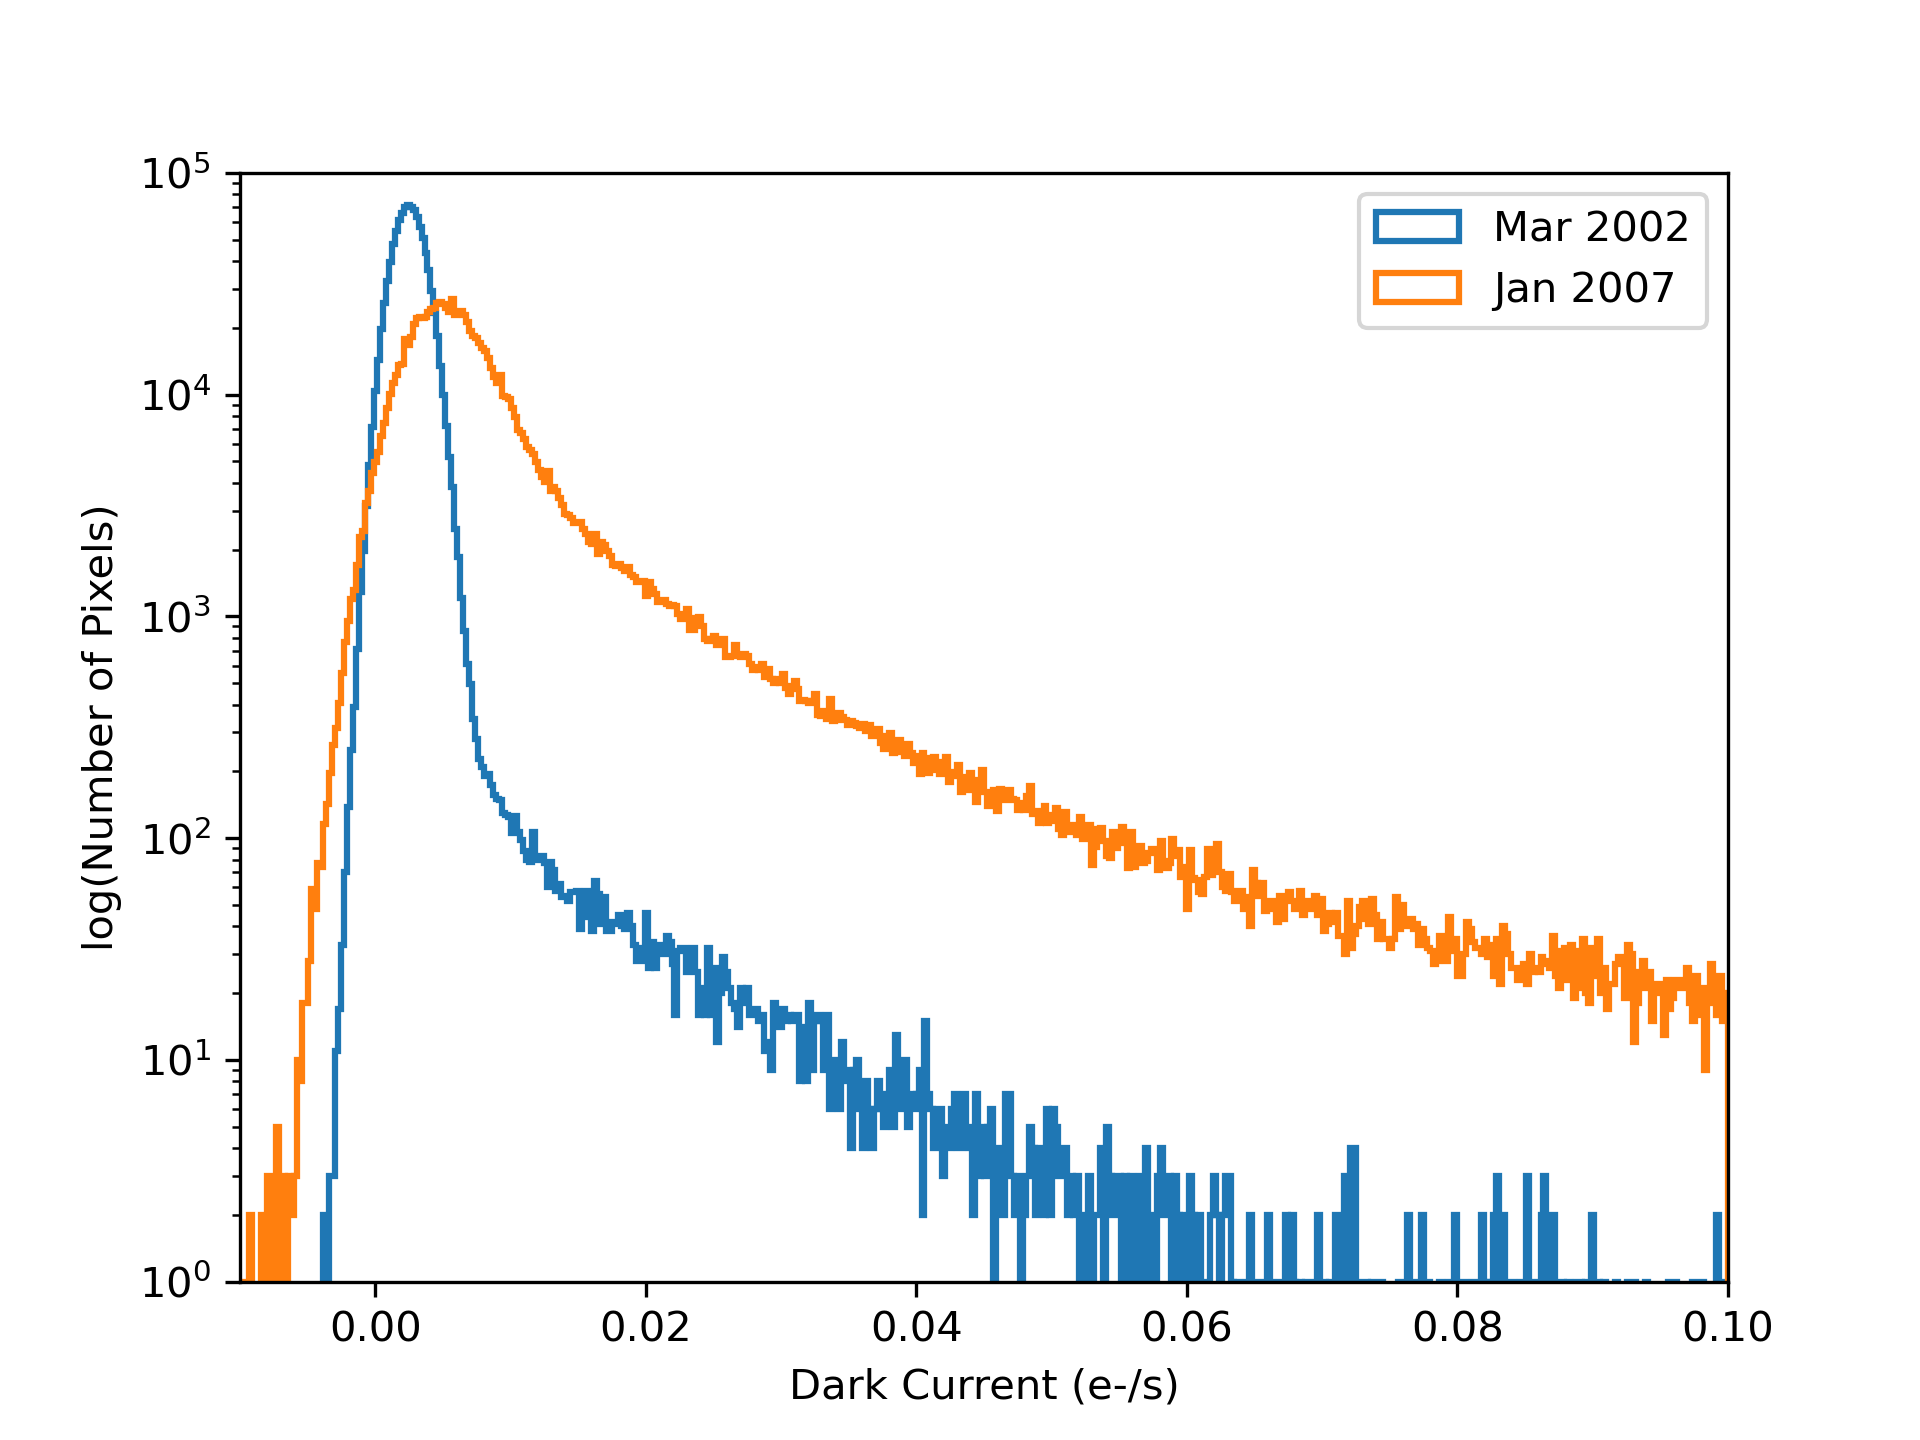
Data from the first (March 2002) and the last (January 2007) superdarks are shown. Dark current and hot pixels increased over time, as expected. Unlike Figure 4.8, HRC was not affected by the temperature change in WFC.
SBC
The Solar Blind Channel (SBC) of the Advanced Camera for Surveys (ACS) is a photon-counting Multi-Anode Microchannel Array (MAMA). The SBC detector intrinsically has no read noise and very low detector noise levels, which are normally negligible compared to statistical fluctuations. The amount of dark current, like CCDs, does still depend on the temperature of the detector (Figure 4.10). For the SBC, dark current is 8.52 × 10⁻⁶ counts/pixel/second until the detector reaches ~ 25°C (ACS ISR 2017-04 and also see ACS ISR 2024-04). Above that temperature, the central region of the detector begins to experience an increasingly higher dark rate. That being the case, dark frames cannot be subtracted from science observations like they are with CCDs. Unlike CCDs, MAMA dark images are not meant to capture hot and warm pixels. Instead, dark rate in MAMA detectors shows up as random background noise. For the purposes of scientific analysis, the dark rate can be subtracted along with the background, at least when the detector is still below ~25°C. Above that temperature, users should still be able to do a local subtraction, but should be aware of the pattern present in the dark rate.
Dark frames for the SBC are typically taken once per year (twice a year since Cycle 29) to monitor their levels. However, dark correction of SBC images is not used in the calibration pipeline because the correction is negligible. The dark current can be accounted for by considering it part of the background during normal photometric measurements.
Figure 4.10: SBC Dark Rate and Operating Temperature
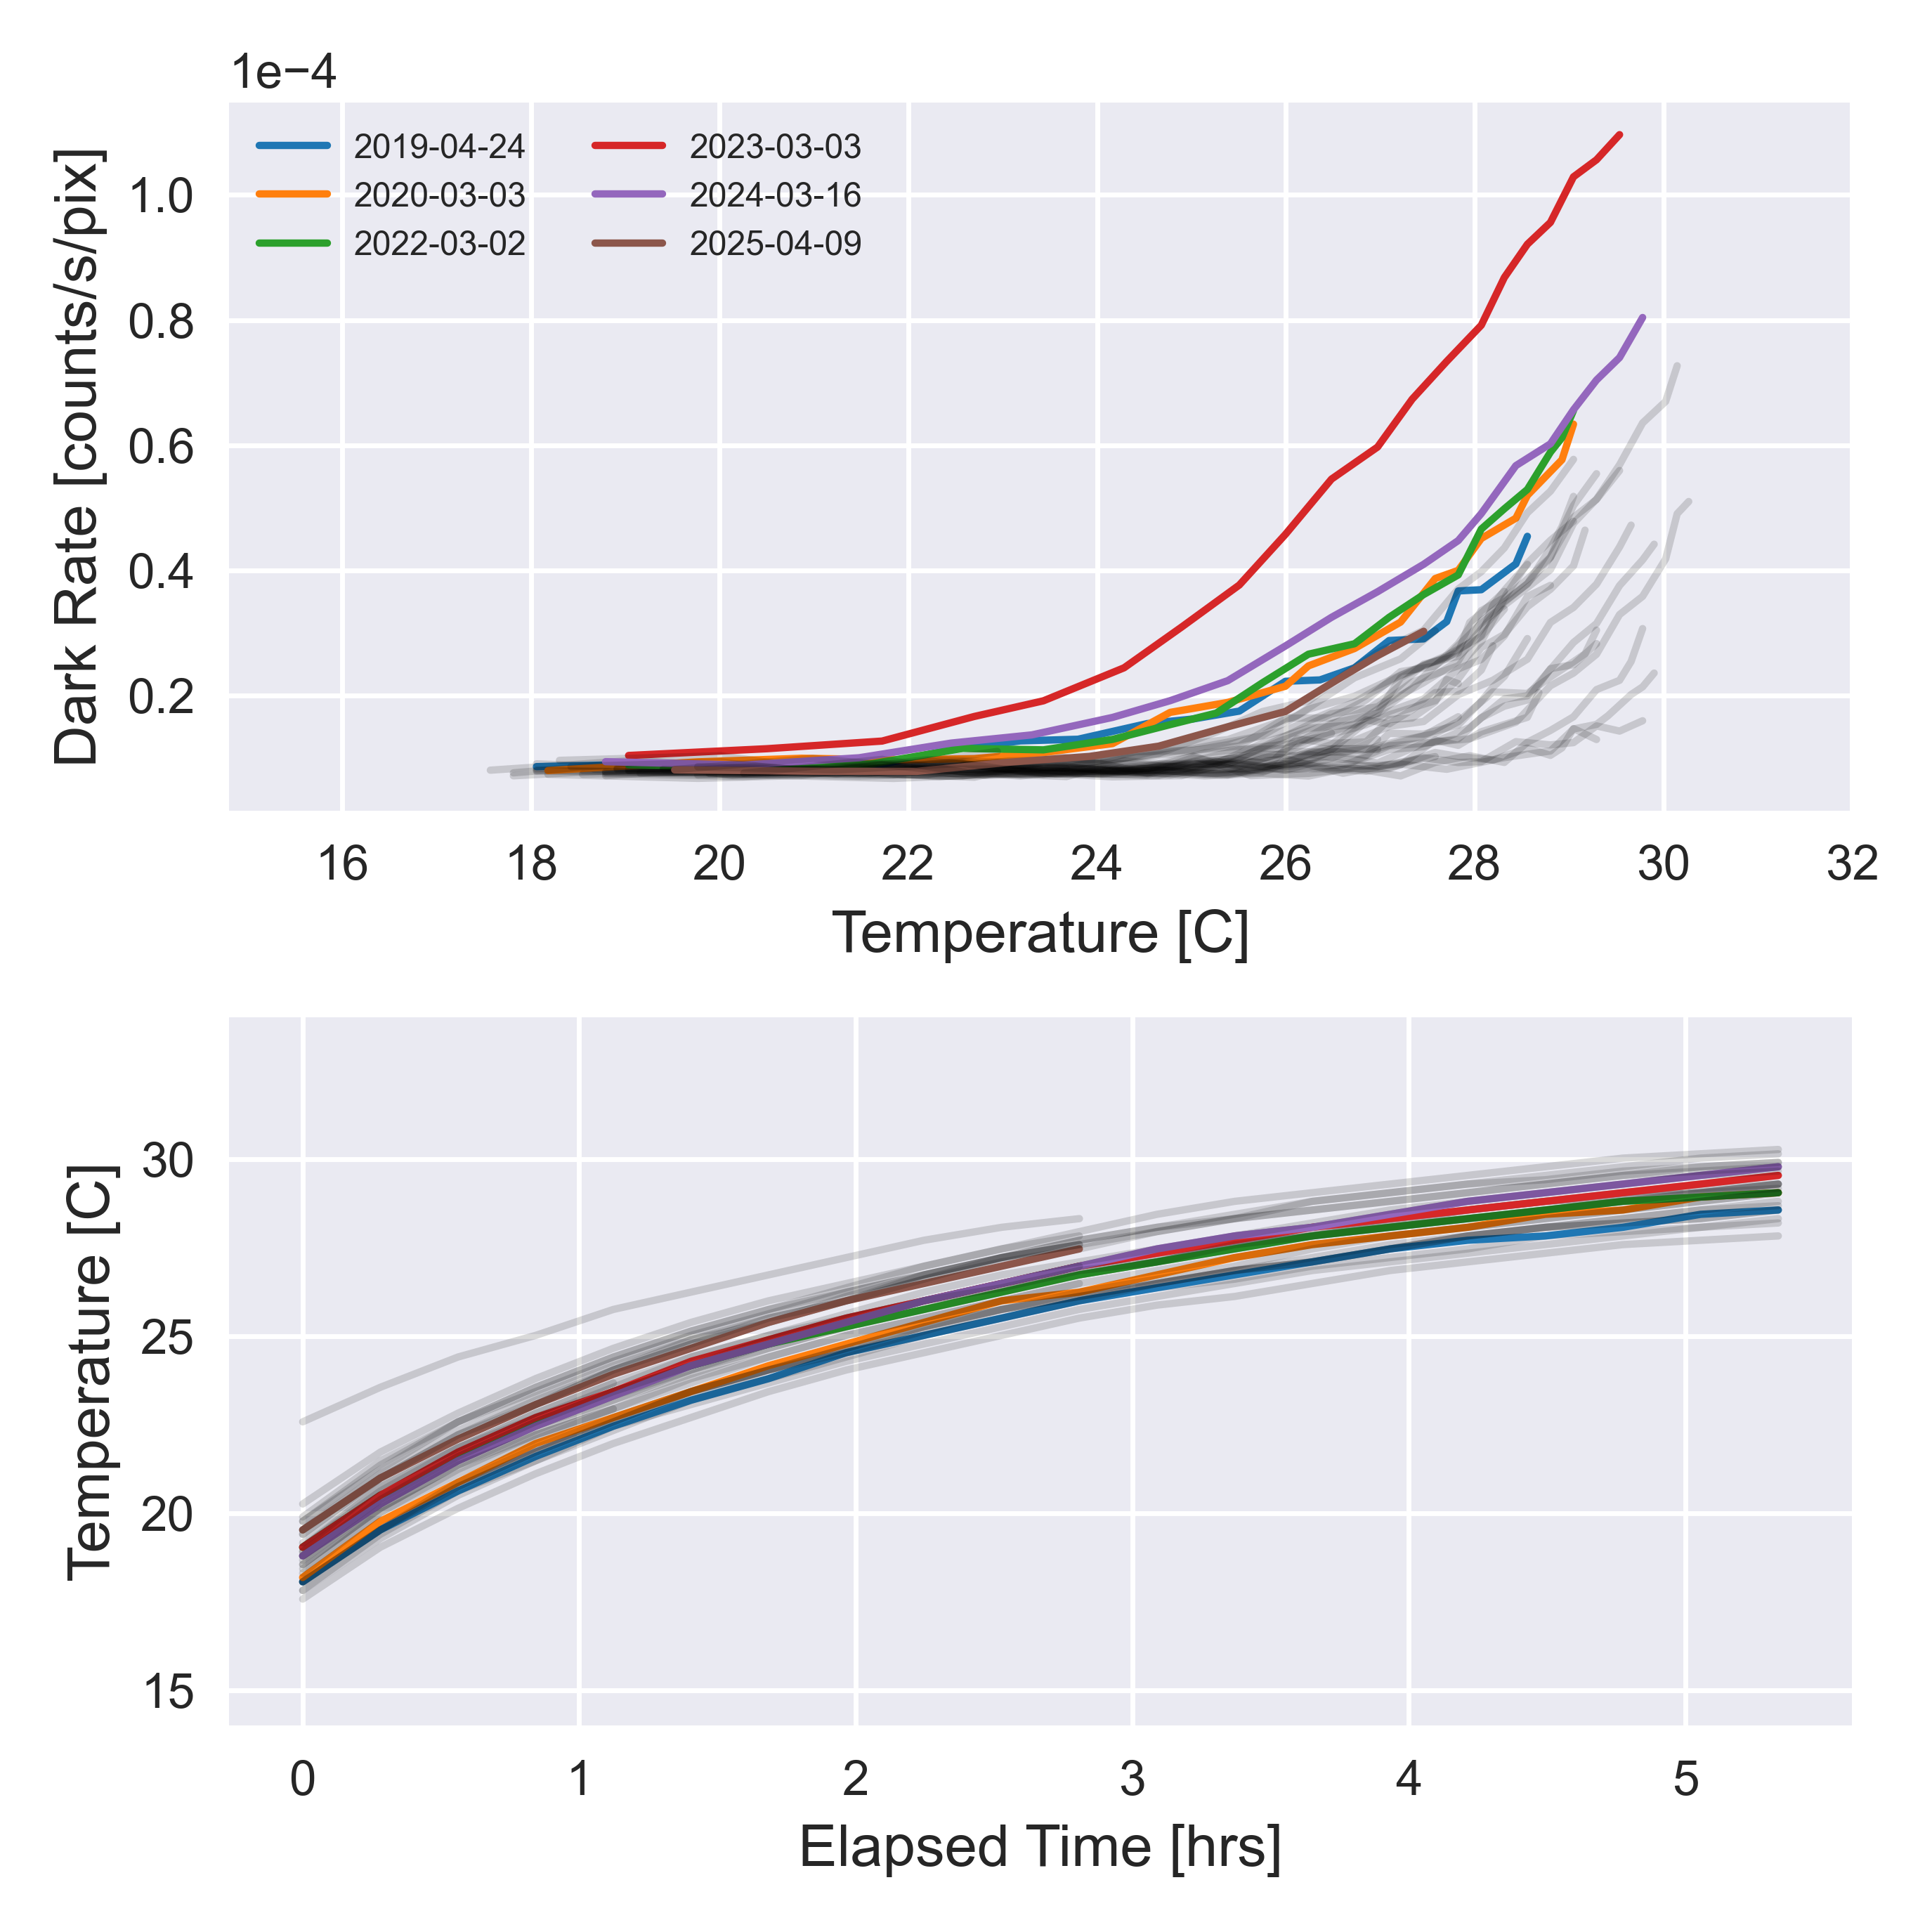
Top panel shows the dark rates vs. temperature measured from several dark rate monitoring programs. The bottom panel shows how the temperature changed from the time the instrument was turned on until the end of the observations. The gray lines are from data taken before 2019.
4.3.2 CCD Hot Pixels
When pixels are damaged by radiation or other causes, they can suffer enhanced dark current. Such pixels are called hot pixels. Although the increase in the mean dark current with proton irradiation is important, of greater consequence to detector calibration is the large increase in dark current non-uniformity (see Table 4.4.)
The pixels with enhanced dark current have been classified into two categories: warm and hot pixels. The definition of "warm" and "hot" pixel is somewhat arbitrary, and there have been several changes to the definition of warm and hot pixels throughout the lifetime of ACS. The values associated with these flags over time are summarized in Table 4.5. A pixel above 0.14 e¯/pixel/second is considered a "hot" pixel. A pixel below the hot pixel range but above 0.06 e¯/pixel/second is considered a "warm" pixel. This change in definition was made after the addition of post-flash to the dark calibration images, which partially alleviates effects of CTE (ACS ISR 2015-03). The new values were chosen by comparing the hot and warm pixel percentages found in the years following SM4. For consistency, all archived WFC data products were updated in early 2018 to use the current warm and hot pixel definitions.
Warm and hot pixels accumulate as a function of time on orbit. Defects responsible for elevated dark rate are created continuously as a result of the ongoing radiation damage on orbit. The reduction of the operating temperature of the WFC CCDs in 2006 dramatically reduced the dark current of the hot pixels, but over time the values have continued to rise. The smoothing effects of CTE have also increased the difficulty of accurately measuring dark current as CTE trail profiles become more significant over time.
Table 4.4: Creation Rate of New Warm, Hot, and Unstable Pixels (% of Detector Per Year)
| Pixel Type | WFC (–81 °C) |
|---|---|
| Warm Stable (0.06 - 0.14 e–/pix/sec) | 0.16 |
| Hot Stable (0.14 - 20 e–/pix/sec) | 0.10 |
| Total Unstable | ~0 |
Table 4.5: Hot and Warm Pixel Flags Over the History of ACS
Dates | Warm pixel flag (e–/s) | Hot pixel flag (e–/s) |
|---|---|---|
Launch - Oct 8 2004 | Not used | Static hot pixel list |
Oct 8 2004 - Jan 2007 (Pre SM4) | 0.02 - 0.08 | ≥0.08 |
May 2009 (SM4) - Jan 15 2015 | 0.04 - 0.08 | ≥0.08 |
Jan 15 2015 - present | 0.06 - 0.14a | ≥0.14a |
a In 2018, the ACS team re-calibrated all historical WFC observations to use the same warm and hot pixel thresholds of 0.06 and 0.14 e-/s, respectively
Like other CCDs on HST, the ACS devices undergo a monthly annealing process. The CCDs and the thermal electric coolers are turned off and the heaters are turned on to warm the CCDs to ~19°C. Although the annealing mechanism at such low temperatures is not yet fully understood, after this "thermal cycle" the population of hot pixels is reduced (see Figure 4.11). The anneal rate depends on the dark current rate; very hot pixels are annealed more easily than warm pixels. As seen in ACS ISR 2020-05, anneal efficacy in the WFC varies over time, with about 1-4% of hot pixels healed after each anneal. This value was around 14% for HRC.
Annealing has no effect on the normal pixels that are responsible for the increase in the mean dark current rate. Such behavior was also seen with STIS and WFC3 CCDs during ground radiation testing. Since the anneal cycles do not repair 100% of the hot pixels, there is a growing population of permanent hot pixels (see Figure 4.11).
Figure 4.11: Hot Pixel Growth Rate for HRC and WFC
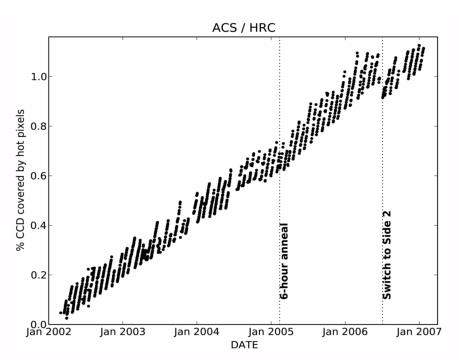
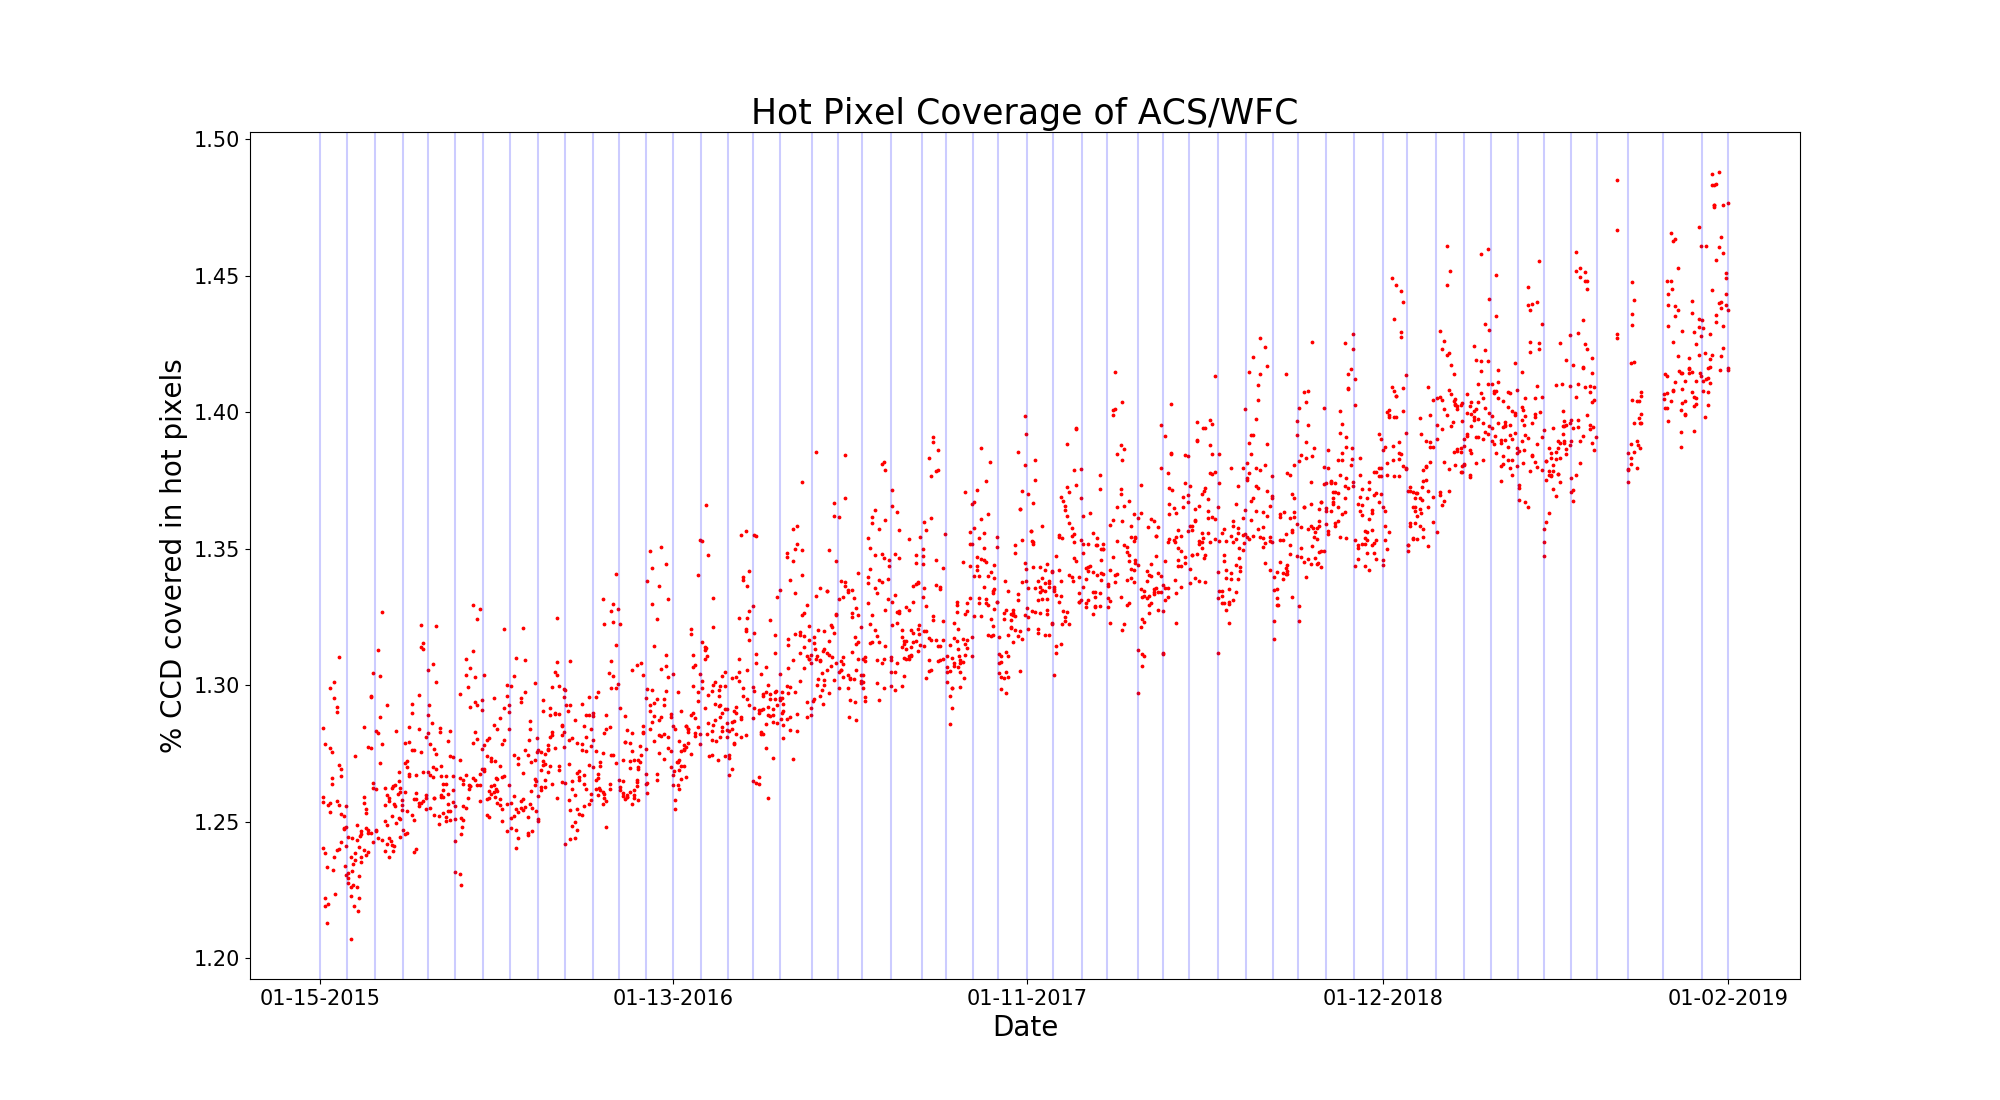
These figures show hot pixel growth rates (DQ flag 16) in the WFC and HRC. Top plot: The sawtooth patterns correspond to anneal cycles. For HRC, the growth rate increased slightly when the anneal duration was reduced from 12 hours to 6 hours–a slight drop coincided with the switch to Side 2 electronics. Bottom plot: Hot pixel growth rates in WFC over four-year period spanning 2015 to 2019 (ACS ISR 2020-05). Blue vertical lines indicate the occurrence of an anneal. Each data point uses the total hot pixel count from a single daily monitor dark frame to calculate percent hot pixel coverage.
4.3.3 Pixel Stability
In principle, warm and hot pixels should be eliminated by superdark subtraction. However, some pixels show a dark current that is not stable with time but switches between well-defined levels (see Figure 4.12, see also ACS ISR 2017-05). These fluctuations may have timescales of a few minutes and have the characteristics of random telegraph signal (RTS) noise.
Figure 4.12: ACS Pixel History
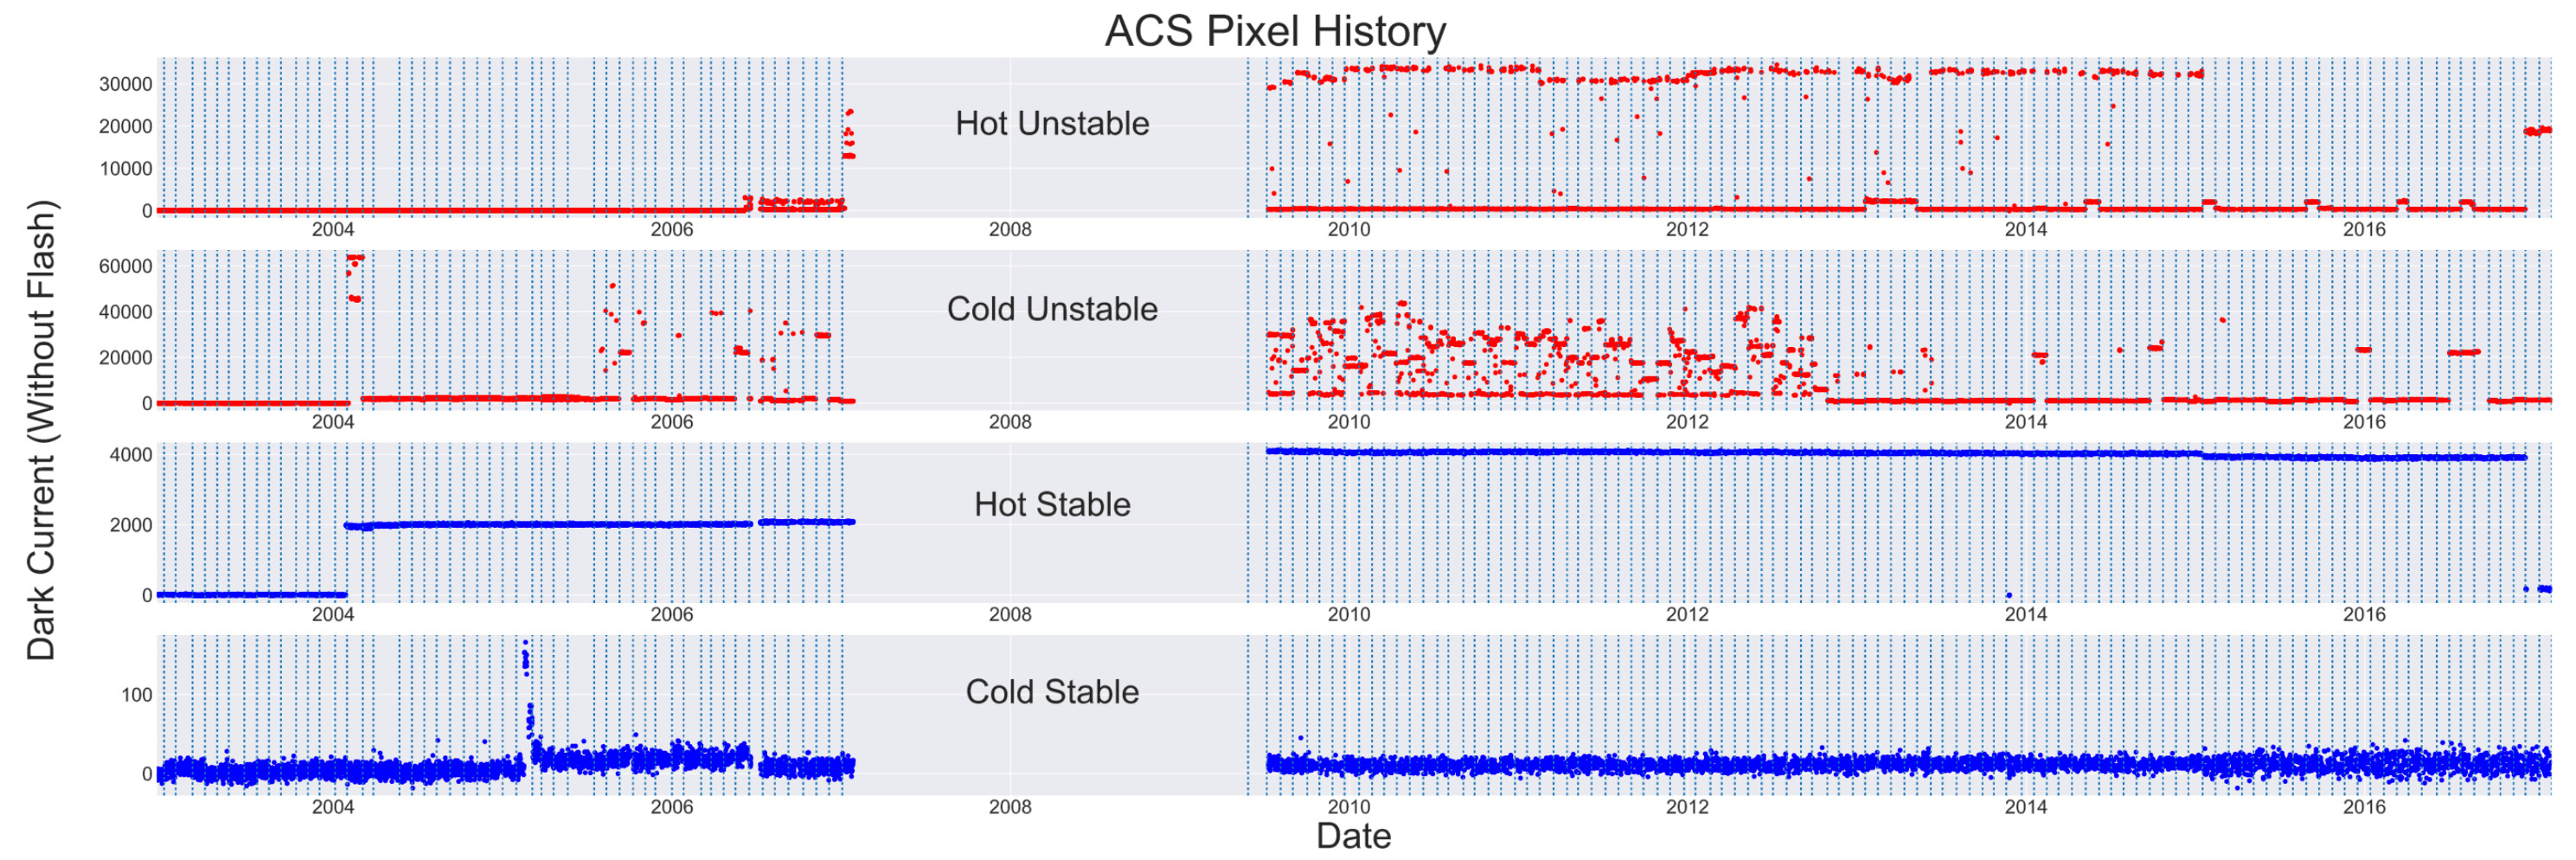
Examples of the four classifications of pixel stability in plots of dark current over the lifetime of ACS. Top panel: A pixel whose high average dark current (in electrons) which varies strongly between exposures, now identified as a hot, unstable pixel. Top middle panel: An unstable pixel with normal average dark current, now identified as a cold, unstable pixel. Bottom middle panel: A hot pixel which varies very little between exposures, now identified as a hot, stable pixel. Bottom panel: A cold, stable pixel. Vertical lines are anneal boundaries. The gap in the center is when ACS was inoperable due to electronics failure.
| f = \frac{\mathrm{Var}(\mathrm{SCI}) - \mathrm{Mean}(\mathrm{ERR^2})}{\mathrm{Mean}(\mathrm{SCI})} + 1, |
and where SCI and ERR are the values of that pixel in the SCI and ERR extensions, respectively, in all of the dark images taken during the anneal cycle. Pixels with f values above above a certain threshold are considered unstable. Prior to January 2025, when the calibration dark images for WFC had exposure times of 1000.5s, the threshold was
| f_{\mathrm{threshold}} = 75\mathrm{Mean}(\mathrm{SCI})^{-0.75} + 2 |
As of January 2025, calibration dark images were shortened to 650.5s to reduce the size of the CCD Daily Monitor calibration program (ACS TIR 2025-011). The new threshold for instability is
| f_{\mathrm{threshold}} = 55\mathrm{Mean}(\mathrm{SCI})^{-0.75} + 1.5. |
In addition, a number of hot pixels have dark rates that decrease with exposure time, i.e., they fade during an exposure. This effect becomes significant for dark rates above 20 e-/pix/s, such that these fading hot pixels cannot be properly dark-corrected (ACS ISR 2022-07). These pixels are also considered unstable, though they exhibit a different kind of instability than pixels with RTS fluctuations.
The vast majority of hot pixels are stable over an anneal cycle. A recent accounting has found that ~0.2% of WFC pixels are unstable. Figure 4.13 shows the prevalence of unstable pixels of various dark current levels over the lifetime of ACS/WFC. The total unstable pixel number has remained quite constant over time.
The superdarks for each anneal include flags of value 32 in their DQ extensions at the locations of unstable pixels (including fading hot pixels). The calacs pipeline propagates this information into the science images it processes. Therefore, instead of discarding all hot pixels during image combination, stable hot pixels can be retained and their noise propagated into the ERR extensions of each image. An appropriate dither strategy between exposures is nevertheless recommended.
Figure 4.13: Evolution of Pixel Types in ACS/WFC
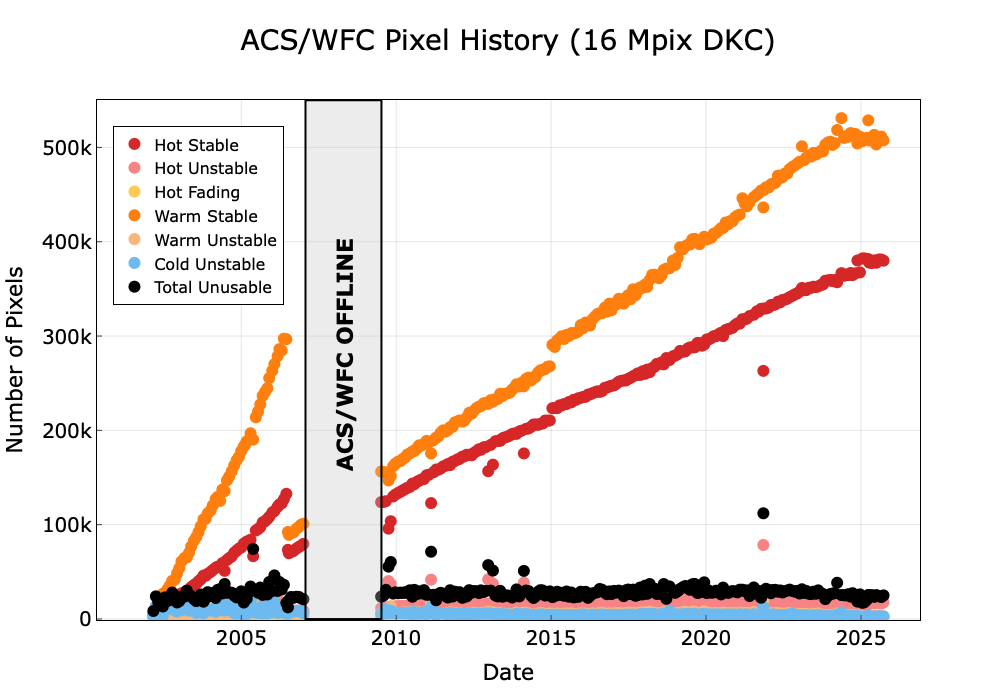
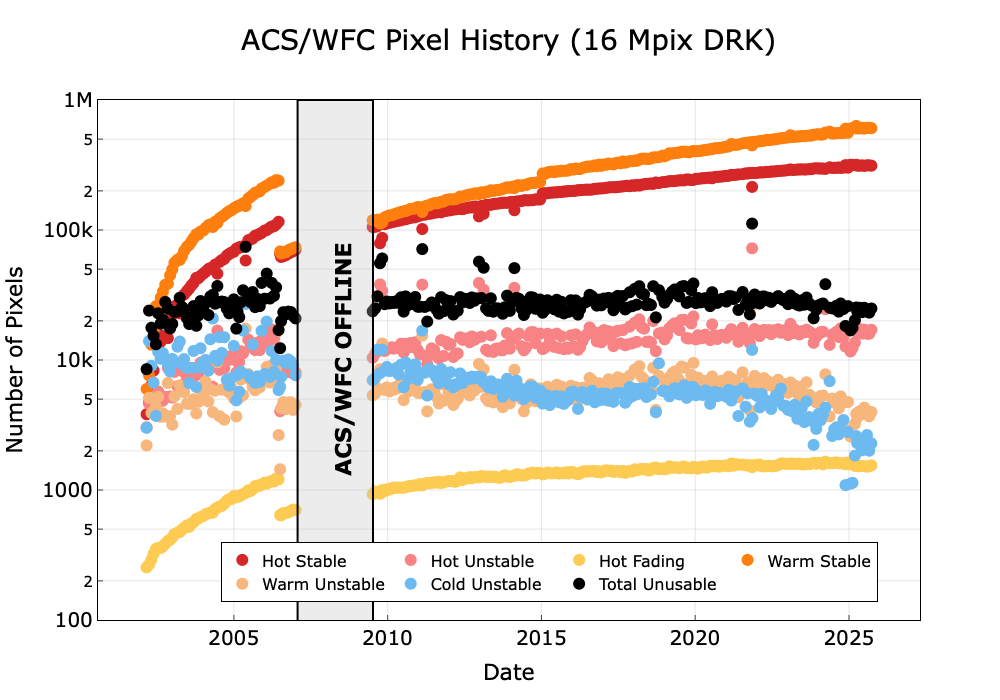
The populations of warm, hot, and unstable pixels in the WFC CCDs over their operational lifetime as measured from the monthly CTE-corrected superdarks, plotted both linearly (top) and logarithmically (bottom). The sudden decrease in stable hot pixels in mid-2006 is attributed to the temperature change from -77 ºC to -81 ºC, which coincides with the switch to the Side 2 electronics. The small increase in stable hot pixels in early-2015 is the result of better CTE loss correction due to post-flashing dark images. Fading hot pixels are best highlighted in the logarithmic plot, their numbers gradually increasing in a similar manner to stable hot pixels. The population of unstable pixels remains relatively steady over the history of ACS.
4.3.4 Sink Pixels
Sink pixels are certain pixels in a CCD detector that are anomalously low compared to the background. This is likely due to the presence of a significant number of charge traps in the pixel. A study of the sink pixels present in the WFC detector is presented in ACS ISR 2017-01. Charge traps prevent some of the pixel's photo electrons from being shifted out of that pixel when it is parallel-shifted to the readout register. Sink pixels can also trap electrons from pixels that are transferred through them during the readout process, giving rise to a trail of low values upstream of the warm pixel. The apparent length of the trail depends on the background level of the image, as shown in Figure 4.14. In addition, about 30% of the time in WFC, a charge excess is found in the pixel immediately downstream of the sink pixel (i.e., closer to the amplifier).
Sink pixels and the pixels they affect (both those above and those below the sink pixel) are identified in the average post-flashed 0.5-second WFC dark image from each monthly anneal cycle, which have been available since January 2015. One sink pixel reference image (snk.fits) is produced for each anneal and is used by calacs to flag sink pixels and the pixels they affect with the value 1024 in the DQ extension of WFC science images. All WFC images observed after January 1, 2015 are flagged for sink pixels by calacs. About 0.3-0.5% of pixels in the WFC detector are considered sink pixels in a given anneal. Depending on the background level of an image, 1–3% of pixels will be flagged with the value 1024 in its DQ extension (ACS ISR 2017-01).
Figure 4.14: Flash-Subtracted Short Dark
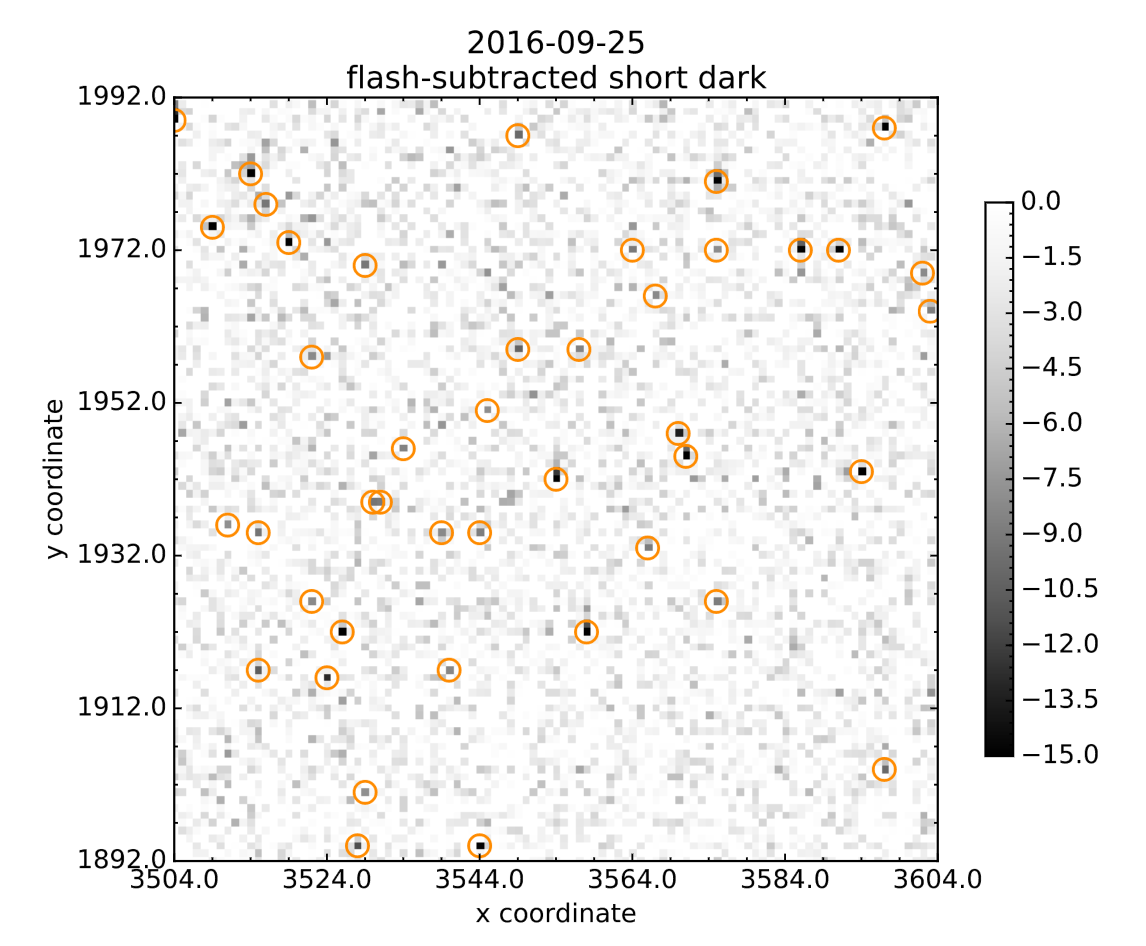
A 100 × 100 pixel2 region in the flash-subtracted short dark for the 2016-09-25 anneal cycle centered on a deep sink pixel with a trail extending towards the top of the image. Trails are visible following some of the other sink pixels, but many appear to be individual pixels.
4.3.5 Cosmic Rays
Like all HST cameras before it, the ACS HRC and WFC images are heavily peppered by cosmic rays in even the shortest of exposures. For full orbit integrations, approximately 5% of the pixels receive significant charge from cosmic rays via direct deposition or from diffusion from nearby pixels. Great care must be taken in planning and analyzing HST ACS observations to minimize the impact of cosmic rays on science images.
Some science observations require a careful consideration of individual cosmic ray events. To either remove cosmic rays or distinguish them from astrophysical sources, users might consider the distributions of observed cosmic ray fluxes, sizes, anisotropies, and the number of impacted pixels per event.
Fractional Coverage
For most users of the HRC and WFC, the most important characteristic of cosmic rays is simply the fraction of pixels they impact. This number provides the basis for assessing the risk that the target(s) in any set of exposures will be compromised. For ACS the observed rate of cosmic ray impacts on an individual frame varies by a factor of two depending on the proximity of the spacecraft to the confluence of the Earth's magnetic field lines (e.g., the South Atlantic Anomaly). For a 1000 second exposure, the fraction of pixels directly affected by cosmic rays (in non-SAA passages) varies between 1.5% and 3%. This fraction is the same for the WFC and HRC despite their factor of two difference in pixel areas because the census of affected pixels is dominated by charge diffusion, not direct impacts. This fraction is also consistent with what was observed for WFPC2.
For most science observations, a single "CR-SPLIT" or dither (i.e., two exposures) is sufficient to ensure that measurements of the targets are not compromised by cosmic rays. Both dithering and CR-splitting observations mitigate the impact of cosmic rays, but dithering also mitigates the impact of hot pixels and PSF undersampling. For this reason, dithering is preferred over CR-splitting. More consideration is required for survey-type observations with WFC, a bonafide survey instrument. Observers seeking rare or serendipitous objects as well as transients may require that every single WFC pixel in at least one exposure among a set of exposures is free from cosmic ray impacts. For the cosmic ray fractions of 1.5-3% in 1000 seconds, a single ~2400 second orbit must be broken into four dithered exposures of 500 to 600 seconds each to reduce the number of un-cleanable pixels to one or fewer.
Electron Deposition
The flux deposited on the CCD from an individual cosmic ray does not depend on the energy of the cosmic ray, but rather the distance it travels in the silicon substrate. An analysis of 13,311 WFC darks and 5,477 HRC darks demonstrates that the interaction of high energy cosmic rays with the silicon substrate has a very well-defined distribution (Miles et al. 2021). The peak of the distribution occurs at ~1000 electrons and the distribution has a clear cut-off below ~500 electrons (see Figure 4.15).
A useful characteristic of the deposition distribution is its well-defined minimum; e.g., multi-pixel events that have an apparent magnitude of 25th or fainter in a 500 second broad-band exposure are unlikely to be caused by cosmic rays. Such information can help with the removal of false positives from searches for faint transients (e.g., high-redshift SNe).
Figure 4.15: Electron Deposition by Cosmic Rays Normalized by the Number of Counts in the Peak Bin
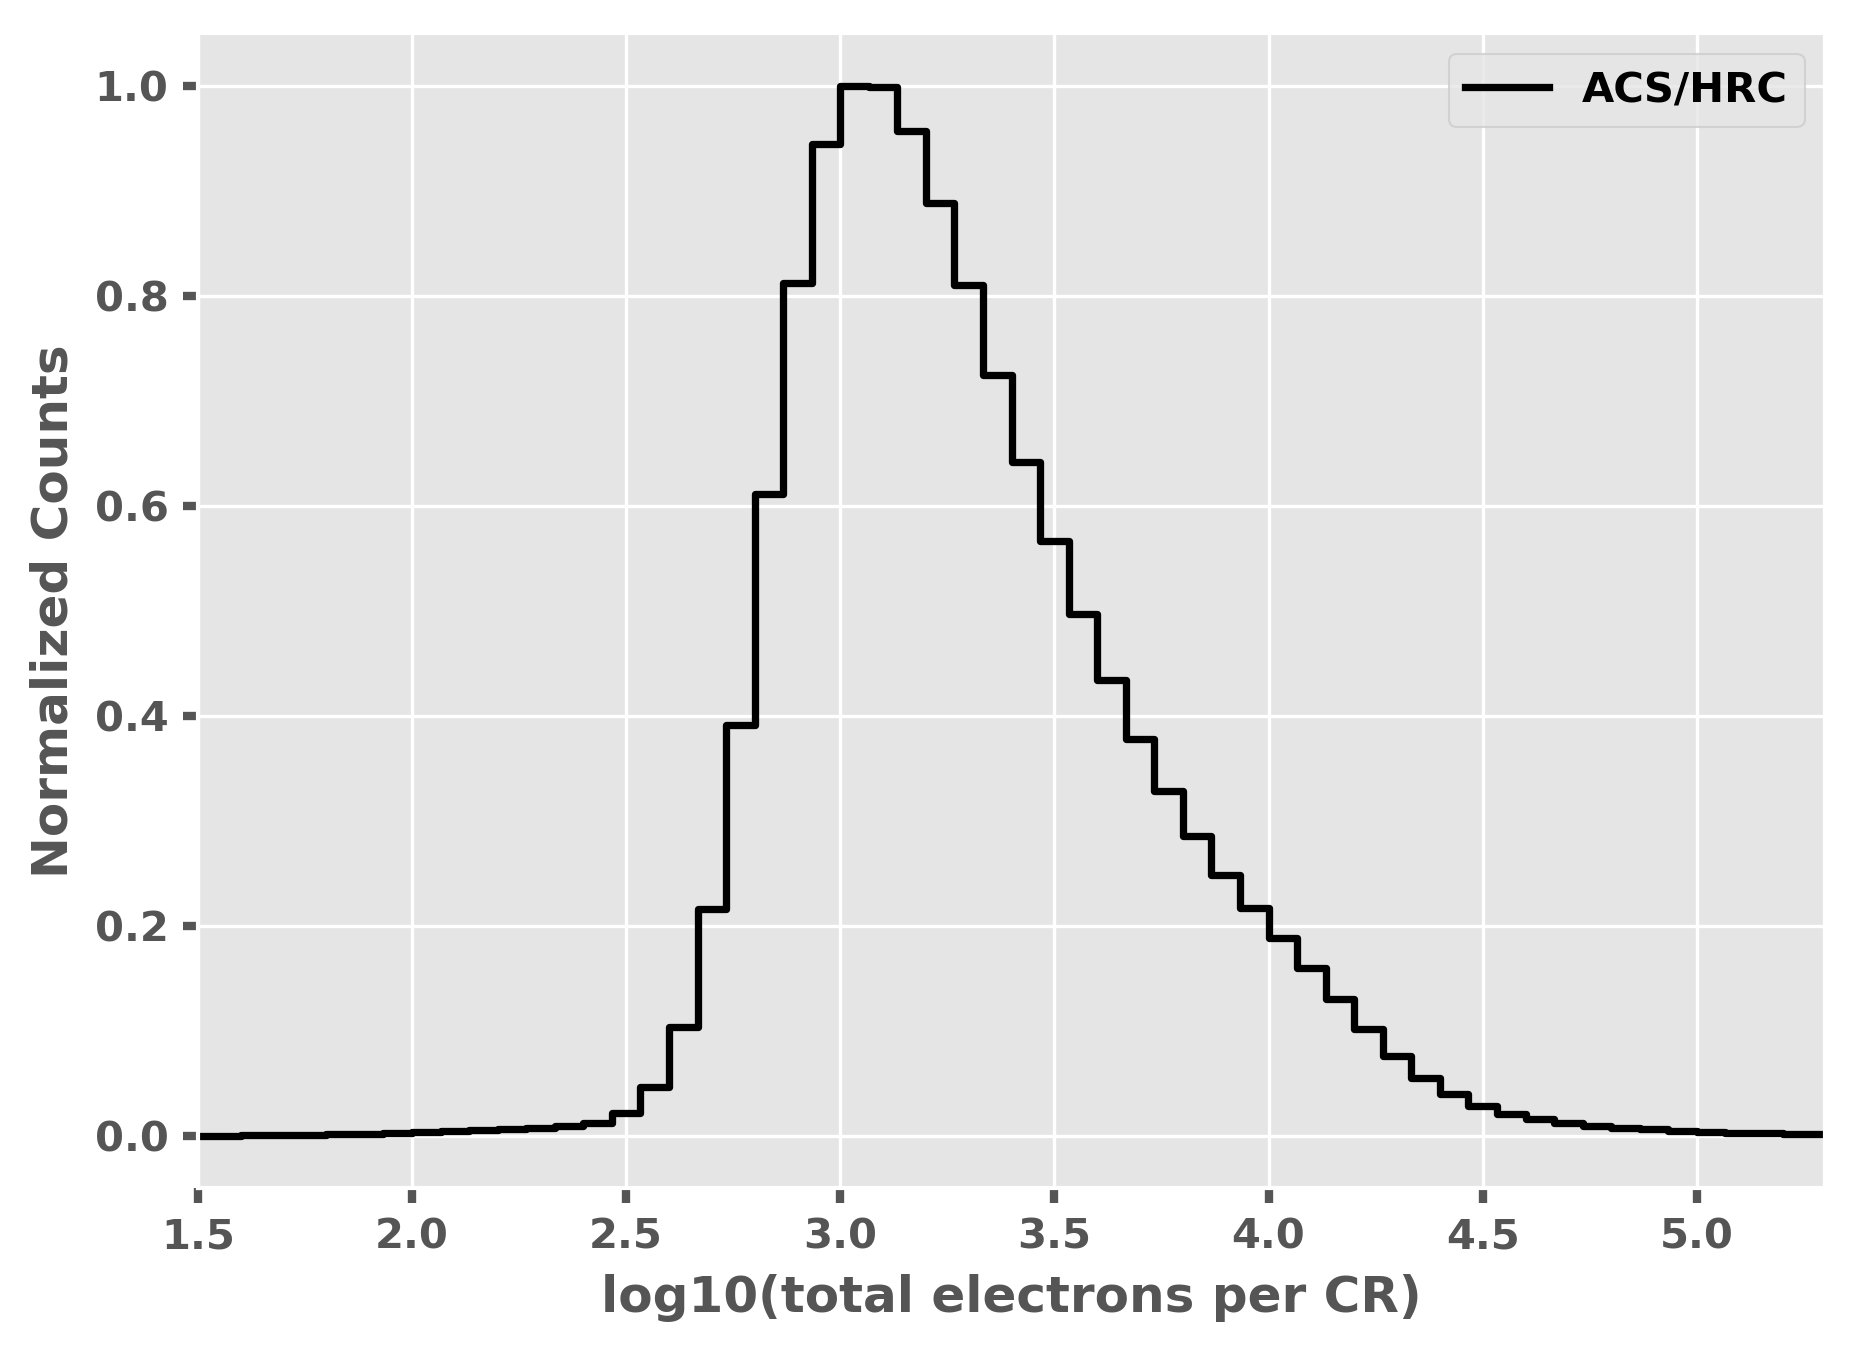
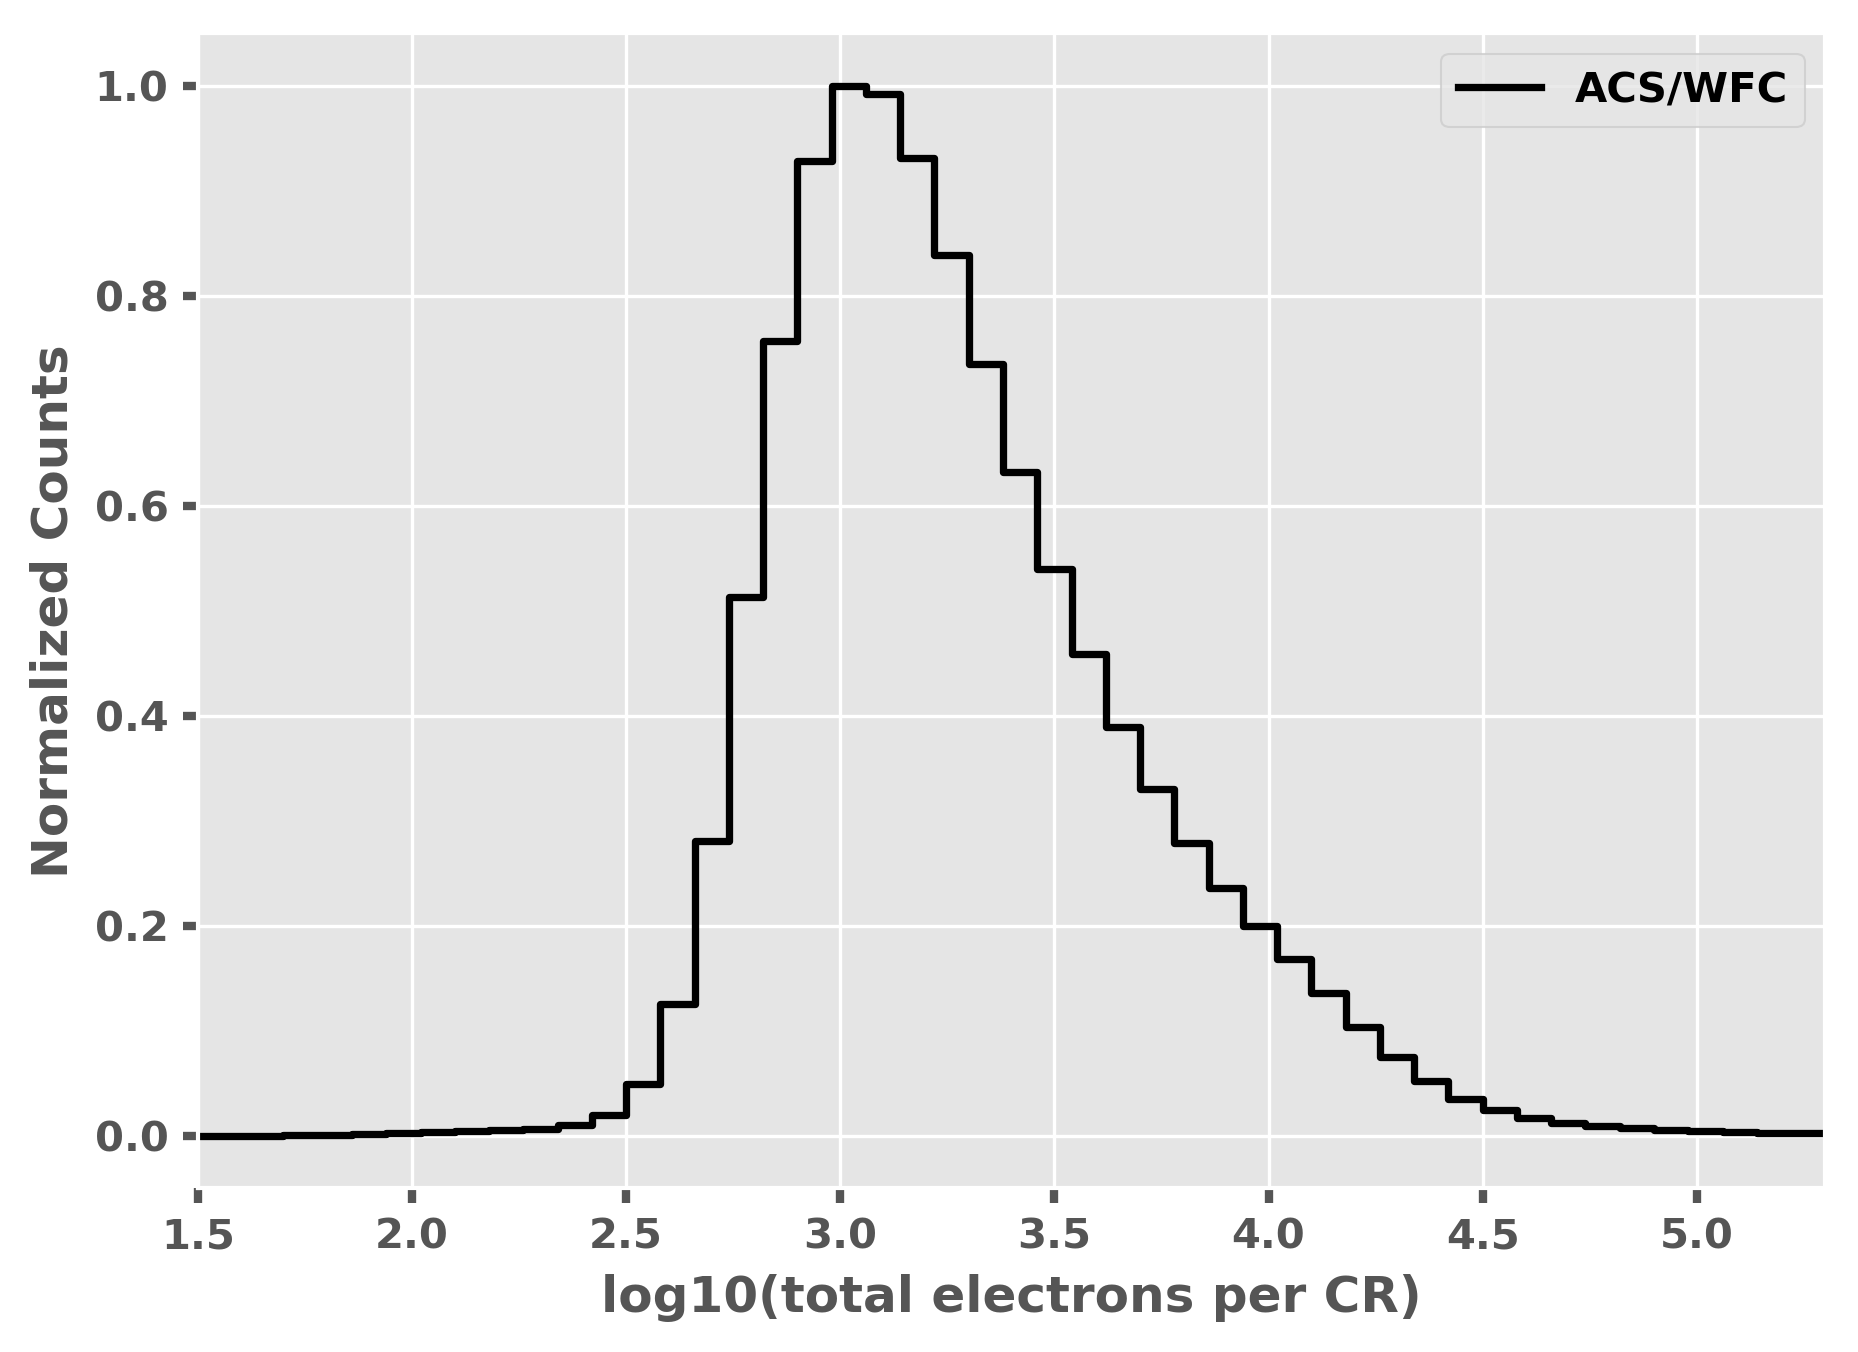
A minimum deposition of ~500 e¯ is seen corresponding to cosmic rays with normal incidence. The median deposition is ~1000 e¯. Top plot shows cosmic ray deposition for HRC, bottom plot shows WFC.
Attached Pixels
As seen in Figure 4.16, for HRC and WFC, the salient features of electron deposition are a strong peak in the distribution function at four to five pixels, with a median of seven pixels for HRC and nine pixels for WFC (Miles et al. 2021). On the smaller side there is a sharp decline in events. Although a few events are seen that encompass only one pixel, examination of these events indicate that at least some and maybe all of these sources are actually transient hot pixels or unstable pixels, which can appear hot in one exposure (with no charge diffusion) and normal in the next. There is a long tail in the direction towards increasing numbers of attached pixels. Some of these are likely due to two individual events associated by their chance superposition, but more are from oblique incidence cosmic rays that skim the surface of the CCD leaving a long trail (which is wider near the surface). Unfortunately the number of attached pixels is not a very useful characteristic to distinguish cosmic rays from unresolved astrophysical sources.
Figure 4.16: Distribution of the Number of Pixels Associated with a Single Cosmic Ray Event for the HRC (Top) and WFC (Bottom)
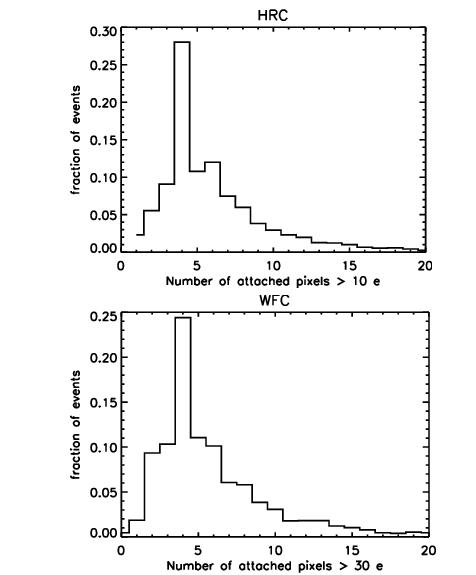
Some bias exists for events with more than six pixels, which may be composed of two events with chance superposition. This distribution does not account for possible charge trails left by the CTE deterioration of WFC.
1 Technical Instrument Reports (TIRs) are available upon request.