1.1 Instrument Design and Capabilities
HRC has been unavailable since January 2007. Information about the HRC is provided for archival purposes.
The Hubble Space Telescope (HST) Advanced Camera for Surveys (ACS) was designed for deep, visible to near-IR imaging and spectroscopic surveys using its Wide Field Channel (WFC), near-UV to near-IR imaging and coronagraphy with its now-defunct High Resolution Channel (HRC), and far-UV imaging and spectroscopy using its Solar Blind Channel (SBC). The WFC's discovery efficiency (i.e., the product of its field of view and throughput) is 10 times greater than that of WFPC2. The failure of ACS's charge-coupled devices' (CCD) electronics in January 2007 halted its near-UV to near-IR science capabilities until Servicing Mission 4 in May 2009, during which the WFC's functionality was fully restored. Unfortunately, the HRC was not recovered.
ACS comprises three channels, each optimized for specific goals:
- Wide Field Channel (WFC)
- 202 × 202 arcsecond imaging field of view from 3500 Å–11,000 Å
- 47% peak efficiency at ~6700 Å (including Optical Telescope Assembly)
- ~0.049 arcsec/pixel with critical sampling at 11,600 Å
- Low resolution (R ~100) wide-field slit-less (grism) spectroscopy from 5500 Å–11,000 Å
- Polarimetric imaging with relative polarization angles of 0°, 60°, and 120°
- Slit-less (grism) spectropolarimetry from 5500 Å–8000 Å
- High Resolution Channel (HRC) [before January 2007]
- 29 × 26 arcsecond imaging field of view from 1700 Å–11,000 Å
- 29% peak efficiency at ~6500 Å
- ~0.028 x 0.025 arcsec/pixel with critical sampling at 6300 Å
- Low resolution (R ~100 @ 2000 Å) spectroscopy from 2000 Å–4000 Å
- Aberrated-beam coronagraphy from 2000 Å–11,000 Å with 1.8 arcsecond and 3.0 arcsecond diameter occulting spots
- Polarimetric imaging with relative polarization angles of 0°, 60°, and 120°
- Solar Blind Channel (SBC)
- 35 × 31 arcsecond imaging field of view from 1150 Å–1700 Å
- 8.5% peak efficiency at ~1260 Å
- 0.034 × 0.030 arcsec pixels provide a good compromise between resolution and field of view
- Low resolution (R ~100 @ 1216 Å) spectroscopy from 1150 Å–1700 Å
The WFC's high sensitivity and large field of view make it the preferred HST detector for deep imaging programs at red and near-infrared wavelengths. By oversampling the HST PSF at λ > 6000 Å, the HRC was especially useful for high precision photometry in stellar population studies before its failure in January 2007. The HRC's coronagraph was used for detection of circumstellar disks and QSO host galaxies.
1.1.1 Detectors
ACS employs different large-format detectors in each channel:
- The WFC detector is a mosaic of two 2048 × 4096 Scientific Imaging Technologies (SITe) CCDs.
- The HRC detector is a single 1024 × 1024 SITe CCD.
- The SBC detector is a single CsI micro-channel plate (MCP) with a multi-anode microchannel array (MAMA) readout.
The WFC and HRC CCDs are thinned, backside-illuminated devices regulated by thermoelectric coolers and sealed in evacuated dewars with fused silica windows. The spectral response of the WFC CCDs is optimized for imaging at visible to near-IR wavelengths. The wavelength coverage of the HRC's CCD was similar to that of the WFC, but its spectral response was optimized for near-UV wavelengths. As with all CCD detectors, there is read noise associated with clocking and sampling the collected charge in each pixel through the output amplifiers. The dynamic range of CCD images is determined by the read noise and the depth of the pixel well (~77,000 e¯ for WFC and ~155,000 e¯ for HRC), which determines the saturation limit of any one pixel. Hot pixels and cosmic rays affect all ACS CCD exposures.
All ACS detectors produce a time-integrated image in the ACCUM data mode. The HRC also had a target-acquisition mode for coronagraphic observations. The minimum exposure time for WFC is 0.5 seconds and for HRC was 0.1 seconds. WFC and HRC observations are typically split into multiple dithered exposures to allow removal of hot pixels and cosmic rays in post-observation data processing.
The SBC MAMA is a photon-counting detector that provides two-dimensional imaging optimized for far-UV wavelengths. The SBC is operated only in ACCUM mode. SBC observations are subject to both scientific and absolute brightness limits. At high local (>= 50 counts sec–1 pixel–1) and global (> 200,000 counts sec–1) illumination rates, counting becomes nonlinear in a way that is not correctable. At slightly higher illumination rates, MAMA detectors can be permanently damaged. Lower absolute local and global count rate limits have been imposed that define bright object screening limits for each SBC configuration. Targets that violate these screening limits cannot be observed in the proposed configuration.
1.1.2 Optical Design
ACS has two main optical channels, one dedicated to the WFC and one shared by the HRC and the SBC. These channels are shown in Figures 3.2 and 3.3 of the ACS Instrument Handbook. Each channel has independent corrective optics to compensate for HST's spherical aberration. The WFC has three optical elements coated with silver to optimize visible light throughput. The silver coatings absorb wavelengths shortward of 3700 Å. WFC shared two filter wheels with the HRC, which enabled internal WFC/HRC parallel observing for some filter combinations.
The HRC/SBC optical chain comprises three aluminized mirrors overcoated with MgF2. The HRC was selected by inserting a plane fold mirror into the optical path so that the beam was imaged on the HRC's detector through the WFC/HRC filter wheels. The SBC is selected by moving the fold mirror out of the beam and allowing light to pass through the SBC filter wheel onto the SBC detector. The aberrated beam coronagraph was deployed with a mechanism that inserted a window with two occulting spots at the aberrated telescope focal plane and an apodizer at the re-imaged exit pupil. For health and safety reasons, use of the coronagraph with SBC is forbidden.
1.1.3 Geometric Distortion
ACS's focal planes exhibit significantly more geometric distortion than those of previous HST instruments. This distortion is principally caused by ACS's optical design, which has a minimal number of components for correcting the spherical aberration induced by the Optical Telescope Assembly (OTA) without introducing coma. The optics allow high throughput, but their focal surfaces are far from normal to the principal rays. The WFC detector is tilted by 22°, so its projected diagonals differ by 8%. The HRC and SBC detectors are tilted by 25°, so their projected diagonals differ by 12%. Consequently, the projected footprints of the detectors on the sky are rhomboidal rather than square, and the pixel scales are smaller along the radial direction of the OTA field of view than along the tangential direction. The angles between the projected x- and y-axis of the detectors are 84.9° for WFC1, 86.1° for WFC2, and 84.2° for HRC.
Figure 1.1 shows the locations of the WFC and HRC apertures in HST's V2/V3 reference frame, the rhomboidal projections of each detector, and the locations of the four readout amplifiers (A, B, C, and D) for each channel. A telescope roll angle of zero degrees corresponds to an on-sky view with the V3 and V2 axes aligned north and east, respectively. The orientations of the physical edges of the detectors are approximately parallel with the V2 and V3 coordinate axes of the telescope, but the eigenaxes of the pixel scale transformation of the WFC are along the projected diagonals of the detectors. The situation is even more irregular for the HRC and SBC because the aperture diagonals do not lie along a radius of the OTA field of view. Moreover, the scale and area of WFC pixels vary by ~10% and ~18%, respectively, from corner to corner. For HRC and SBC, the pixels vary in scale by only ~1% from corner to corner because these detectors have smaller fields of view.
The distorted pixel scales and areas must be corrected before astrometry of ACS images is performed. To perform photometry, the pixel areas must be corrected using pixel area maps (See Section 5.1.3) or the distortion must be corrected using the DrizzlePac software.
Figure 1.1: WFC and HRC Apertures Compared with the V2/V3 Reference Frame
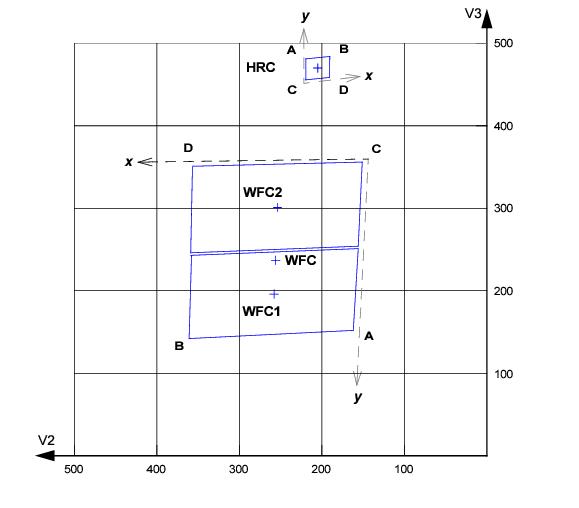
The readout amplifiers (A,B,C,D) are indicated on the figure. When ACS images are processed through AstroDrizzle in the DMS1 data pipeline, the resulting drizzled images are oriented with their x,y axes corresponding approximately to the x,y axes shown in this diagram. Thus, the WFC data products are oriented so that WFC1 (which uses amplifiers A and B) is on top in the positive y-direction (also see Section 2.2), and the HRC images are oriented such that amplifiers A and B are at the top in this diagram.
1.1.4 ACS Performance after Servicing Mission 4
ACS suffered component failures in its Side 1 and Side 2 electronics in June 2006 and January 2007, respectively. Although the latter failure halted operations of the WFC and HRC cameras, the SBC was unaffected by either failure and remained operational throughout this problematic period. The WFC was recovered after the successful installation of a replacement CCD electronics box (CEB-R) and power supply during Servicing Mission 4 (SM4) in May 2009. Unfortunately, further damage to the HRC power harness in January 2007 prevented recovery of the HRC during SM4, so it remains unavailable for scientific use.
Tests conducted shortly after SM4 showed that:
- The read noise, linearity, pixel full well depth, and amplifier cross-talk of the restored WFC are as good as, or better than, the pre-failure levels (Table 1.1).
- WFC's dark current, hot pixel fraction, and charge transfer efficiency (CTE) have degraded to the levels expected after extended exposure to HST's trapped radiation environment.
- All WFC images exhibit low-level stripes caused by low frequency (1 mHz to 1 Hz) 1/f noise in the bias-reference voltage generated by the CEB-R. The stripes are constant along each row and span the CCD quadrant boundaries, but they are not stable from frame to frame. The stripes' contribution to the global noise is small (about 0.9 e¯), but the correlated nature of the noise may affect photometric precision for very faint sources. An algorithm for removing the stripes based on analysis of the pre-scan regions of the four WFC quadrants has been implemented in the bias-correction stage of calacs in the DMS data pipeline. Stripe removal is automatically performed only on full-frame (4096 × 4096 pixel) post-SM4 WFC images; it is not performed on subarray images. STScI provides a standalone routine (acs_destripe_plus, in the acstools package) for mitigating the stripes in subarray images of sparse fields. (See Example 5 in Section 3.5.2. More discussion on this is also found in Sections 3.2.1, 3.4.1, 3.4.2, 3.5.1, 3.5.2, 4.2.1, the ACS website, and the documentation for acstools.) For most observing programs, however, the stripes have a negligible effect on science results and their removal provides only cosmetic benefits.
- Bias frames obtained under default CEB-R operation show a 5–10 DN gradient spanning the rows and columns of each image quadrant. This bias gradient is stable over the time between consecutive calibration reference files (see ACS ISR 2025-03), so it is effectively removed during normal image reduction and processing.
- The default CEB-R mode induces a signal-dependent bias shift. The DC level of the CEB-R's dual-slope integrator is sensitive to changes in the CCD output voltage in such a way that the bias level is shifted positively by 0.02%–0.30% (depending on the amplifier) of the signal from the previously integrated pixel. This phenomenon is well understood for full-frame WFC images, and an automated correction has been implemented in the bias correction stage in calacs. This correction cannot be applied to post-SM4 WFC subarray images supported before Cycle 24, but it is applied to the 2K subarrays available from Cycle 24 onwards, as their readout timing is identical to WFC full-frames. It remains unavailable for 1K and 512 subarrays.
Table 1.1: Comparison of WFC Performance Before the Side 2 Failure and After SM4
Metric | January 2007 (pre-SM4) | May 2009 (post-SM4) | December 2025 (post-SM4) |
|---|---|---|---|
Read Noise (e¯ ; gain = 2) | 5.5 | 3.9–4.7 | 3.75-5.65 |
Dark Current (e−/pix/hr) | 10.7 | 20–25 | 53-65 |
Hot Pixels (%) | 0.68 | 1.1 | 2.38 |
Full Well Depth (e¯) | 84,000 | > 80,000 | 77,400±5,000 |
Non-linearity (%) | < 0.1 | < 0.2 | < 0.2 |
CTE (1620 e¯; EPER) | 0.999949 | 0.99989 | 0.99967 |
Cross-talk (50K e¯ source) | 4 × 10⁻⁵ | (5±4) x 10-5 | (5±4) x 10-5 |
1The Data Management System (DMS) is the name of the pipeline software that controls the processing and archiving of data at STScI, converting telemetry into FITS data products, populating the Archive catalog, and performing housekeeping on the pipelines. See Section 3.1 for more details.