4.7 Generic Detector and Camera Properties
HRC has been unavailable since January 2007. Information about the HRC is provided for archival purposes.
4.7.1 Gain Calibration
The ACS CCDs have default gain values of approximately 2 e¯/DN for both the WFC and HRC (prior to Cycle 14 the WFC default was 1 e¯/DN).
The default gain for the WFC samples the full well depth of the CCDs. However, for HRC the default gain=2 setting only samples 78% of the full-well depth. Use of the next higher gain value of approximately 4 e¯/DN for the HRC provided full sampling of the 165,000 e¯ full well depth.
ACS gain values in use between on-orbit installation (in March 2002) and January 2004 can be traced to ground test results. The primary tool for measuring absolute gain values is the photon-transfer method which is described by Janesick, J.R. (2001). This technique relies on analysis of pairs of identical exposure flat fields taken at a range of intensity levels. Over an ensemble of pixels at a given exposure level, the relation between differences of intensity values (noise) and the direct signal level depends on the read noise and the gain. This relation can be fit at a range of intensity levels to uniquely determine these two quantities. This technique can also provide limited information on linearity1 and the saturation count level2 by determining where the photon-transfer curve departs from linearity at high signal levels. Errors of about 0.6% in the absolute gain values were originally quoted for the WFC determinations, with similar values for the HRC.
On the WFC, with two CCDs and the default use of two readout amplifiers per CCD, errors of 0.6% in the normalization of gains would result in clear offsets in signal level from one quadrant to another. A re-determination of the WFC gains (ACS ISR 2002-03), maintaining the same mean over all amplifiers at a given gain setting but using a continuity constraint across quadrant boundaries, provided an improvement in amplifier-to-amplifier relative gains at better than 0.1% for the default gains. Any steps of intensity seen in data across quadrant boundaries are likely to reflect minor errors in bias and overscan values (see Section 4.2), rather than errors in relative gains. New relative gain values were measured and are discussed in ACS ISR 2009-03.
As documented in ACS ISR 2004-01, on-orbit data was used to redetermine the mean absolute gain values relative to the standard adopted for the default gains on each camera. Through analysis of observations of the same stellar field, in the same filter and at the two gain settings, it is possible to obtain accurate adjustments of these gain values relative to the default gain levels. The errors decreased from 1% to 0.1% with this technique. Absolute gains were measured for the new electronics post-SM4 in ACS ISR 2011-04. and again found to be unchanged in ACS ISR 2018-06. However, recent work presented in ACS ISR 2023-02 found evidence for undiagnosed systematic effects in prior measurements of the absolute gain. They found that CTE-related effects and charge-diffusion processes combine to artificially inflate the previously measured absolute gain values, at the level of about 5%. On the other hand, they also found that the relative amp-to-amp gains are consistent with those in the current CCDTAB reference file.
Given these findings, absolute errors of about 5% could remain in the default gain values. These are of no real consequences because the regular CCD quantum efficiency redeterminations are based on data acquired with the default gains, and therefore compensate for any offsets. Basic photometric calibrations apply with equal accuracy to data acquired at all supported gains (assuming for the non-default gains that reprocessing was done after January 6, 2004 to include the revised values).
Tables 4.6 and 4.7 show the CCD gain values for pre-SM4 ACS operations, based on pre-launch and on-orbit calibrations. See Table 4.1 for current gain values.
Table 4.6: Pre-SM4 HRC Gain Values Based on Pre-Launch and On-Orbit Calibrations
Amplifier | GAIN | Prelaunch | On-orbit |
|---|---|---|---|
C | 4 | 4.289 | 4.235 |
C | 1 1 | 1.185 | 1.163 |
1 GAIN = 1 was "available but unsupported"
Table 4.7: Pre-SM4 WFC Gain Values Based on Pre-Launch and On-Orbit Calibrations
Amplifier | GAIN | Prelaunch | On-orbit |
|---|---|---|---|
A | 2 | 2.018 | 2.002 |
A | 4 1 | 4.005 | 4.011 |
B | 2 | 1.960 | 1.945 |
B | 4 1 | 3.897 | 3.902 |
C | 2 | 2.044 | 2.028 |
C | 4 1 | 4.068 | 4.074 |
D | 2 | 2.010 | 1.994 |
D | 4 1 | 3.990 | 3.996 |
1 GAIN = 4 was "available but unsupported"
4.7.2 Full Well Depth
Conceptually, full well depths can be derived by analyzing images of a rich star field taken at two significantly different exposure times, identifying bright but still unsaturated stars in the short exposure image, calculating which stars will saturate in the longer exposure and then simply recording the peak value reached for each star in electrons (using a gain that samples the full well depth, of course). In practice, as discussed in ACS ISR 2004-01 and ACS ISR 2020-02, it is also necessary to correct for a ~10% "piling-up" effect of higher values being reached at extreme levels of over-saturation relative to the value at which saturation and bleeding begins to neighboring pixels in the column.
Since the full well depth may vary over the CCDs, it is desired to have a rich star field observed at a gain that samples the full well depth, and for which a large number of stars saturate. Calibration programs have serendipitously supplied the requisite data of rich fields observed at two different exposure times.
High Resolution Channel
The HRC shows large scale variation of about 20% over the CCD. The smallest full well depth values are at about 155,000 e¯ and the largest at about 185,000 e¯, with 165,000 e¯ representing a rough estimate at an area-weighted average value. See Figure 3 of ACS ISR 2004-01 for details.
Wide Field Channel
As with the HRC, there is a real and significant large scale variation of the full well depth on the WFC CCDs. The variation over the WFC CCDs is from about 72,000 e¯ to 82,000 e¯ with a typical value of about 77,000 e¯. There is a significant offset between the two CCDs. The spatial variation may be seen as Figure 4 in ACS ISR 2020-02 and Figure 4 in ACS ISR 2004-01.
4.7.3 Linearity at Low to Moderate Intensity
High Resolution Channel
Rich star fields observed at quite different exposure times provide a simple, direct test for linearity. In Figure 4.30 the results of such tests are shown in two ways. The first is a simple plot of aperture sum values in the long exposures versus the same stars on the same pixels in the short exposures—no deviations from linearity are evident.
For a more sensitive test the bottom plot shows the results of summing counts over all stars within a defined magnitude range in the short and long exposure cases, separately, before then taking the ratio and normalizing to the relative exposure times.
The linearity of the HRC at low and moderate intensity levels, as evidenced by comparing stars observed with exposures differing by a factor of 60, appears to be excellent.
Figure 4.30: Two Representations of Linearity Test Results for Low to Moderate Count Levels, in the HRC
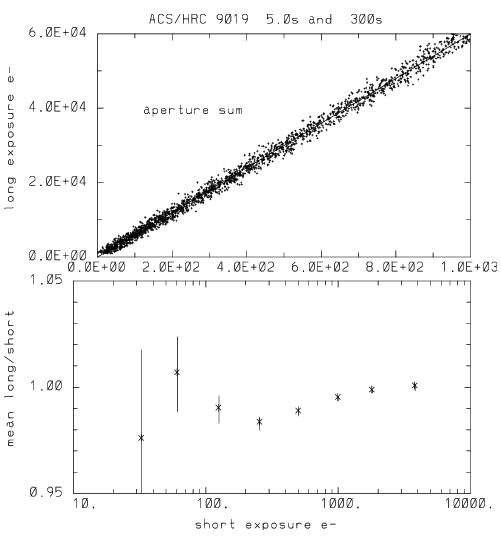
The upper panel shows aperture sums over nine pixels for all stars used over a range emphasizing results at low to moderate count levels. The plotted line has a slope set by the relative exposure time. In the lower panel the ratio of counts in ensembles of stars divided into factor of two intensity bins, and further normalized by the relative exposure time are shown. One sigma error bars are derived based on the ensemble signal-to-noise of the short exposure case. The lowest bin has 81 stars, with typical values of 400 stars per bin above this.
Wide Field Channel
In April 2002, one month after ACS's installation, small-aperture stellar photometry with WFC was very linear down to flux levels of about 5 e¯ in the central pixel (Figure 4.31). At this level, stars are not recognizable in single exposures.
Note that the degradation of CTE over time by radiation damage of the WFC detectors can also affect photometry, especially that of faint sources on low sky backgrounds, if not minimized or corrected as described in Section 4.6. However, CTE losses do not fall under detector non-linearity in the traditional sense, but users should be mindful of these effects on their photometry.
Figure 4.31: Two Representations of Linearity Test Results for Low to Moderate Count Levels, in the WFC
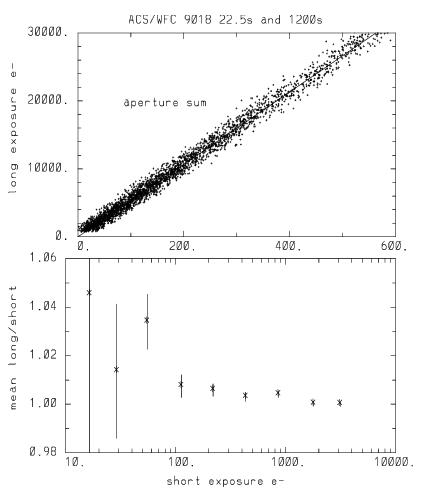
The upper panel shows simple aperture sums, for long and short exposures, for all stars of low to moderate intensity; the line has a slope set by the relative exposure times. The lower panel shows ratio of counts summed over all stars within intensity bins (in factor of two steps) for the 1200 sec. to mean 22.5 sec. exposures after normalization to the relative exposure time. To account for minor encircled energy differences for the very small nine pixel (total, not radius) apertures used, all points have been normalized by 1.006, the initial value for the brightest bin. The error bars show ±1σ deviations based on the total signal-to-noise of the short exposure sums. The number of stars per bin is typically about 400, although the lowest bin contains only 33 stars.
4.7.4 Linearity Beyond Saturation
The response of the ACS CCDs remains linear not only up to, but well beyond, the point of saturation when using a gain3 value that samples the full well depth. ACS ISR 2004-01 shows the well-behaved response of the ACS: electrons are clearly conserved after saturation. This result is similar to that of the STIS CCD (Gilliland et al., 1999) and the WFPC2 camera (Gilliland, 1994). Although charge-bleeding is most prominently associated with charge-bleed down the CCD columns in the y-direction, a small amount of bleeding along CCD rows in the x-direction has also been identified from saturated sources and in order to provide the most accurate photometry for these, a fix has been developed as described in ACS ISR 2020-07. Good photometry can be attained on isolated point sources by summing over all of the pixels affected by bleeding if the gain value samples the full well depth. A newly released software package, hst1pass, is able to do this in an automated way for both saturated and unsaturated sources in ACS images (see ACS ISR 2022-02. Given the larger dynamic range afforded before saturation at GAIN = 24 for WFC, and the only modestly-increased read noise coupled with the potentially beneficial aspect of being able to recover photometry on saturated objects, a gain value of 2 for WFC, currently the default, remains an optimal choice for saturated star photometry.
The extent to which accurate photometry can be extracted for point sources in which one or more pixels have exceeded the physical full well depth is explored in this section. Only the cases of GAIN = 44 for the HRC and GAIN = 24 for the WFC are considered, which provide direct sampling of the count levels independent of whether saturation has occurred. Ideal data for these tests consist of multiple exposures taken back-to-back on a moderate to rich star field with a broad range of exposure times resulting in both unsaturated and saturated data for many stars.
High Resolution Channel
Figure 4.32 illustrates linearity beyond saturation. In the lower panel, peak values in the long exposure are plotted against peak values from the short exposure. Over the expected linear domain, points fall within a narrow cone centered on a line that has a slope equal to the exposure time ratio, while above this the values in the long exposure saturate as expected. Deviations from lying perfectly along the line here result primarily from a 0.1 pixel offset between the images used for this test leading to different relative fractions of light falling on the central pixel.
The upper panel of Figure 4.32 shows the same stars but now using identical extraction apertures in the two exposures. The vertical line, near 205,000 e¯ on the x-axis is a separation point where stars below have a central pixel that remained unsaturated, while stars above had a saturated central pixel. There is no difference between the aperture photometry of point sources that are saturated up to five times the pixel-well depth, and those that are not. Within the domain sampled here the accuracy of saturated star photometry is much better than 1%.
Figure 4.32: Linearity Beyond Saturation in the HRC
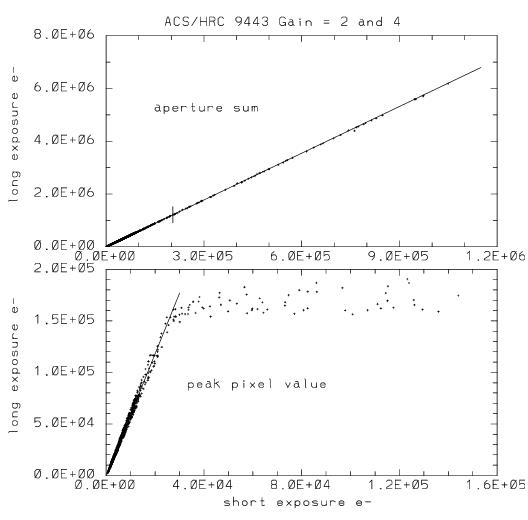
The lower panel shows peak pixel values for many stars observed for 350 seconds (long) and 60 seconds (short) with the HRC. Over the range for which stars are unsaturated in both exposures, there is a linear relation with slope equal to exposure time ratio. Brighter stars in the long exposure saturate at values near the full well depth. The upper panel shows the same stars using photometry sums from identical apertures in both exposures; stars above the vertical mark near 150,000 e¯, on the x-axis, separates stars that are saturated in the long exposure. The photometric response when summing over saturated pixels that have been bled into remains perfectly linear far beyond saturation of the central pixel at GAIN = 4.
Wide Field Channel
Figure 4.33 shows that the pixel response of the WFC detector is highly linear up to the full well level of ~80,000 electrons. Beyond this level, accurate aperture photometry is still possible. In Figure 4.34, results for the WFC show that over a range of nearly four magnitudes beyond saturation, photometry remains linear to < 1%.
Figure 4.33: Photon Transfer Curve for WFC Obtained During SM4 Optimization Campaign
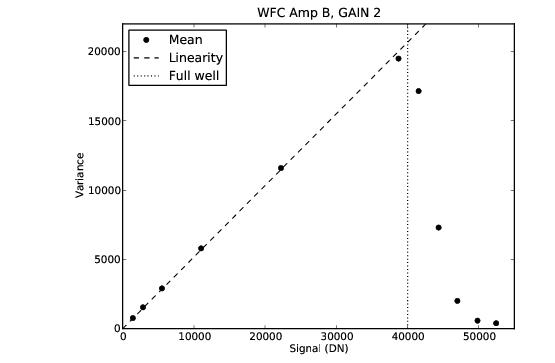
Each data point shows the mean of signal (in DN) and variance from an identical image pair measured with 25 equidistant 40 × 40 pixel boxes on the Amplifier B quadrant at commanded gain of 2. The dashed line shows that the detector is linear up to full well. The dotted line marks the full well, which is approximately 40,000 DN (with about 10% variation across the detector).
Figure 4.34: Linearity Beyond Saturation in the WFC
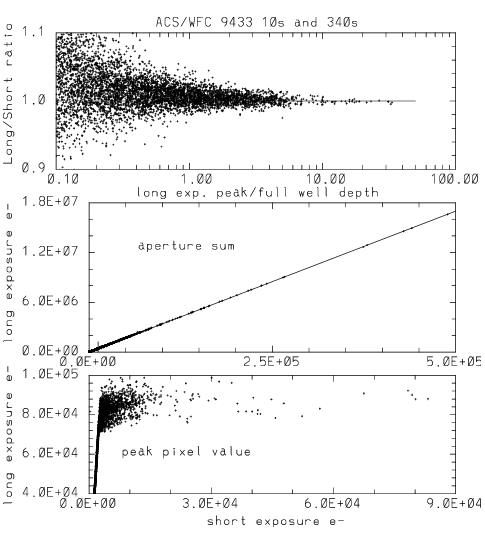
The lower panel shows peak pixel values for many stars observed for 340 seconds (long) and 10 seconds (short) with the WFC. Over the range for which stars are unsaturated in both exposures, there is a linear relation with slope equal to the exposure time ratio. Brighter stars in the long exposure saturate at values near the full well depth. The middle panel shows the same stars using photometry sums from identical apertures in both exposures; stars above the vertical mark near 12,350e¯, on the x-axis, separates stars that are saturated in the long exposure. The upper panel shows the ratio of long to short aperture sums normalized by the relative exposure time plotted against the degree of over-saturation in the central pixel of the long exposure. The lines in the top and middle panels represent the ideal case of perfect linearity in the pixel response. The fact that the data falls on the lines (or are symmetrically scattered about the lines) indicates that the WFC CCDs are close to perfectly linear. The photometric response when summing over saturated pixels that have been bled into remains perfectly linear far beyond the saturation of the central pixel at GAIN = 2.
flt.fits images. A comparison of long and short drizzled images show that the conservation of flux property by Drizzle leads to equally good results for linearity beyond saturation. An analysis of the drizzled data sets corresponding to Figure 4.34 showed equally impressive results.4.7.5 Shutter Stability
For each detector, the shutter consists of two blades located in front of the CCD entrance window. The optical path is blocked by one blade. When a command is sent to begin an exposure, the blade sweeps uniformly across the detector by 90° to open the aperture, exposing the CCD for the commanded integration time. When the exposure is complete, the shutter rotates by another 90° in the same direction so the second blade covers the aperture. A single exposure, therefore, rotates the shutter mechanism by 180°, i.e., one blade opens the aperture while the other closes it. If the blades sweep at a uniform speed, all pixels will be exposed for an identical integration time. The shortest possible exposure time for WFC is 0.5 seconds, where the blade rotates continuously through 180°. (A 0.6 sec integration time is not allowed.) For more information about the shutter, please refer to ACS ISR 2003-03.
For short exposure times, field dependent timing (shutter shading), "A" versus "B" blade shutter5 control dependence, stability, and timing accuracy were assessed for the HRC and WFC during ground-based testing and through utilizing on-orbit data. The ground results using time variable flat-field sources suggested deviations in actual versus nominal exposure times up to, but no larger than ~1% for short exposures of less than 1.0 sec.
Even at the shortest exposures, shutter shading measurements did not exceed ~0.5% center-to-edge for either camera. This supports a previous decision to not actively invoke a shading correction in calacs.
The stability of shutter timing was a bit more problematic. For the HRC, stability appeared excellent when measured as rms across several exposures, and the errors remain well under 0.5%. At exposure times of 1.0 second, peak-to-peak fluctuations on the HRC were at the 0.1% level. Only at 0.1 seconds did the HRC exposures exhibit peak-to-peak fluctuations up to ~1.0% (and part of this may have been measurement error).
The WFC shutter timing stability was not as good, but it was also more difficult to quantify given a higher level of systematic errors. Again, measured as an rms across several exposures, errors were well under 0.5%. However, out of seven pairs of back-to-back 1.0 second exposures, two of the pairs had individual components differing by > 1.3%. Where such differences existed on WFC, it was always the case that shutter timing under A control was shorter than the following B exposure. At 0.5 seconds on WFC (where shutter operation is one continuous rotation), the greatest discrepancy between A to B remained < 0.3%. These results suggest that if generally short WFC exposures are required (where short is taken to be < 2.0 seconds), then 0.5 second exposures appear to be stable and would likely support 1% accuracy, but exposures in the range of 0.7 seconds to less than 2.0 seconds may experience timing fluctuations that could compromise such accuracy. This conclusion regarding WFC exposures is not regarded as robust, but is offered as that most consistent with a simple and conservative interpretation of the test data.
In adopting a threshold of 0.5% in absolute timing, only four exposure times over HRC and WFC required revisions from pre-launch values. The 0.1 second HRC exposure is actually larger by 4.1%, while WFC exposures at 0.5 seconds, 0.7 seconds and 0.8 seconds in reality differ by +1.6%, –1.0% and –0.6% respectively. For these four exposures, using revised exposure times in calacs was recommended in order to support accurate photometry; retrievals made after March 11, 2004 will have invoked use of these corrected values.
1 Linearity depends on the constancy of the lamp source, or on experimental techniques to control for drifts.
2 The saturation count level may be different for a uniform illumination pattern than for point sources.
3 The commanded gain value for a CCD image is recorded in the image header keyword CCDGAIN. For WFC, the calibrated gain values for amplifiers A, B, C, and D are held by the image header keywords ATODGNA, ATODGNB, ATODGNC, and ATODGND, respectively. For HRC, the calibrated gain value for amplifier C is held by the keyword ATODGNC.
4 The use of "GAIN" in this context refers to the GAIN optional parameter in the Phase II proposal exposure logsheet. This commanded gain value is identical to the CCDGAIN header keyword value.
5 The shutter used for an exposure is recorded in the header keyword SHUTRPOS.