4.5 Image Anomalies
HRC has been unavailable since January 2007. Information about the HRC is provided for archival purposes.
This section presents an overview of image anomalies in ACS images. Additional information is available in HLA ISR 08-01 and ACS ISR 2016-06. Examples of scattered-light anomalies characterized in ACS ISR 2016-06 may be viewed using the dragon’s breath and guidestars interactive web tools on the ACS website.
4.5.1 Dust Motes
Several circular artifacts consisting of a dark ring with a bright center, are visible in the ACS flat fields, with typical diameters of ~30 pixels on HRC and ~100 pixels on WFC. These artifacts are shadows of dust on the CCD windows and are weaker on the f/25 WFC than on the f/68 HRC.
Since the shapes and depths of these motes are almost independent of wavelength, their effects will be removed by the flats to much better than 1%, unless any of these particulate contaminants move to different positions on the CCD windows. In case of particulate migrations, the internal lamp flats have a lower f-ratio with a wider angular distribution and cannot be used to patch the flat fields because they wash out the mote shadows. To correct for new motes, patches to the pipeline flats must be made using the original laboratory flats, corrected for the low-frequency flats derived in-flight or, for short wavelengths, using observations of the bright Earth.
Larger motes are sometimes present due to dust and blemishes on several ACS filters, including F606W, POL0V, and POL60V. Because the filters are located farther from the detector windows in a converging light beam, imperfections on the filters produce an out-of-focus image at the detector, where typical mote diameters are about 350–400 pixels on the WFC and about 250–300 pixels on the HRC. One of these large motes can be seen on chip 2 of the WFC F606W flat in Figure 4.20.
Until April 2004, the positioning accuracy of the filter wheels has been within ±1 motor step of the nominal position. This delta corresponds to a distance on the detectors of ~18 HRC pixels and ~20 WFC pixels. Features with sharp transmission gradients at the filter wheels cause a corresponding flat-field instability, where errors are 1-3% for a few pixels near the blemishes. If the filter wheel lands in a different place the dust mote will move relative to the detector pixels. Blemish mis-registration is an error in the pixel-to-pixel high frequency component of the flat fields and is not related to the low-frequency L-flat correction, which has been applied for all standard and polarizing filters. For details on the L-flat correction, see Section 4.4.2.
This problem was recognized and addressed before launch by a laboratory calibration campaign to obtain flat fields at the nominal position and at plus and minus one step for the F606W + CLEAR on the WFC and for the two POLV filters in combination with the highest priority F475W, F606W, and F775W filters on both HRC and WFC. Since the resolver position uniquely determines the filter wheel step, the ACS pipeline data processing has been enhanced to automatically apply the proper flat for the wheel step position. The keyword FWOFFSET has been added to the ACS image headers to indicate the position of the filter wheel. In April 2004, an update was made to the ACS flight software and the filter wheel is now always positioned at its nominal position. For more information on flat fields for filter wheel offset positions, refer to ACS ISR 2003-11.
4.5.2 Optical Ghosts and Scattered Light
ACS was designed with a requirement that no single stray light feature may contain more than 0.1% of the detected energy in the object that produced it. This goal has generally been met, but during extensive ground and SMOV test programs, a few exceptions have been identified (Hartig et al. 2003) such as the WFC elliptical haloes and the F660N ghosts. While these ghosts exceed the specified intensity, their origin and characteristics are well defined and they should have minimal impact on the ACS science program. Details about some optical ghosts relevant for ACS are described below.
- WFC elliptical haloes: these ghosts are caused by reflection from the CCD surface (which lies at an ~20° angle to the chief ray) up to the detector windows and back to the CCD. They show up as pairs of elliptical annuli, aligned along the negative diagonal of the FOV (see #1 in Figure 4.23), and are observed when bright sources are placed on the lower right (D amplifier) quadrant of the WFC detector. The surface brightness of the annuli increases and size decreases with proximity to the corner. Two pairs of ghosts are seen, produced by reflection from the four window surfaces. The total energy fraction in each ghost may exceed 0.2% of the target signal.
- F660N ghosts: the F660N narrow band filter produces pairs of relatively bright circular annuli stationed near to (but radially outward from) the target image (see Figure 4.24). This is due to reflection from the two surfaces of the second "blocker" substrate back to the many-layer dielectric stack on the first substrate, which in turn reflects at high efficiency at the filter wavelength range. These two haloes contain ~2% of the detected target energy and are always about 10 and 20 pixels in diameter.
- Annular ghosts: large annular ghosts1 near their parent images are caused by reflection from the detector windows, back to the filters, then returning to the CCD (see #2 in Figure 4.23). Another type of annular ghost arises from reflections between the inner and outer window surfaces; these are much smaller in diameter, relatively low in intensity (well within the specification) and are displaced radially from the parent image by a small amount (see #3 in Figure 4.23).
- Glint: There can sometimes be a reflection known as a "glint", as shown in Figure 4.25. "Glint" refers to a thin ray of light extending diagonally across the WFC FOV. It appears to occur when bright stars are found in a narrow region spanning from a spot on the WFC chip gap approximately 1250 pixels from the left side of the detectors, to a position approximately in the center of WFC1. Further details can be found in ACS ISR 2024-05.
- "Dragon's breath" is caused by light reflections involving the knife-edged mask in front of the CCD detector. This anomaly typically appears as a narrow spike, appearing like a tongue of flame, extending from the edge of the frame (see #4 in Figure 4.23). Edge glow is caused by a similar effect, however produces somewhat round and diffuse bright area on the edge of the frame. See ACS ISR 2016-06 and the dragon's breath and guide stars interactive web tools for more details of these anomalies.
In general, little can be done about these anomalies in the post-observation data processing phase. Instead, some judicious planning of the actual observations, particularly if bright sources are expected in, or near, the field of view, is recommended. For instance, the impact of diffraction spikes (which for ACS lie roughly along the X and Y axes) and of CCD blooming (which occurs along the Y direction) due to a bright star, can be reduced by choosing an ORIENT2 that prevents the source of interest from being located directly above/below or left/right of the bright star. Similarly, the impact of WFC elliptical haloes can be minimized by avoiding a bright star in the quadrant associated with amplifier D.
Figure 4.23: Optical Ghosts, Diffraction Spikes, and Blooming
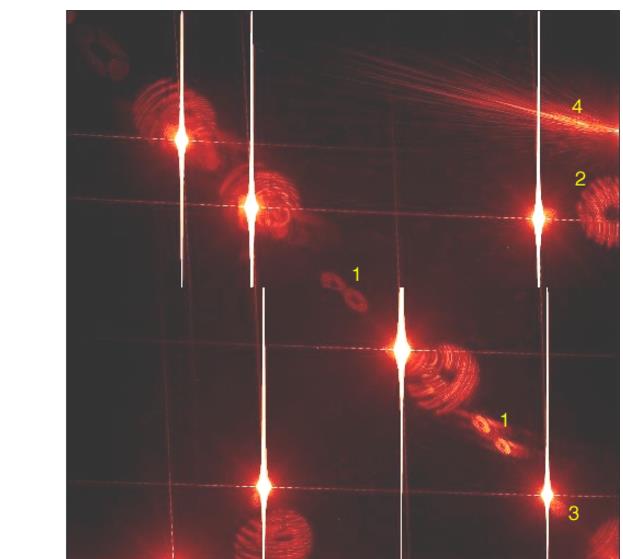
This image was obtained during ground calibration at Ball Aerospace using a HeNe laser (633 nm) through F625W (Hartig et al. 2003). There are nine highly saturated point sources in and just off of the field of view. Note the diffraction spikes along the X and Y axes of the WFC, and the severe blooming of the charge along the Y-axis. Several optical ghosts with different origins and intensities are visible:
- WFC elliptical haloes show up in the lower left as pairs of elliptical annuli aligned along the negative diagonal of the FOV;
- large annular ghosts are seen near their parent images;
- to the lower right, there exist smaller fainter annular ghosts which tend to be displaced radially from the parent image by a small amount;
- "Dragon's Breath" is a shower of scattered light from a very bright star that is just off the edge of the CCD. This rare anomaly occurs when a star falls at the edge of the mask in front of the chip; the starlight reflects off the CCD, then off the mask, and back to the detector.
Figure 4.24: F660N Optical Ghosts
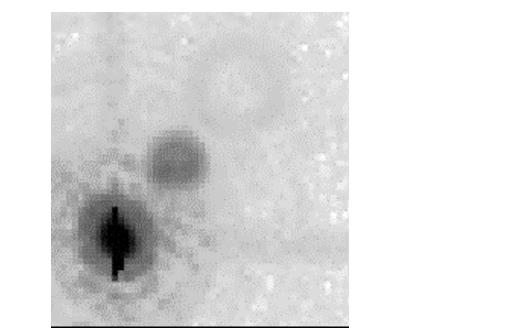
This 700 second F660N exposure illustrates the F660N ghosts, namely pairs of relatively bright circular annuli stationed near to (but radially outward from) the target image. These haloes contain ~2% of the detected target energy and are always about 10 and 20 pixels in diameter.
Figure 4.25: Glint
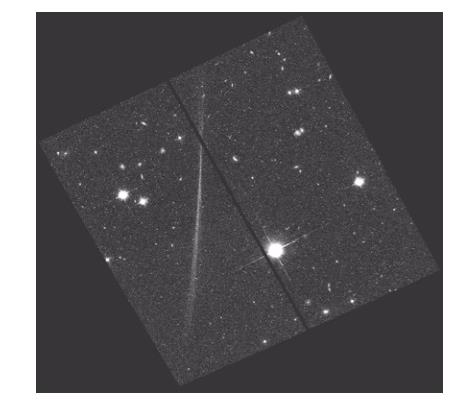
Thin rays of light extending from and/or across the chip gap are sometimes seen. "Glint" appears to occur when bright stars are found in a narrow region spanning from a spot on the WFC chip gap approximately 1250 pixels from the left side of the detectors, to a position approximately in the center of WFC1. See Hartig (2002) and HLA ISR 2008-01 as well as ACS ISR 2024-05 for more on the origins of glint.
4.5.3 Cross-Talk
The ACS/WFC detector has four amplifiers (A, B, C, D; see Figure 1.1) through which the four quadrants of the detector are read out separately and simultaneously. As the quadrants are read out, electronic cross-talk between the amplifiers can be induced. As a result, an imaged source in one quadrant may appear as a faint, mirror-symmetric ghost image in the other quadrants. The ghost image is often negative; therefore, bright features on the "offending" quadrant show up as dark depressions on the "victim" quadrants.
Cross-talk in pre-SM4 images is discussed in ACS ISR 2004-12 and ACS ISR 2004-13. Pre-SM4 data with GAIN = 1 were more affected by cross-talk than those with GAIN = 2, though the strength of GAIN = 2 cross-talk was determined to have negligible photometric effects in most applications. Cross-talk in post-SM4 images is explored in ACS ISR 2010-02. Low-signal sources induce much weaker cross-talk in post-SM4 images as compared to pre-SM4 images. High-signal sources induce cross-talk that is similar to pre-SM4 levels for GAIN = 2 (and is even worse for GAIN = 1). The calacs pipeline corrects for cross-talk in post-SM4 full frame WFC images as part of the doBlev stage (see Section 3.4.1).
See Figure 4.26 for an example of low-signal cross-talk effects in pre-SM4 imaging, and Figure 4.27 for an example of the lack of cross-talk due to low-signal sources in post-SM4 data.
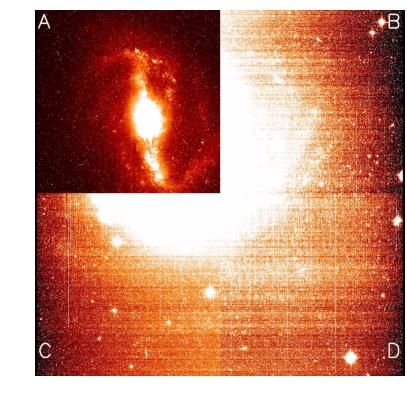
Figure 4.26: Cross-talk in Pre-SM4 ACS Image of NGC 4710
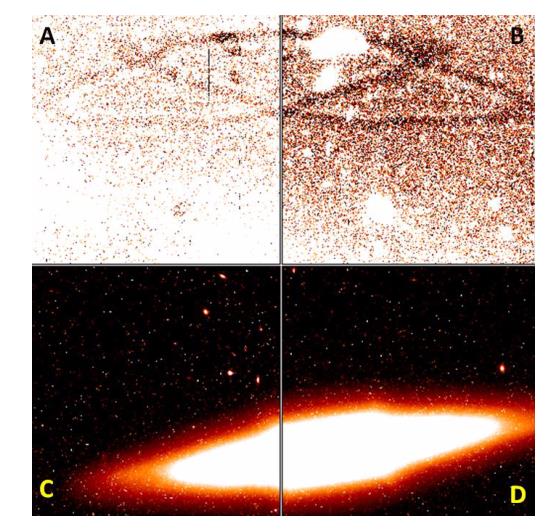
This image (from program ID 10594, image j9ew02wlq, GAIN = 2) shows the galaxy in quadrants C and D. Its cross-talk ghosts, seen as dark oval shapes in quadrants A and B, are due to low signal offending sources of ~100 e¯ to 1000 e¯ in the area of the reddish rim of the galaxy. Also the ghosts of three largest galaxies in quadrant B are easily identifiable in quadrant A. The image in quadrants A and B is stretched within a narrow signal range centered at the sky background level, which makes the ghosts distinctly stand out against the background.
Figure 4.27: Post-SM4 Image of NGC 6217
The image shows NGC6217 centered in quadrant A, obtained with GAIN = 2 (program ID 11371, frame ja7z03unq). The images in quadrants B, C, and D are stretched similarly to that in quadrants A and B in Figure 4.26. No ghosts from low signal areas in quadrant A are seen in the other three quadrants.
4.5.4 Scattered Earth Light
Most observers will not experience significant issues with scattered Earth light in their observations. Normally observations are scheduled only when the bright Earth limb is more than 20° from the HST pointing direction. This is sufficient to eliminate serious impacts from scattered Earth light—the most severe impact will be for observers with targets in the CVZ3 who may notice the sky background increased by a factor of 2 or 3.
It is possible to make arrangements for observations at smaller bright Earth limb angles, and these images have the potential to suffer serious impacts from scattered light. There are two types of impact: elevated background and non-uniformity in the background. For example, at a bright Earth avoidance angle of 14°, it is possible for the sky level to be increased by a factor of 100 compared to normal pointings away from the Earth; this will of course have a serious impact on the background noise and detection of faint targets. Also, non-uniformity can arise since the scattered light is taking an increasingly non-standard path through the HST optics, and hence the flat-fielding becomes corrupted. At this same angle of 14°, it is possible to have both large scale gradients across the field of view (up to ~20% amplitude in the WFC) and small scale features in the background (up to ~12% in WFC and ~30% in the HRC). See ACS ISR 2003-05 for more details.
4.5.5 HRC Polarimetry
Each ACS filter is designed to maintain confocality with both the WFC and HRC when paired with a clear aperture in the other filter wheel. To maintain this confocality when filters are paired with polarizers, the polarizers were fabricated with additional lensing power that alters the pixel scale and geometric distortion of each camera. The additional distortion is further complicated by localized optical defects (bubbles and wrinkles) in the polaroid materials (See ACS ISR 2004-09).
Polynomial solutions of the geometric distortion for each filter are used by the AstroDrizzle stage of the ACS calibration pipeline to produce geometrically rectified and resampled WFC and HRC images for photometric and astrometric use. These rectified images are provided as FITS images with the drz.fits/drc.fits extension.
Currently, distortion solutions have not been derived for HRC images obtained with the UV or visible polarizers. Such images constitute about 4% of the HRC datasets in the HST archive. Consequently, the drz.fits files produced by AstroDrizzle for polarized HRC images have a pixel scale that differs by ~3% from the correct pixel scale obtained for non-polarized images. A correct distortion solution will be generated before the planned creation of a static HRC image Archive. Until then, users must exercise caution when performing astrometry or surface brightness measurements with polarized HRC images.
4.5.6 Satellite Trails
Due to its low-Earth orbit, HST imaging is subject to periodic contamination from satellites crossing the field of view. An analysis of existing ACS/WFC data has shown that the rate of satellite contamination has gradually increased since ACS was installed, roughly doubling between 2002 and 2022. As of 2022, detectable satellites trails were estimated to cross the ACS WFC FOV at a rate of ~0.6 per hour, such that ~10% of full-frame ACS/WFC images will suffer contamination. This number is expected to increase with time. Further information can be found in ACS ISR 2022-08.
Two separate algorithms have been incorporated into acstools to identify and mask satellite trails. The first, acstools.detsat, is described in ACS ISR 2016-01, uses edge detection filtering combined with a Hough Transform to identify trails. The algorithm executes quickly and is highly effective at detecting trails above the background noise level with a low false positive rate. The second method, acstools.findsat_mrt, is described in ACS ISR 2022-08 and identifies trails based on their signals in a Median Radon Transform of the input image. While the approach is more computationally intensive, it is sensitive to trails with average brightness well below the background noise level. Neither of these programs are run as part of the default ACS reduction pipeline, but are made available for users. Both programs can be used to flag identified trails in the input image with DQ flag 16384.
1 In Figure 4.23, the fringes visible in the annulus arise from interference between HeNe laser light reflections from the two surfaces of the windows. This image was obtained during ground testing.
2 Spacecraft roll angle specified for an observation in the Phase II proposal exposure logsheet.
3 Continuous Viewing Zone: a declination band from the poles to ±61.5° where targets may be viewed without occultations at some time during the 56-day precessional cycle of the HST orbit.