NUV Grating G185M
Description
The G185M grating samples wavelengths between about 1700 and 2100 Å. The grating has 15 central wavelength settings.
Special Considerations
G185M spectra consist of three 35 Å stripes separated by two 64 Å gaps. To acquire a complete spectrum requires the use of six central-wavelength settings.
| Grating | Resolving Power R = λ/Δλ | Dispersion (mÅ pixel−1) | Spatial Resolution (milliarcsec pixel−1) | Plate Scale (milliarcsec pixel−1) | FP-POS Step (Å step−1) | |
|---|---|---|---|---|---|---|
| Disp. Axis | Cross-Disp. Axis | |||||
| G185M | 16,000–20,000 | 37 | 75 ± 4 | 24.3 | 23.8 | 1.9 |
Figure 13.17: Wavelength Ranges for the G185M Grating.
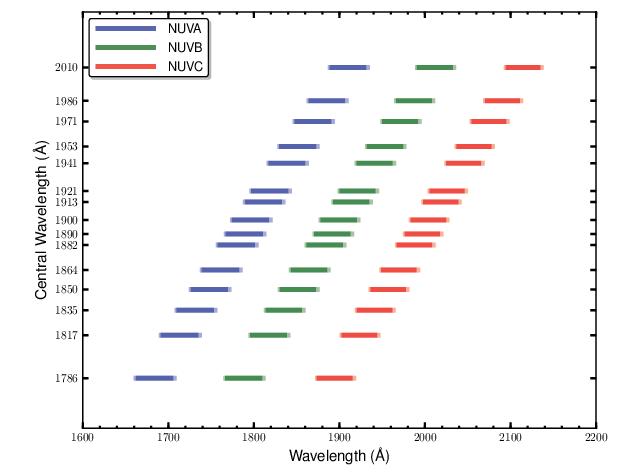
Dark lines represent wavelengths sampled by all four FP-POS positions.
G185M Point-Source Sensitivity
Table 13.8: G185M Point-Source Sensitivity for PSA.
| Wavelength (Å) | Throughput | Sensitivity (counts pixel−1 sec−1 per erg cm−2 sec−1 Å−1) | Effective Area (cm2) |
|---|---|---|---|
| 1670 | 6.068e−03 | 8.4e+11 | 2.75e+02 |
| 1700 | 8.398e−03 | 1.2e+12 | 3.80e+02 |
| 1750 | 1.158e−02 | 1.7e+12 | 5.24e+02 |
| 1800 | 1.335e−02 | 2.0e+12 | 6.04e+02 |
| 1850 | 1.401e−02 | 2.2e+12 | 6.34e+02 |
| 1900 | 1.397e−02 | 2.2e+12 | 6.32e+02 |
| 1950 | 1.334e−02 | 2.2e+12 | 6.03e+02 |
| 2000 | 1.301e−02 | 2.2e+12 | 5.88e+02 |
| 2050 | 1.221e−02 | 2.1e+12 | 5.53e+02 |
| 2100 | 1.122e−02 | 2.0e+12 | 5.08e+02 |
| 2127 | 1.047e−02 | 1.9e+12 | 4.74e+02 |
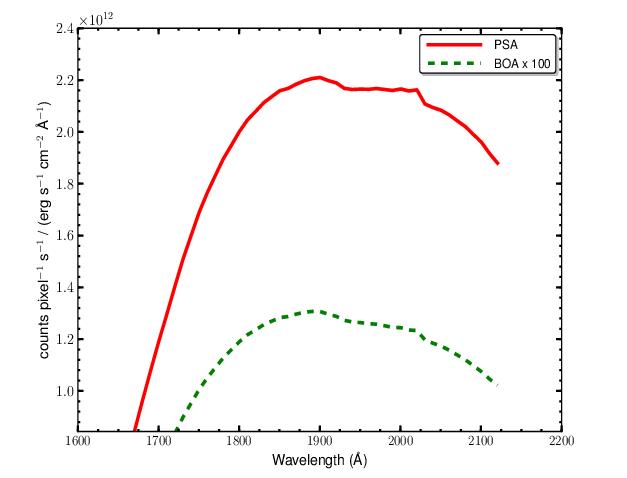
Figure 13.18: G185M Point-Source Sensitivity for PSA and BOA.
G185M Signal-to-Noise Ratio
Figure 13.19: Point-Source Signal-to-Noise as a Function of STMAG for G185M.
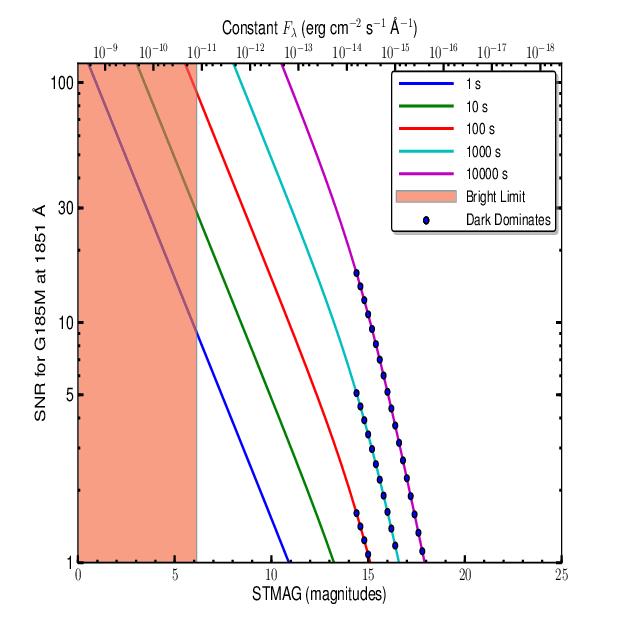
The top axis displays constant Fλ values corresponding to the STMAG units (V+STMAGλ) on the bottom axis. Recall that STMAG = 0 is equivalent to Fλ = 3.63E−9 erg cm−2 s−1 Å−1. Colors refer to exposure times in seconds. The edge of the shaded area corresponds to the bright-object screening limit. Use of the PSA is assumed.
-
COS Instrument Handbook
- Acknowledgments
- Chapter 1: An Introduction to COS
- Chapter 2: Proposal and Program Considerations
- Chapter 3: Description and Performance of the COS Optics
- Chapter 4: Description and Performance of the COS Detectors
-
Chapter 5: Spectroscopy with COS
- 5.1 The Capabilities of COS
- • 5.2 TIME-TAG vs. ACCUM Mode
- • 5.3 Valid Exposure Times
- • 5.4 Estimating the BUFFER-TIME in TIME-TAG Mode
- • 5.5 Spanning the Gap with Multiple CENWAVE Settings
- • 5.6 FUV Single-Segment Observations
- • 5.7 Internal Wavelength Calibration Exposures
- • 5.8 Fixed-Pattern Noise
- • 5.9 COS Spectroscopy of Extended Sources
- • 5.10 Wavelength Settings and Ranges
- • 5.11 Spectroscopy with Available-but-Unsupported Settings
- • 5.12 FUV Detector Lifetime Positions
- • 5.13 Spectroscopic Use of the Bright Object Aperture
- Chapter 6: Imaging with COS
- Chapter 7: Exposure-Time Calculator - ETC
-
Chapter 8: Target Acquisitions
- • 8.1 Introduction
- • 8.2 Target Acquisition Overview
- • 8.3 ACQ SEARCH Acquisition Mode
- • 8.4 ACQ IMAGE Acquisition Mode
- • 8.5 ACQ PEAKXD Acquisition Mode
- • 8.6 ACQ PEAKD Acquisition Mode
- • 8.7 Exposure Times
- • 8.8 Centering Accuracy and Data Quality
- • 8.9 Recommended Parameters for all COS TA Modes
- • 8.10 Special Cases
- Chapter 9: Scheduling Observations
-
Chapter 10: Bright-Object Protection
- • 10.1 Introduction
- • 10.2 Screening Limits
- • 10.3 Source V Magnitude Limits
- • 10.4 Tools for Bright-Object Screening
- • 10.5 Policies and Procedures
- • 10.6 On-Orbit Protection Procedures
- • 10.7 Bright Object Protection for Solar System Observations
- • 10.8 SNAP, TOO, and Unpredictable Sources Observations with COS
- • 10.9 Bright Object Protection for M Dwarfs
- Chapter 11: Data Products and Data Reduction
-
Chapter 12: The COS Calibration Program
- • 12.1 Introduction
- • 12.2 Ground Testing and Calibration
- • 12.3 SMOV4 Testing and Calibration
- • 12.4 COS Monitoring Programs
- • 12.5 Cycle 17 Calibration Program
- • 12.6 Cycle 18 Calibration Program
- • 12.7 Cycle 19 Calibration Program
- • 12.8 Cycle 20 Calibration Program
- • 12.9 Cycle 21 Calibration Program
- • 12.10 Cycle 22 Calibration Program
- • 12.11 Cycle 23 Calibration Program
- • 12.12 Cycle 24 Calibration Program
- • 12.13 Cycle 25 Calibration Program
- • 12.14 Cycle 26 Calibration Program
- • 12.15 Cycle 27 Calibration Program
- • 12.16 Cycle 28 Calibration Program
- • 12.17 Cycle 29 Calibration Program
- • 12.18 Cycle 30 Calibration Program
- • 12.19 Cycle 31 Calibration Program
- • 12.20 Cycle 32 Calibration Program
- • 12.21 Cycle 33 Calibration Program
- Chapter 13: COS Reference Material
- • Glossary