5.1 The Capabilities of COS
COS has two detectors and seven diffraction gratings (three for FUV, four for NUV), which enable high-sensitivity spectroscopy at low and moderate resolution across the FUV and NUV bands. The bandpass and resolution of each grating are presented in Table 5.1. Links to pages with additional information for each grating (Section 13.3) are provided in Table 5.1, noting that, in addition to the standard G130M central wavelengths, the first two rows of Table 5.1 give the bandpass and resolution for the 1055/1096 and 1222 central wavelengths, respectively.
For each exposure the observer selects a detector (FUV or NUV), a grating, a central wavelength, an FP-POS setting, one of the two apertures (PSA or BOA), and a data-taking mode (TIME-TAG or ACCUM). Chapter 13 provides detailed specifications for each grating and aperture. Note that the two channels cannot be used simultaneously as the NUV channel is fed by the NCM1 mirror on the FUV optics select mechanism (OSM1). Spectroscopic observations with the BOA aperture are considered "Available-but-Unsupported" (See Section 5.11 and 5.13).
Table 5.1: COS Grating Parameters.
| Grating | Approximate Wavelength Range (Å) | Bandpass per Exposure and FUV Gap1 (Å) | Inferred PSA Resolving Power R = λ/FWHM2 | Approximate BOA Resolving Power | Dispersion (mÅ pixel–1) |
|---|---|---|---|---|---|
FUV Channel | |||||
900–1236 | 295/16 | up to ~13,0003 | — | 9.97 | |
1065–1365 | 296/15.7 | 12,000-17,0003 | — | 9.97 | |
1150–1450 | 292/14.3 | 12,000-17,000 | 76004 | 9.97 | |
1360–1775 | 360/18.1 | 13,000–20,000 | 44004 | 12.23 | |
<900–2150 | >1150/112 | 1500–4000 | 11004 | 80.3 | |
NUV Channel | |||||
1700–2100 | 3 × 35 | 16,000–20,000 | 3500 | 37 | |
2100–2500 | 3 × 35 | 20,000–24,000 | 4600 | 33 | |
2500–3200 | 3 × 41 | 20,000–24,000 | 5000 | 40 | |
1650–32006 | (1 or 2) × 398 | 2100–3900 | 500 | 390 | |
1 Width of gap between FUV detector segments; see Section 5.5.
2 Empirically determined FWHM of the LSF, which is not Gaussian. R increases approximately linearly with wavelength.
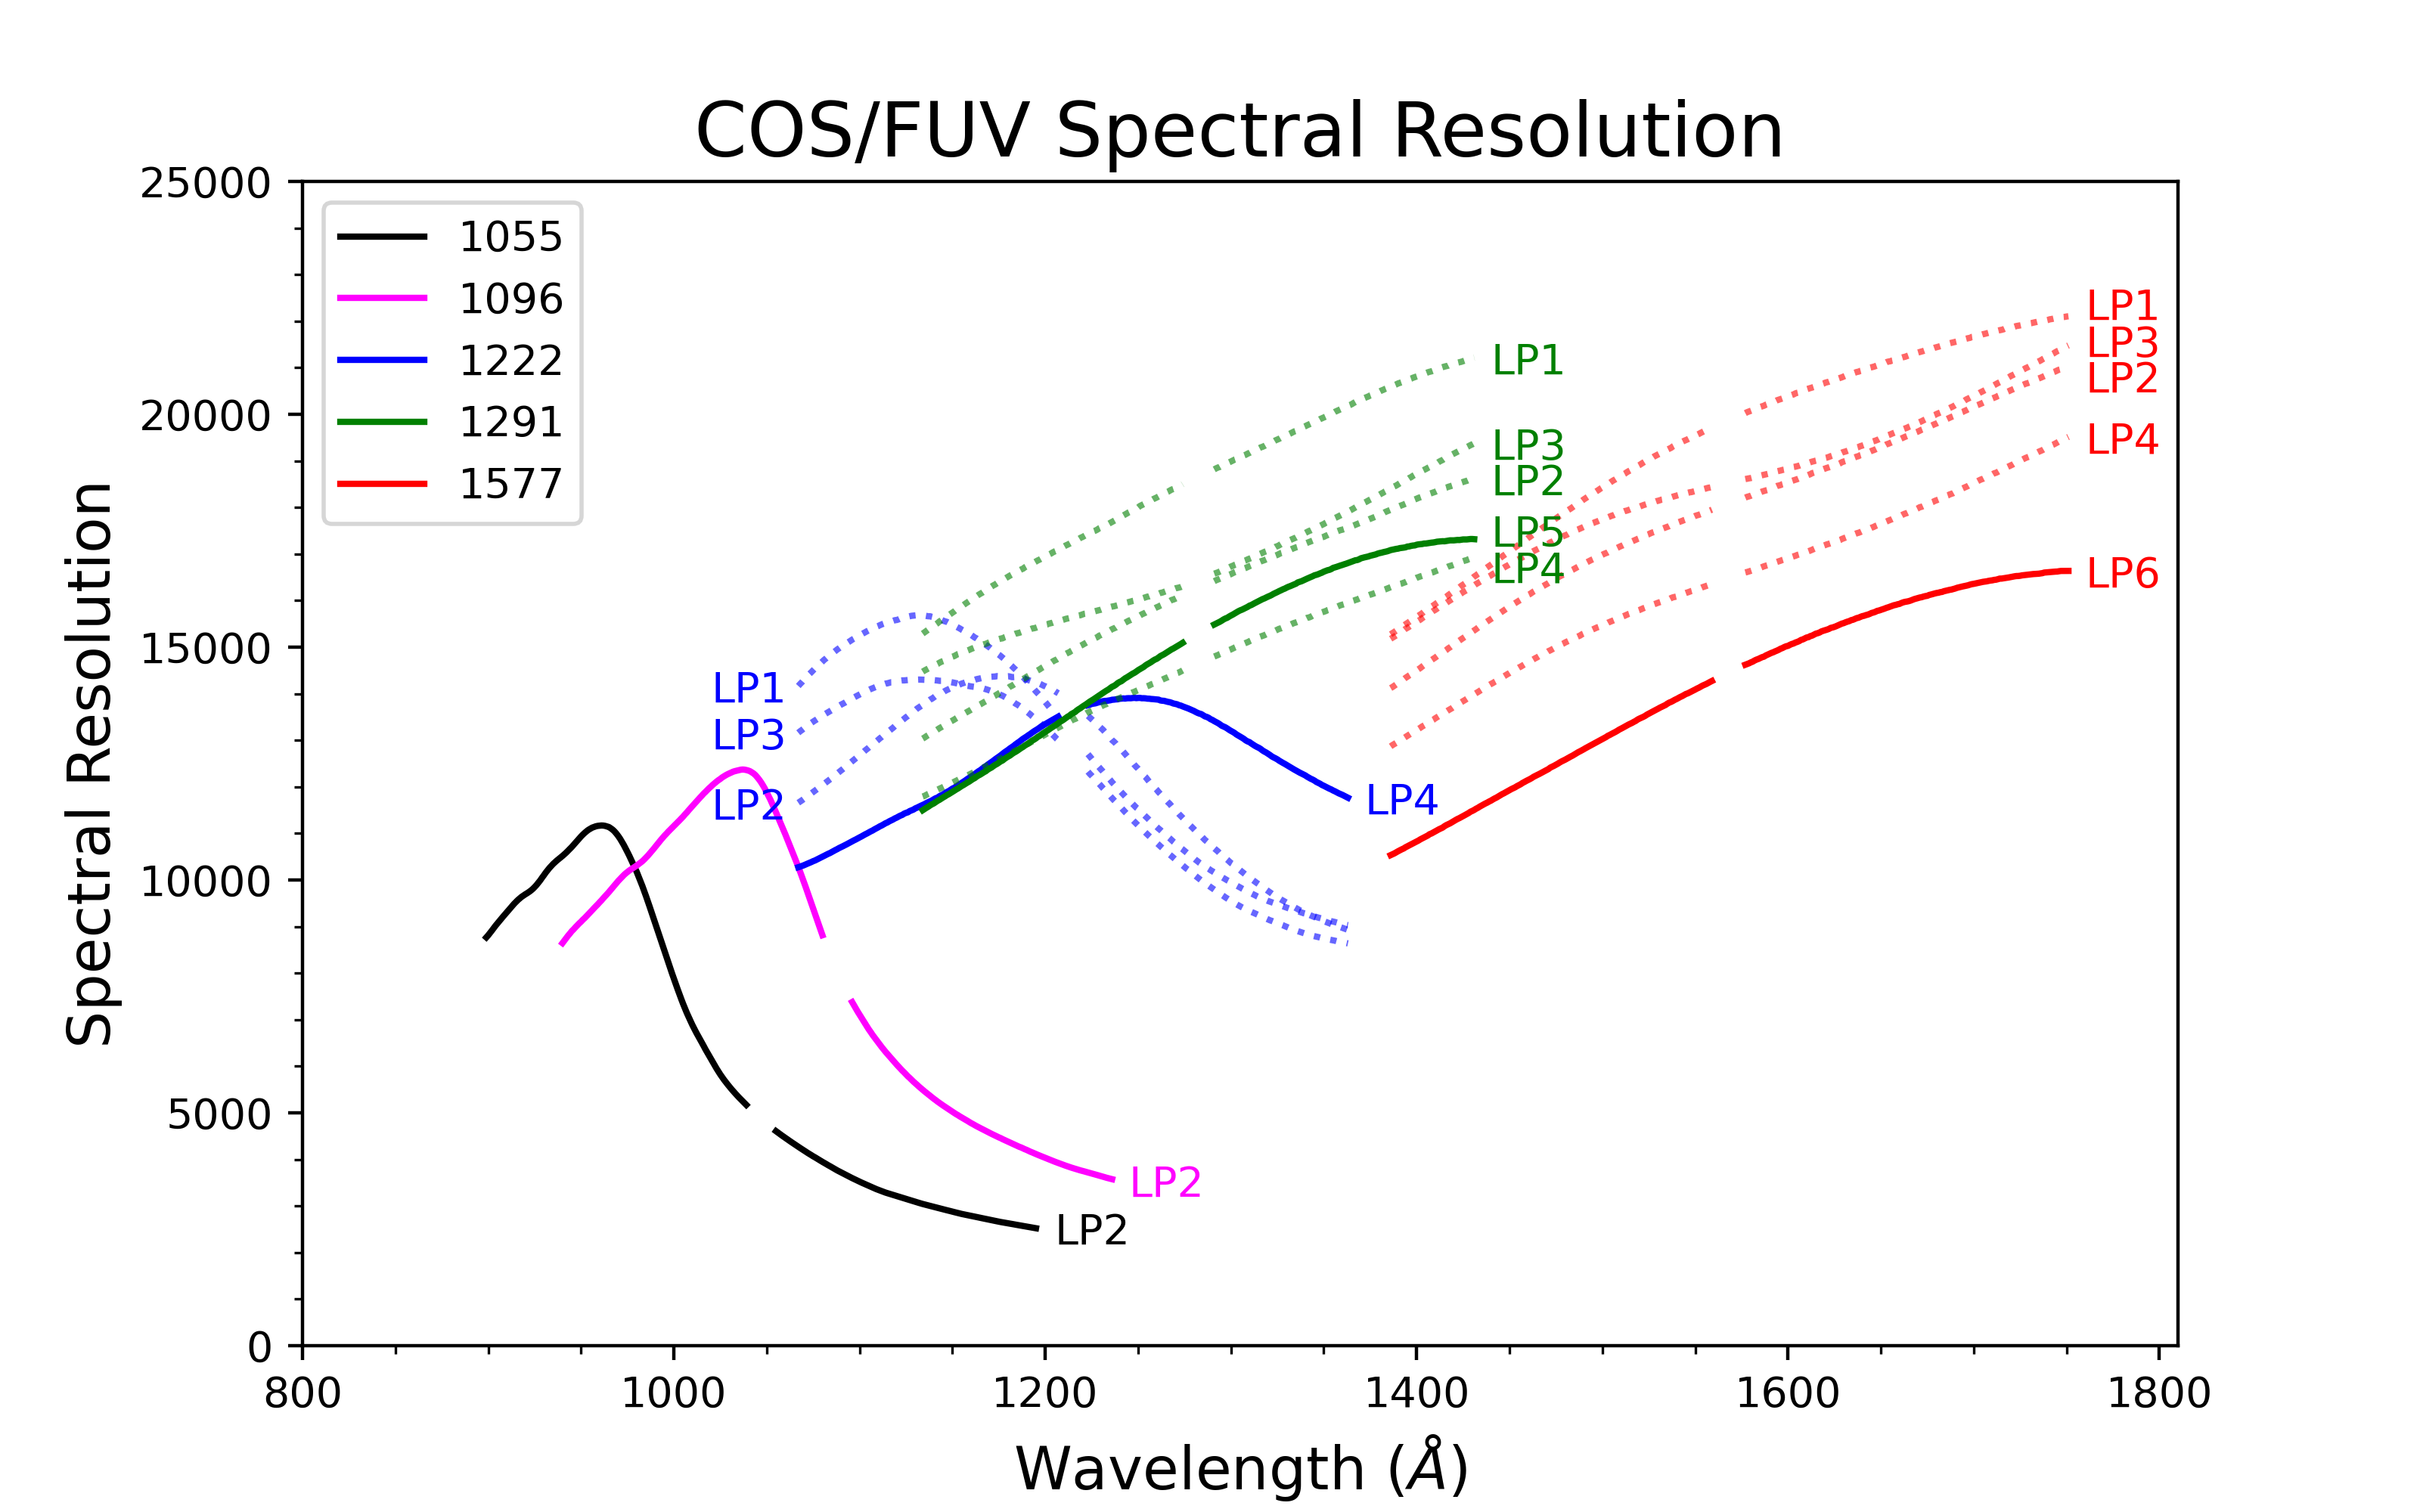
3 For these settings, R reaches a maximum in the middle of the wavelength range. See Figure 5.5.
4 At LP1. For subsequent LP, the resolution may be slightly reduced.
5 The G285M grating is Available-but-Unsupported. See Section 5.11 for details.
6 Some shorter wavelengths are recorded in second-order light. They are listed in Table 5.4.
5.1.1 First-Order Sensitivity
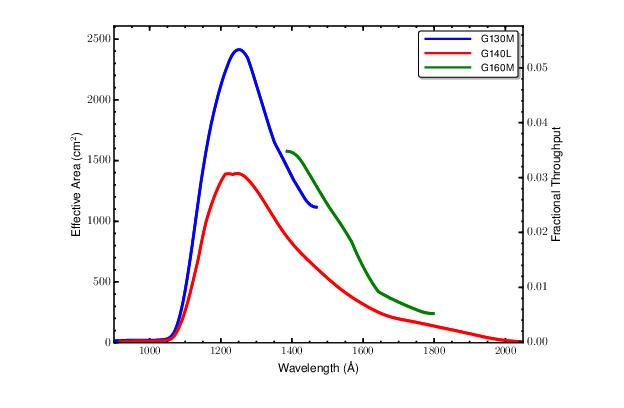
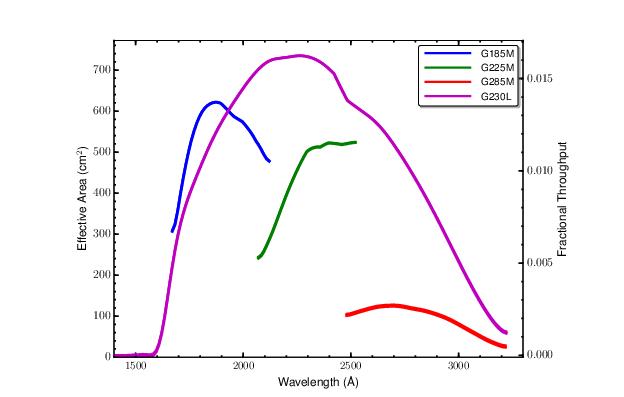
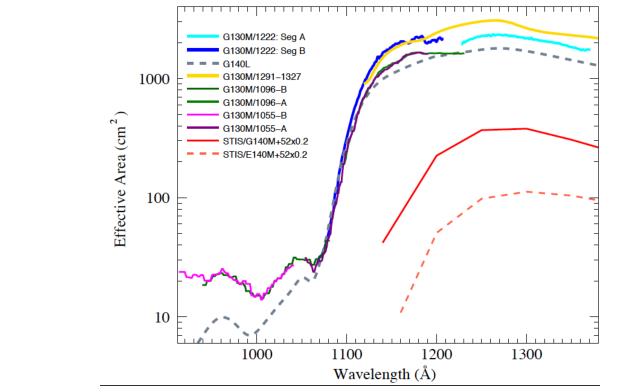
COS is considerably more sensitive than STIS and earlier-generation HST instruments at comparable spectral resolutions, particularly in the far ultraviolet. Effective areas for targets observed through the PSA are shown in Figure 5.1, Figure 5.2, and Figure 5.3. Note that the COS sensitivity changes with time (Section 5.1.5). Please consult the COS website for updated information.
While the figures and tables in this handbook can be used to estimate count rates and exposure times, we recommend the use of the COS ETC in all cases, because it properly computes instrument throughput, accounts for detector and astronomical backgrounds, and checks for violations of local and global count-rate screening limits.
5.1.2 Sensitivity below 1150 Å
Figure 5.3 compares the effective areas of the G130M and G140L gratings at the short-wavelength end of the COS bandpass. (The G140L curve at short wavelengths presented here was tentative pending calibration of cenwave 800; see COS ISR 2019-04 for this calibration.) From this figure we can draw two fundamental conclusions. First, COS can obtain useful spectra at wavelengths between 900 and 1150 Å. Second, the contrast between the throughputs at 1070 and 1150 Å is roughly a factor of 100.
For G140L observations at short wavelengths, use CENWAVE=800 for targets where there is no count-rate violation at long wavelengths. For some targets, however, the count rate at 1150 Å will exceed the local bright screening limit, while the count rate at shorter wavelengths is perfectly safe. In this case, using CENWAVE=1280 with Segment A turned off is the recommended approach. Using only FP-POS=4 to avoid the longest wavelengths in the Segment B range is an additional strategy that may protect against count-rate violations.
When grating G130M is used with CENWAVE=1055, Segment B records wavelengths shortward of ~1050 Å, depending on the FP-POS setting employed (Section 13.3). Using this grating mode with Segment A turned off further reduces the danger of high count rates at longer wavelengths. Special configurations to allow proper wavelength calibration must be used (see Section 5.7.4). Note that both the sensitivity and resolving power (Section 5.1.4) of G130M are greater than those of G140L in this wavelength range.
The sensitivity for the G140L/800 and 1280 setting changes by a factor of 100 between the wavelengths of 1070 Å and 1150 Å, so the flux vs. wavelength calibration is extremely sensitive to small misalignments in the wavelength scale. For cenwave 1280, this is complicated by the absence of usable calibration lamp lines on Segment B (see Section 5.7.4). Therefore, even small wavelength misalignments will lead to sizable artifacts in the extracted flux for the calibrated spectra. The flux and wavelength calibrations should be used with caution when interpreting the default pipeline products. For these settings, the sensitivity has not been measured shortward of 912 Å. Photons at these wavelengths are preserved in the "net counts" column of the *x1d*.fits
5.1.2.1 Resolution and Wavelength Calibration below 1150 Angstroms
Starting in Cycle 21 the spectral resolutions of the FUV G130M 1055 and 1096 central wavelengths settings were substantially increased above the values offered during earlier cycles and, when combined with the 1222 setting first offered in Cycle 20, this now allows resolutions of 7300 to 11,000 to be obtained at any wavelength between 900 and 1150 Å (see Figure 5.5). Users should note, however, that for each of these modes the focus values have been set to optimize the resolution over a limited part of their wavelength range, and it will be necessary to use multiple settings to get the maximum resolution over this full range. At longer wavelengths the resolutions offered by any of these settings will be inferior to those available with the original complement of G130M central wavelength settings (1291, 1300, 1309, 1318, and 1327).
Users should also note that targets that are too bright to observe at longer wavelengths with the COS G130M grating may be observable on Segment B with the 1055 and 1096 settings by turning off Segment A, which covers longer wavelengths. However, in this case there is no usable TAGFLASH wavelength calibration lamp spectrum recorded because there are no visible wavelength calibration lines that fall on Segment B. As a result, the spectrum observed on Segment B cannot be corrected for mechanism drift or zero-point offsets. In such cases, for each CENWAVE and FP-POS position, a separate GO-wavecal exposure should be taken with Segment A “on” immediately adjacent to the Segment B science observations. This Segment A wavecal will allow the zero-point offset of the wavelength scale of Segment B to be corrected to within 10 pixels. Several minutes are required to reconfigure the COS FUV detector each time the segments are powered on or off. However, with careful planning much of this overhead can often be hidden in the occultations or other overheads. Additional details and examples of observing scenarios can be found in Chapter 5 and in Section 9.7 "Examples of Orbit Estimates."
The 1280 setting of G140L also covers from below 900–1185 Å on Segment B of the FUV detector with resolution of 900–1800 over this range. In principle, the spectral format of this setting may allow observations at even shorter wavelengths; however, the throughput and resolution between 500 and 900 Å are poorly characterized. The 800 setting of G140L places the entire wavelength range from 800 to 1950 Å on Segment A of the FUV detector, and it is optimized to reduce the astigmatic height of the spectrum below about 1100 Å. This allows for decreased detector noise and correspondingly better S/N at these wavelengths compared to that attainable on segment B with the 1280 setting.
Limited amounts of data were taken using the G130M 1055 and 1096 central wavelength settings at the first lifetime position (before July 23, 2012). Calibrated data from these observations can be obtained by contacting the HST Help Desk.
5.1.3 Second-Order Sensitivity
Because the MAMA detector is sensitive to wavelengths as short as 1150 Å, NUV spectra longward of 2300 Å are vulnerable to contamination from second-order light. To mitigate this problem the COS NUV optics were designed to provide peak reflectivities between 1600 and 2000 Å. Gratings G225M and G285M are coated with bare aluminum, which, when oxidized, has poor reflectivity below 1800 Å. After six reflections (two MgF2 mirrors in the HST OTA and four bare-Al optics in COS) light from below 1250 Å is attenuated by 99%. Mounted directly on gratings G230L and G285M are order-sorting filters that block most light from below 1700 Å.
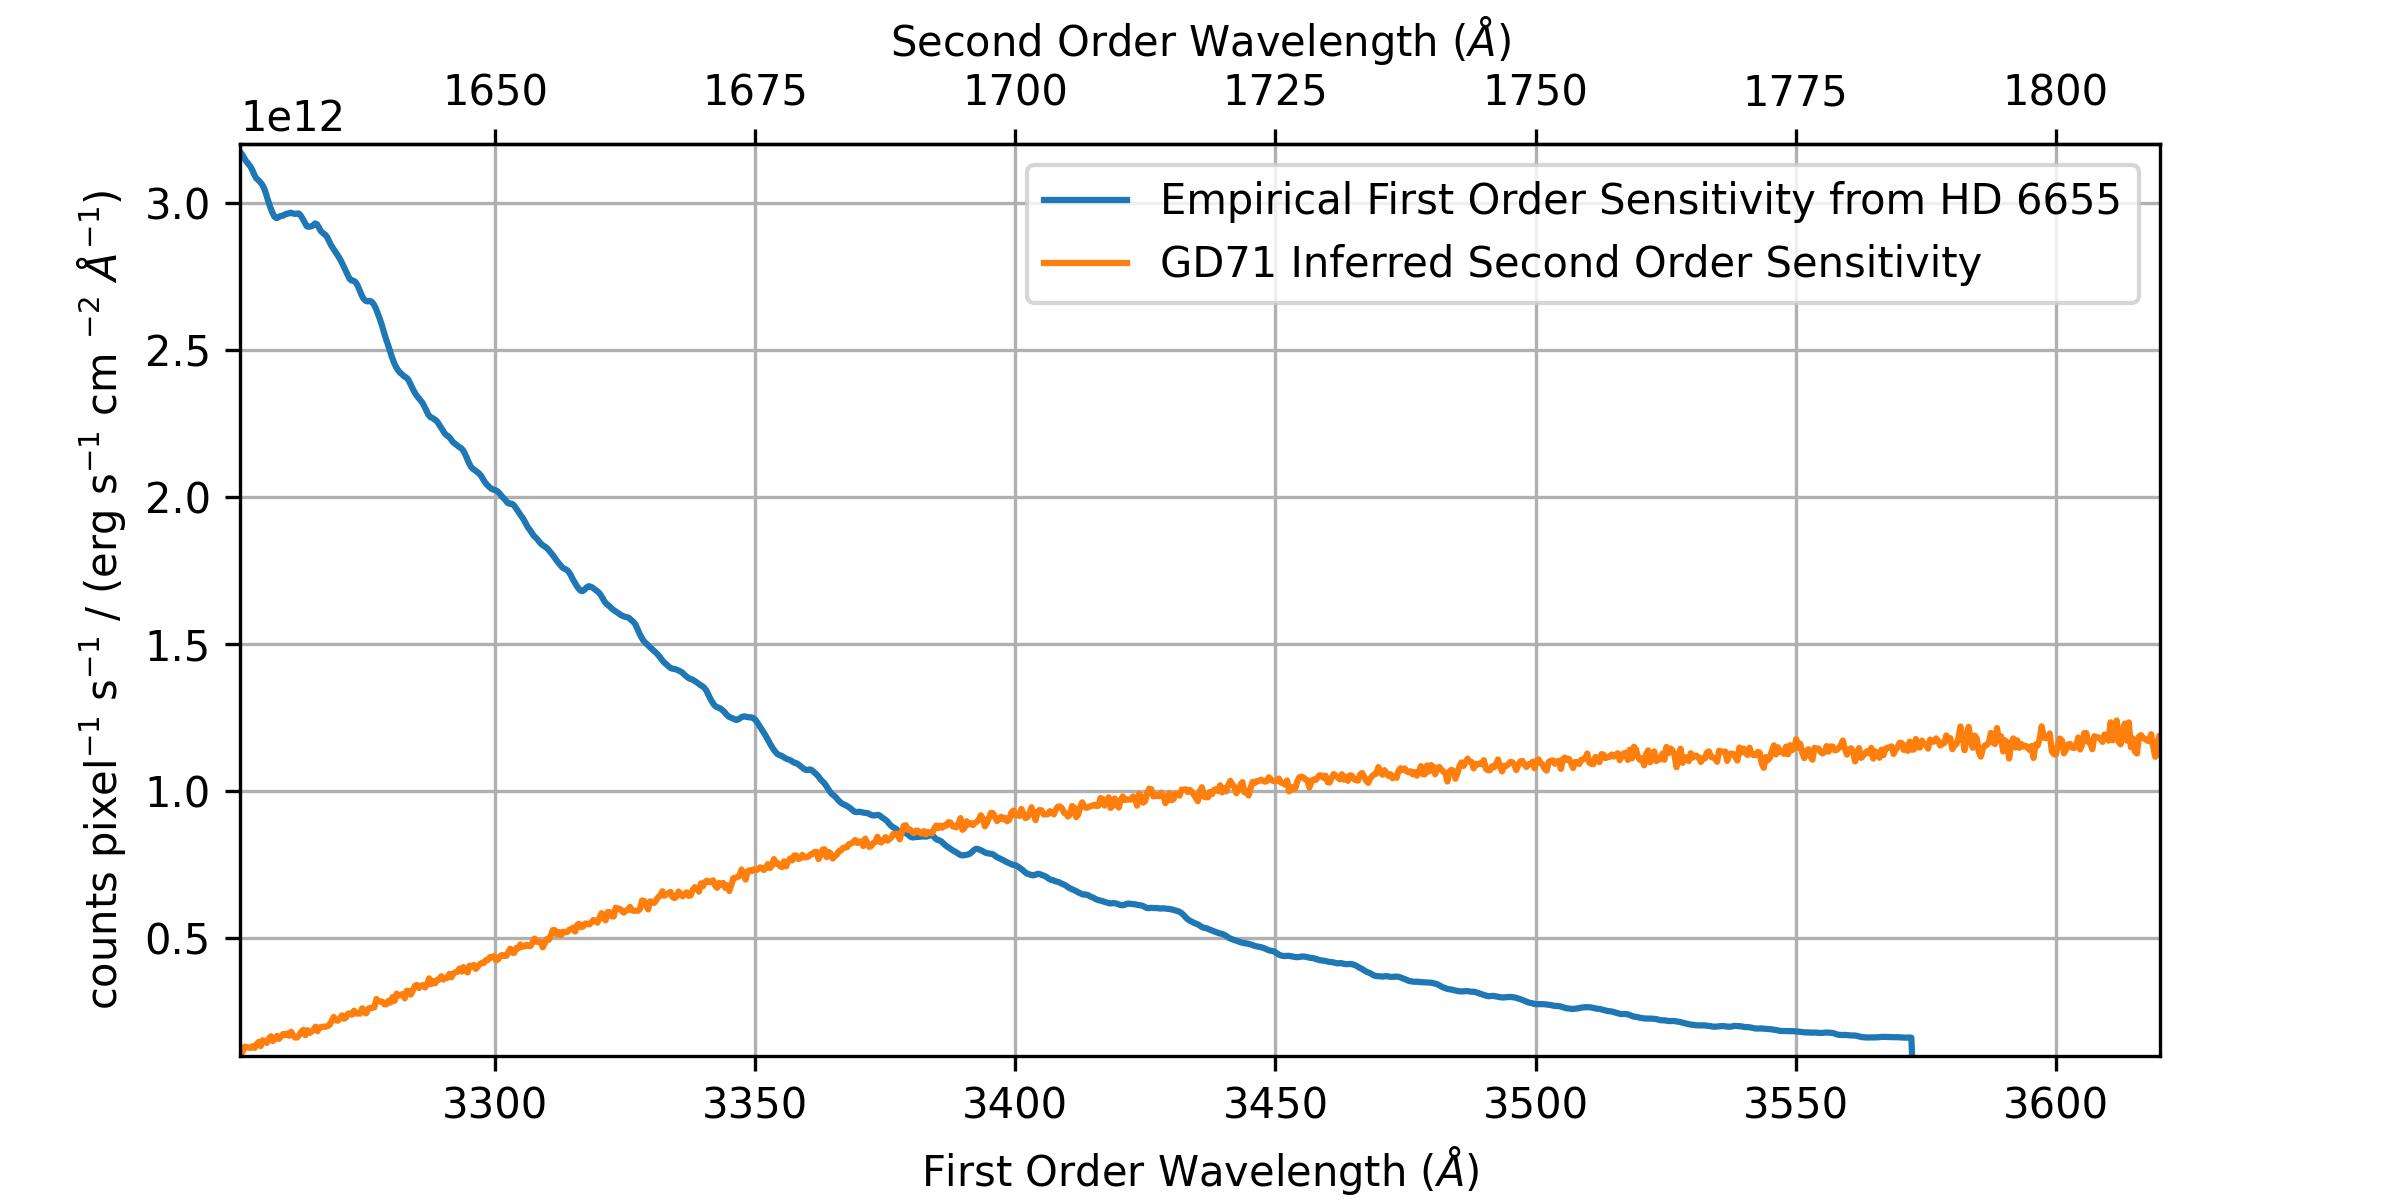
For G230L CENWAVE=3360 observations, Stripe B is contaminated beyond 3200 Å by second-order flux (flux coming from half the wavelength) of the source (COS ISR 2010-01). To allow users to estimate the extent to which their observations might be contaminated, we show estimated first and second order sensitivity curves in Figure 5.4. The first order sensitivity curve has been empirically derived from the NET count-rates of an observation of HD 6655 divided by a Pickles model of an F8V star normalized by its V magnitude. The second order curve is then inferred from observations of the flux standard white dwarf GD71 and its calspec model. The sensitivity curves are equal at lambda ~3380 Å. At this wavelength for a source with a flat spectral energy distribution (SED), the observed spectrum would be contaminated at the 50% level by second order light, with the fraction increasing towards longer wavelengths.
These sensitivity curves have been provided so that the user may understand the extent to which G230L CENWAVE=3360 Stripe B observations can be used in a first or second order mode based on the source SED. These may be particularly relevant, for example, for emission line sources. However, the COS team does not recommend using these curves for flux calibration as they have not been tested to meet COS accuracy requirements.
For all supported cenwaves of G230L, Stripe C, which is sensitive to second order light by design, is contaminated by first order light (COS ISR 2010-01). The exact amount of contamination is unknown at this time, so the flux calibrations of these observations are unreliable. However, with the exception of CENWAVE=2635, all G230L Stripe C observations overlap in spectral coverage with Stripe A. Therefore, such Stripe C observations are only potentially useful if one requires a higher (~factor of 2) resolution but much lower S/N spectrum of a region already covered by NUVA.
In the FUV channel second-order light is present at long wavelengths (λ > 2150 Å) in spectra taken with G140L CENWAVE=1280 FUVA. These photons are rejected by the COS pipeline during processing, but they are available in the "net counts" column of the *x1d*.fits files.
CENWAVE=3360 Stripe B first order sensitivity curve (blue) derived from the NET counts of HD 6655 observations from PID 11474 divided by a Pickles F8V stellar model normalized to V = 8.06. The second order sensitivity curve (orange) is then inferred from observations of GD71 from PID 11479 and calspec model “gd71_mod_012”.5.1.4 Spectroscopic Resolving Power
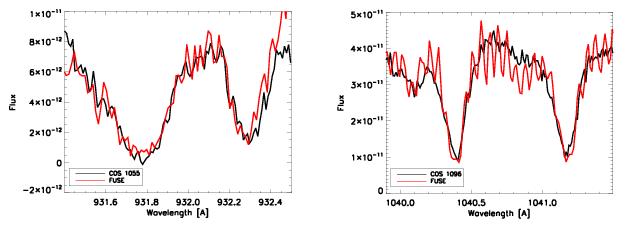
The spectroscopic resolving power (R = λ/FWHM) of each COS grating is listed in Table 5.1, and plotted as a function of wavelength for the FUV gratings in Figure 3.7 and Figure 5.5. These values correspond to the FWHM of the model line-spread functions (LSFs) that are described in Section 3.3, which have been validated with on-orbit measurements (COS ISR 2013-07, COS ISR 2017-06, COS ISR 2018-07). Measurements and model predictions of the resolving power for the 1055, 1096, and 1222 Å central wavelength settings of the G130M grating are shown in Figure 5.5. Adjustments made during Cycle 20 to the focus for the 1055 and 1096 central wavelength settings of the G130M grating have increased their short wavelength resolution by a factor of several over that available before Cycle 20. The quantitative values quoted in Table 5.1 and shown in Figure 5.5 are based on ray-trace models and actual resolution may be slightly different. However, comparison with on-orbit test data appears consistent with the predictions of these models. Users who would benefit from a more rigorous treatment of spectral resolution are referred to the ISRs listed above. An ISR describing the validation of the G130M cenwaves at LP5 is in preparation. The resolution of the G160M cenwaves at LP6 is presented in COS ISR 2023-02. In all cases, users are cautioned that the uncertainties obtained from the validation tests do not support using different cenwaves in the same grating as a means of obtaining different resolutions. A comparison of data obtained with cenwaves 1055 and 1096 with archival FUSE data for the same target is shown in Figure 5.6. Users should note, however, that for each of these modes the focus values have been set to optimize the resolution over a limited part of their wavelength range, and it will be necessary to use multiple settings to get the maximum resolution over the full FUV wavelength range (Figure 5.5).
The COS LSF is not a Gaussian, so simple rules relating R to the observability of narrow spectral features may not apply. Careful modeling of the LSF may be required to determine the feasibility of an observation.
5.1.5 Time-Dependent Sensitivity Changes
Observations of HST primary spectrophotometric standard stars show that there is a significant time dependence of the COS sensitivity for some spectrographic modes. The reflectivity of the G225M and G285M NUV gratings, which are coated with bare aluminum (rather than MgF2 over aluminum like the other gratings), showed a time-dependent degradation before launch that has continued on orbit, decreasing at a rate of ~3% and ~10% per year respectively, independent of wavelength.
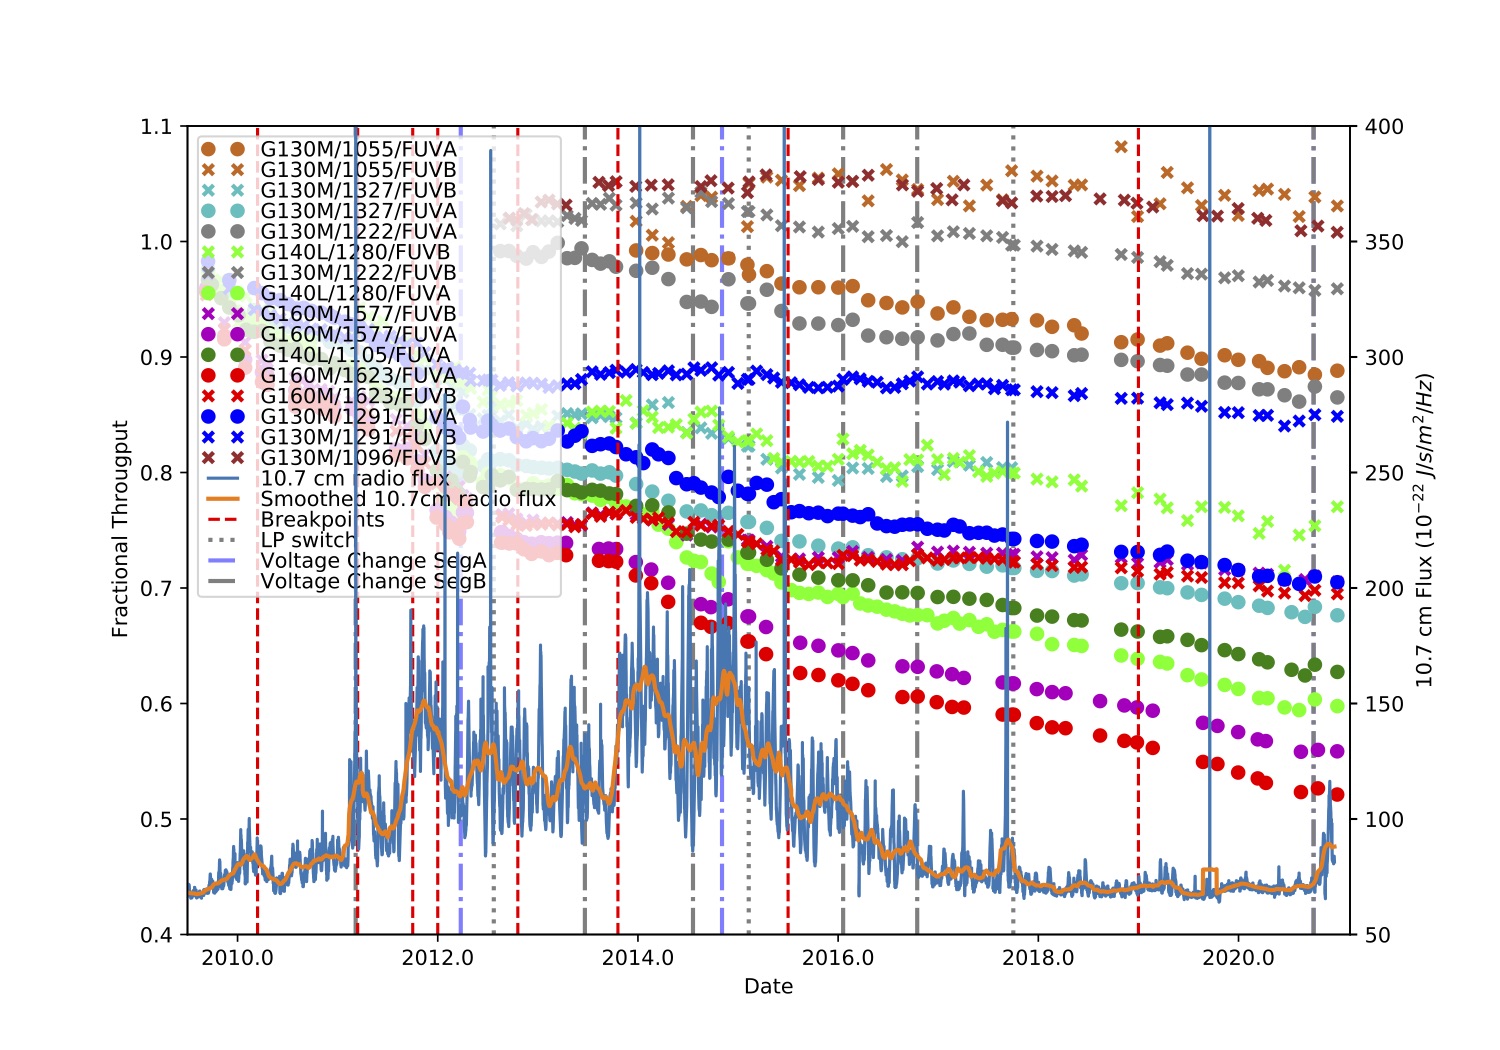
The time variation of the COS FUV sensitivity is shown in Figure 5.7 for different detector segments and central wavelengths. The variations appear to be correlated with Solar activity, and they are consistent with a degradation of the quantum efficiency of the CsI photocathode of the FUV detector caused by reactions with residual atmospheric atomic oxygen. As Solar activity increases, the higher UV flux from the Sun heats the Earthʹs upper atmosphere, inflating it and exposing the open-faced COS FUV XDL detector to increased levels of atomic oxygen. For details, see COS ISR 2011-02 and the COS website.
The COS data-reduction pipeline CalCOS includes a time-dependent sensitivity calibration, and regular monitoring of standard stars is used to update the sensitivity reference files. The ETC reflects the best estimate of current sensitivity.
5.1.6 Dip in Sensitivity around 1180 Å
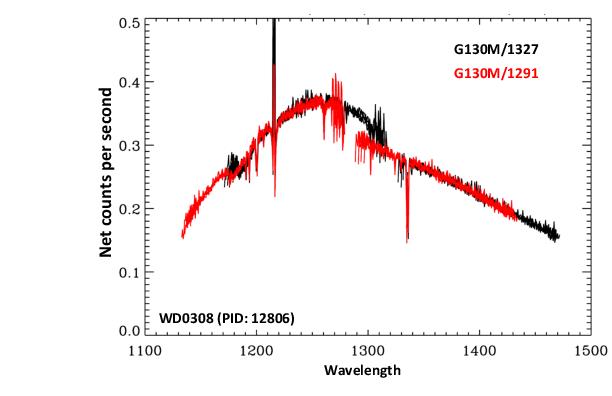
High S/N observations of standard stars have allowed us to uncover a dip in the sensitivity at about 1180 Å that is due to a Wood’s anomaly. Figure 5.8 shows the spectrum of WD0320-539 observed in Program 12086 with the G131M/1291 and G131M/1327 settings. The sensitivity dip, of ~10% of the continuum value, is seen near 1180 Å in the G130M/1291 data and near 1190 Å in the G130M/1327 data. The data shown in Figure 5.8 were taken at the original lifetime position, but this feature is also present in data taken at subsequent lifetime positions. Analysis indicates that this feature is not fixed in pixel or wavelength space, but that it moves to longer wavelengths with increasing CENWAVE settings. More details about this feature and the procedure for correcting it are available in COS ISR 2016-15.
5.1.7 Zero-Order Image
The 800 Å and 1105 Å central-wavelength settings of grating G140L place the zero-order image from the grating on Segment B of the FUV detector, violating detector count-rate screening limits, while a useful first-order spectrum falls onto Segment A. For these central wavelengths, observations can be made only in single-segment mode, with the high voltage for Segment B reduced (Section 5.6). After final alignment of COS on-orbit the zero-order image was also found to fall on Segment B for the 1230 Å setting with FP-POS=4. In Cycle 18, CENWAVE=1230 was replaced with CENWAVE=1280 to keep the zero-order image off the detector. Two-segment observations are allowed for all FP-POS settings with CENWAVE=1280.
5.1.8 Internal Scattered Light
The internal scattered-light level within COS is quite low. In ground-test measurements light scattered along the dispersion axis represents less than 1% of the nearby continuum. On orbit the COS LSF dominates the scattered light (Chapter 3). Scattering within the instrument is negligible (COS ISR 2011-01).
5.1.9 Spatial Resolution and Field of View
The spatial resolution of COS is affected by the mid-frequency wavefront errors (MFWFEs) via the non-Gaussian wings they introduce (Section 3.3). The NUV channel corrects for the telescopeʹs spherical aberration, but not for the MFWFEs. For PSA observations the spatial resolution is ~0.07 arcsec for G185M and G230L, and 0.06 arcsec for G225M and G285M. For BOA observations, the spatial resolution is 0.29 arcsec for G185M, 0.22 arcsec for G225M, 0.24 arcsec for G285M, and 0.30 arcsec for G230L.
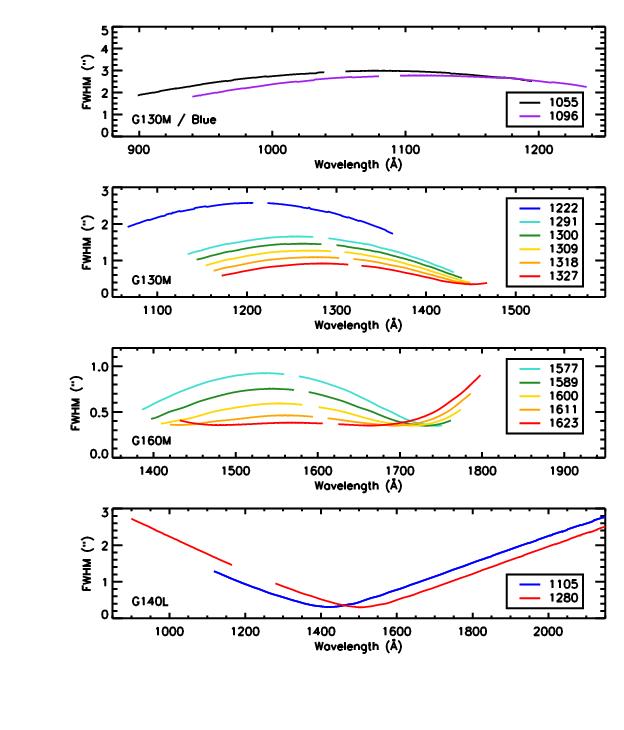
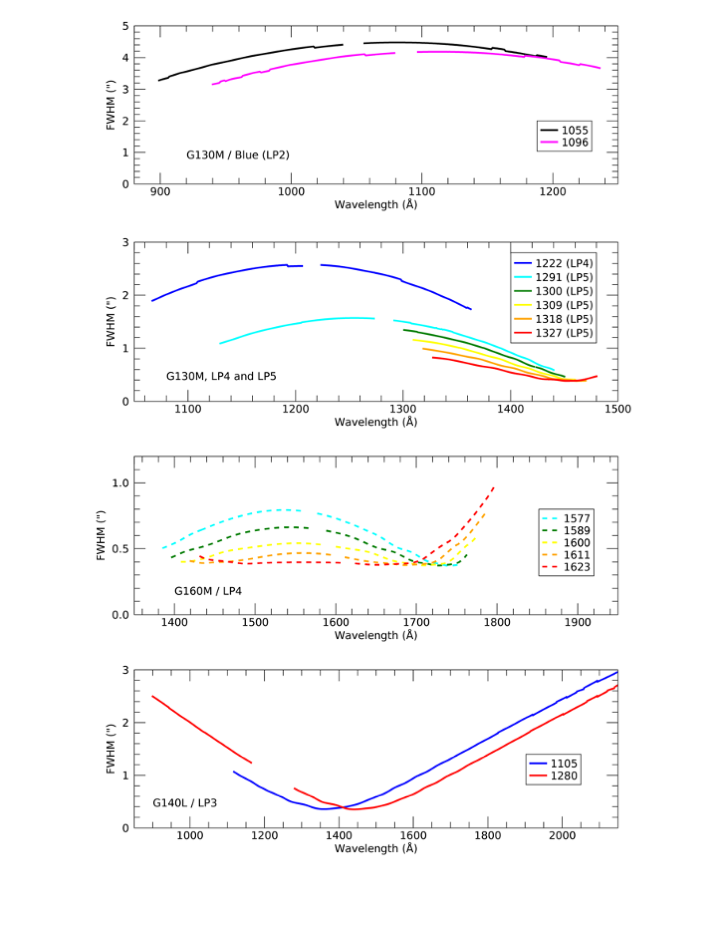
In the FUV the situation is more complex, because of the uncorrected astigmatism in the cross-dispersion direction. Figure 5.9 and Figure 5.10 show the strong dependence on wavelength of the FWHM of the cross-dispersion profiles for each of the FUV gratings at the first and the currently used lifetime positions, respectively. The spatial resolutions at different lifetime positions differ by not more than 3 pixels (0.3 arcsec). At wavelengths for which the profile width is large, the spectra of two objects separated by less than the profile width in the cross-dispersion (XD) direction would be combined.
The COS field of view is determined by the entrance apertures, which are 1.25 arcsec in radius, but the aberrated beam entering the aperture allows objects up to 2 arcsec from the center of the aperture to contribute to the recorded spectrum.
For additional information, please see "FUV Spectroscopic Performance" (COS ISR 2010-09), "NUV Spectroscopic Performance" (COS ISR 2010-08), and "The Spatial Resolution of the COS FUV Channel at Lifetime Position 4" (COS ISR 2018-08).
0
5.1.10 Photometric (Flux) Precision
Based on measurements made during and since SMOV, we estimate that the absolute flux calibration of COS is accurate to about 5% in the FUV, though uncertainties may be larger at wavelengths less than 1150 Å. The relative flux calibration is good to about 2%. In the NUV the calibration is accurate up to 3% for the medium-resolution gratings, and is slightly less accurate in some parts of the G230L bandpass. Time-dependent sensitivity corrections should be accurate to about 2% (Section 5.1.5).
5.1.11 Wavelength Accuracy
The COS medium-resolution channels are required to achieve a wavelength accuracy of 15 km s-1 (resel 0.06 Å). With improvements to the FUV dispersion solutions for the M gratings, the wavelength calibration accuracy has been improved to ±3 pixels, or half a resolution element. For G140L the requirement is 150 km s-1. It is 175 km s-1 for G230L. Analysis of COS data obtained on orbit suggest that these requirements are routinely met. To do so, targets must be properly centered in the desired aperture. Target acquisitions are discussed in Chapter 8.
For modes where the wavelength shift determined from FUV Segment A is applied to Segment B (for example, if there are no wavelength calibration lamp lines present on FUVB) there is an additional uncertainty of up to 10 pixels that must be applied. For the G140L grating this corresponds to a wavelength accuracy of 250 km s-1. Neither the wavelength solution for the BOA nor the throughput at blue wavelengths is well characterized, so we recommend that the BOA not be used for wavelengths bluer than 1200 Å.
5.1.12 Vignetting of the NUV Channel
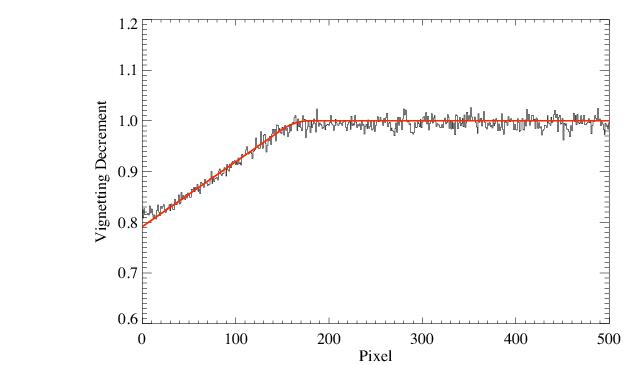
After on-orbit alignment of COS in HST, fluxes of external targets in the PSA were found to be depressed at the short wavelength ends of the NUV stripes. For the medium-resolution gratings the reduction is about 20% at the first pixel and rises linearly to expected levels over approximately the next 160 pixels (Figure 5.11). For G230L the reduction is about 15% at the first pixel and extends about 110 pixels. (The slope is the same as in Figure 5.11; it is as though the ramp were shifted by 50 pixels.) The depression is thought to be due to vignetting of the beam at the NUV camera mirrors that image the spectrum on the detector. Corrections for this vignetting are not included in either the ETC or the CalCOS data-reduction pipeline. Users are advised to consult the COS webpages, where additional information will be posted as it becomes available.
-
COS Instrument Handbook
- Acknowledgments
- Chapter 1: An Introduction to COS
- Chapter 2: Proposal and Program Considerations
- Chapter 3: Description and Performance of the COS Optics
- Chapter 4: Description and Performance of the COS Detectors
-
Chapter 5: Spectroscopy with COS
- 5.1 The Capabilities of COS
- • 5.2 TIME-TAG vs. ACCUM Mode
- • 5.3 Valid Exposure Times
- • 5.4 Estimating the BUFFER-TIME in TIME-TAG Mode
- • 5.5 Spanning the Gap with Multiple CENWAVE Settings
- • 5.6 FUV Single-Segment Observations
- • 5.7 Internal Wavelength Calibration Exposures
- • 5.8 Fixed-Pattern Noise
- • 5.9 COS Spectroscopy of Extended Sources
- • 5.10 Wavelength Settings and Ranges
- • 5.11 Spectroscopy with Available-but-Unsupported Settings
- • 5.12 FUV Detector Lifetime Positions
- • 5.13 Spectroscopic Use of the Bright Object Aperture
- Chapter 6: Imaging with COS
- Chapter 7: Exposure-Time Calculator - ETC
-
Chapter 8: Target Acquisitions
- • 8.1 Introduction
- • 8.2 Target Acquisition Overview
- • 8.3 ACQ SEARCH Acquisition Mode
- • 8.4 ACQ IMAGE Acquisition Mode
- • 8.5 ACQ PEAKXD Acquisition Mode
- • 8.6 ACQ PEAKD Acquisition Mode
- • 8.7 Exposure Times
- • 8.8 Centering Accuracy and Data Quality
- • 8.9 Recommended Parameters for all COS TA Modes
- • 8.10 Special Cases
- Chapter 9: Scheduling Observations
-
Chapter 10: Bright-Object Protection
- • 10.1 Introduction
- • 10.2 Screening Limits
- • 10.3 Source V Magnitude Limits
- • 10.4 Tools for Bright-Object Screening
- • 10.5 Policies and Procedures
- • 10.6 On-Orbit Protection Procedures
- • 10.7 Bright Object Protection for Solar System Observations
- • 10.8 SNAP, TOO, and Unpredictable Sources Observations with COS
- • 10.9 Bright Object Protection for M Dwarfs
- Chapter 11: Data Products and Data Reduction
-
Chapter 12: The COS Calibration Program
- • 12.1 Introduction
- • 12.2 Ground Testing and Calibration
- • 12.3 SMOV4 Testing and Calibration
- • 12.4 COS Monitoring Programs
- • 12.5 Cycle 17 Calibration Program
- • 12.6 Cycle 18 Calibration Program
- • 12.7 Cycle 19 Calibration Program
- • 12.8 Cycle 20 Calibration Program
- • 12.9 Cycle 21 Calibration Program
- • 12.10 Cycle 22 Calibration Program
- • 12.11 Cycle 23 Calibration Program
- • 12.12 Cycle 24 Calibration Program
- • 12.13 Cycle 25 Calibration Program
- • 12.14 Cycle 26 Calibration Program
- • 12.15 Cycle 27 Calibration Program
- • 12.16 Cycle 28 Calibration Program
- • 12.17 Cycle 29 Calibration Program
- • 12.18 Cycle 30 Calibration Program
- • 12.19 Cycle 31 Calibration Program
- Chapter 13: COS Reference Material
- • Glossary
