4.3 CCD Operations and Limitations
HRC has been unavailable since January 2007. Information about the HRC is provided for archival purposes. Please check for updates regarding WFC on the ACS website.
4.3.1 CCD Saturation and Full Well Thresholds
When CCDs are over-exposed, pixels will saturate and excess charge will flow into adjacent pixels along the column. This condition is known as “blooming” or “bleeding.” For the WFC, we make a distinction between the saturation threshold and the full well depth based on a functional difference in the behavior of the detector at two different regimes of charge accumulation. We refer to the saturation threshold/level as the charge level beyond which the CCD pixels integrate further charge sub-linearly and begin to bloom. We refer to the full well depth as the charge level beyond which CCD pixels cannot accumulate any further significant amount of charge (i.e. ~100% blooming). The full well depth is always beyond the saturation level. Both of these thresholds span a range of values across the detector area.
The average value for the WFC saturation level is ~77,400 e–, and ranges between ~72,000 e– to ~82,000 e–. The full well depth of the WFC CCD can reach ~95,000 e– or more. For HRC, no distinction between saturation level and full well depth is made at the present time, and we report the average saturation level/full well depth to be 155,000 e– , but the pixel-to-pixel values vary by ~18% across the detector area. The values for both channels are also given in Table 3.1. See ACS ISR 2020-02 for details on the topics discussed in this section thus far.
Unusual charge overflow from saturated pixels into neighboring pixels in the same row (horizontally) is also present in WFC. This effect is relatively small (<10% of the excess charge from saturated pixels), but proper accounting of the charge in this horizontal blooming, in additional to that lost in vertical blooming, enables high accuracy photometry of arbitrarily saturated sources. More details are provided in ACS ISR 2020-07.
Extreme overexposure does not cause any long-term damage to the CCDs, so there are no bright object limits for the ACS CCDs. When using GAIN = 2 for the WFC and GAIN = 4 for the HRC, the linearity of the detectors deviates by less than 1% up to the saturation levels. On-orbit tests using aperture photometry show that this linearity is maintained when summing over pixels that surround an area affected by charge bleeding, even when the central pixel is saturated by 10 times its full well depth (see ACS ISR 2004-01 and ACS ISR 2019-03 for details).
Note that there is another type of pixel saturation, often referred to as "A-to-D saturation." Since the 16-bit detector electronics can read out a maximum value of 65,535 DN, pixels that would have been read out with values in excess of this are simply read out at this maximum value. These A-to-D saturated pixels are not viable for science. For the WFC, this limitation is never reached when using GAIN = 2, which is presently the only supported gain setting. A recent study (ACS ISR 2020-03) has found that post-SM4 A-to-D saturated pixels can actually have lower values than expected. The CALACS pipeline now flags all post-SM4 pixel values above 64,000 DN as A-to-D saturated.
4.3.2 CCD Shutter Effects on Exposure Times
The ACS camera has a very fast shutter; even the shortest exposure times are not significantly affected by the finite travel time of the shutter blades. On-orbit testing reported in ACS ISR 2003-03 verified that shutter shading corrections are not necessary to support 1% relative photometry for either the HRC or WFC.
Four exposure times are known to have errors of up to 4.1%; e.g., the nominal 0.1 seconds HRC exposure was really 0.1041 seconds. These errant exposure times are accommodated by updates to the reference files used in image pipeline processing. No significant differences exist between exposure times controlled by the two shutters (A and B), with the possible exception of non-repeatability up to ~1% for WFC exposures in the 0.7 to 2.0 second range. The HRC provided excellent shutter time repeatability.
4.3.3 Read Noise
Please check for updates on the ACS website.
WFC
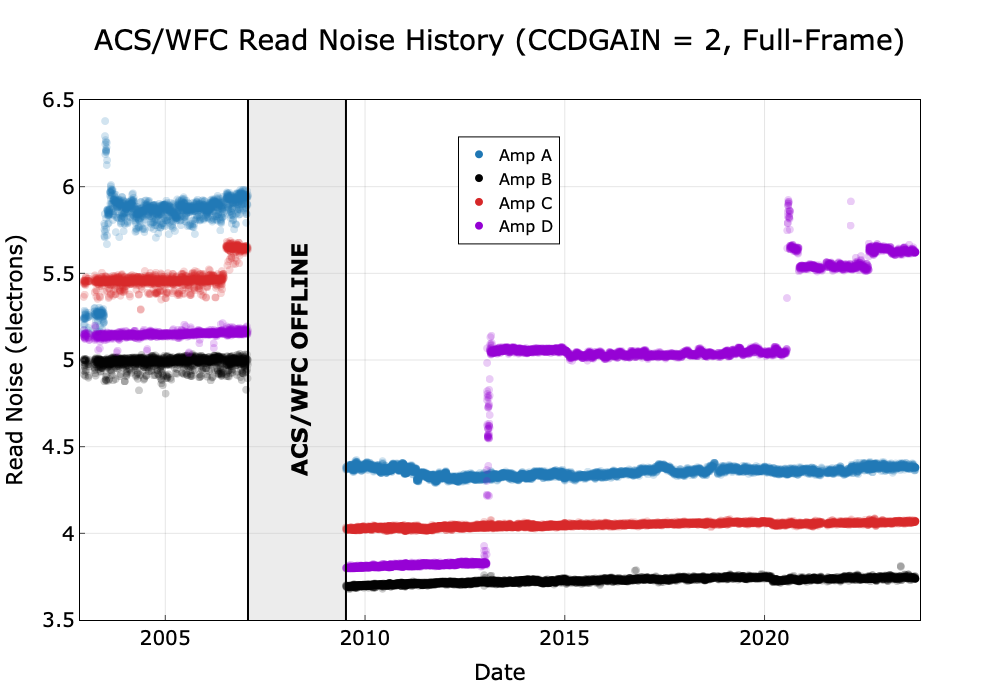
The read noise levels in the physical prescan and imaging regions of the four WFC amplifiers were measured for all gain settings during the orbital verification period following the installation of the CEB-R in SM4. The average WFC read noise is about 25% lower than before SM4 (ACS ISR 2011-04). This reduction is due to the use in the CEB-R of a dual-slope integrator (DSI) in the pixel signal processing chain instead of the clamp-and-sample method of pixel sampling used in the original CEB. The DSI method offers lower signal processing noise at the expense of a spatially variable bias level.
In Figure 4.6, the read noise of the four WFC amplifiers are plotted versus date. The read noise values are steady to ~1% or better, except for five discrete events during the ACS lifetime. Two of these events were associated with ACS electronics changes: 1) a jump in the amplifier C noise after the 2006 failure of the Side 1 electronics, and 2) the overall drop in noise once the ACS was repaired during SM4 in 2009. The three other events, noise increases in amplifier A (June 2003) and amplifier D (January/February 2013 and July 2020), have been ascribed to radiation damage on the detector (ACS TIR 2013-02, ACS TIR 2020-011). Fluctuating read noise levels typically stabilized after subsequent anneals (see Section 4.3.5).
Amplifier D read noise has been slightly unstable since the jump in July 2020, fluctuating between ~5.55 and ~5.65 e– with brief, higher excursions. Although amplifier D now has significantly elevated read noise compared with the other amplifiers, most WFC broad-band observations remain sky-limited rather than read-noise limited. Note also that the WFC pre-defined subarray apertures may now be specified for any amplifier, but we recommend the use of the lowest-noise amplifier B.
Prior to Cycle 24, data taken with the old subarray format experienced slightly increased read noise due to variations in the clocking rate of pixel readout of subarrays relative to full-frame images. The read noise increased with decreasing subarray size, and in the worst case was about 0.15 electrons higher in a 512 × 512 pixel subarray image than in a full-frame image. More information can be found in ACS ISR 2019-02. For subarrays taken in Cycle 24 and after, the method used to read out the detectors was updated, which removed this increased read noise (ACS ISR 2017-03).
HRC
Prior to January 2007, the read noise of the HRC was monitored using only the default amplifier C and the default gain of 2 e–/DN. No variations were observed with time. The read noise measured in the physical prescan and image areas were consistent with the pre-flight values of 4.74 e– (see Table 4.2 and Table 4.3).
4.3.4 Dark Current
Please check for updates on the ACS website.
All ACS CCDs are buried channel devices which have a shallow n-type layer implanted below the surface to store and transfer the collected charge away from the traps associated with the Si-SiO2 interface. Moreover, ACS CCDs are operated in Multi-Pinned Phase (MPP) mode so that the silicon surface is inverted and the surface dark current is suppressed. ACS CCDs therefore have very low dark current. The WFC CCDs are operated in MPP mode only during integration, so the total dark current figure for WFC includes a small component of surface dark current accumulated during the readout time.
Like all CCDs operated in a Low Earth Orbit (LEO) radiation environment, the ACS CCDs are subject to radiation damage by energetic particles trapped in the radiation belts. Ionization damage and displacement damage are two types of damage caused by protons in silicon. The MPP mode is very effective in mitigating the damage due to ionization such as the generation of surface dark current due to the creation of trapping states in the Si-SiO2 interface. Although only a minor fraction of the total energy is lost by a proton via non-ionizing energy loss, the displacement damage can cause significant performance degradation in CCDs by decreasing the charge transfer efficiency (CTE), increasing the average dark current, and introducing pixels with very high dark current (hot pixels). Displacement damage to the silicon lattice occurs mostly due to the interaction between low energy protons and silicon atoms. The generation of phosphorous-vacancy centers introduces an extra level of energy between the conduction band and the valence band of the silicon. New energetic levels in the silicon bandgap have the direct effect of increasing the dark current as a result of carrier generation in the bulk depletion region of the pixel. As a consequence, the dark current of CCDs operated in a radiative environment is predicted to increase with time.
Ground testing of the WFC CCDs, radiated with a cumulative fluence equivalent to 2.5 and 5 years of on-orbit exposure, predicted a linear growth of ~1.5 e–/pixel/hour/year. The dark current in ACS CCDs is monitored three days per week with the acquisition of four 1000-second and two 0.5-second dark frames, totaling 12 "long" and six "short" dark images per week. These calibration frames also include post-flash as of January 2015 (see below for more information). Dark frames are used to create reference files for the calibration of scientific images, and to track and catalog hot pixels as they evolve. The dark reference files are generated by combining one month of long and short darks in order to remove cosmic rays and reduce the statistical noise. As expected, the dark current increases with time. From 2011 to 2023, the observed linear growth rates of dark current are 2.69 and 2.65 e–/pixel/hour/year for WFC1 and WFC2 respectively. Prior to 2007, the observed linear growth rate of dark current was 2.5 e–/pixel/hour/year for the HRC CCD.
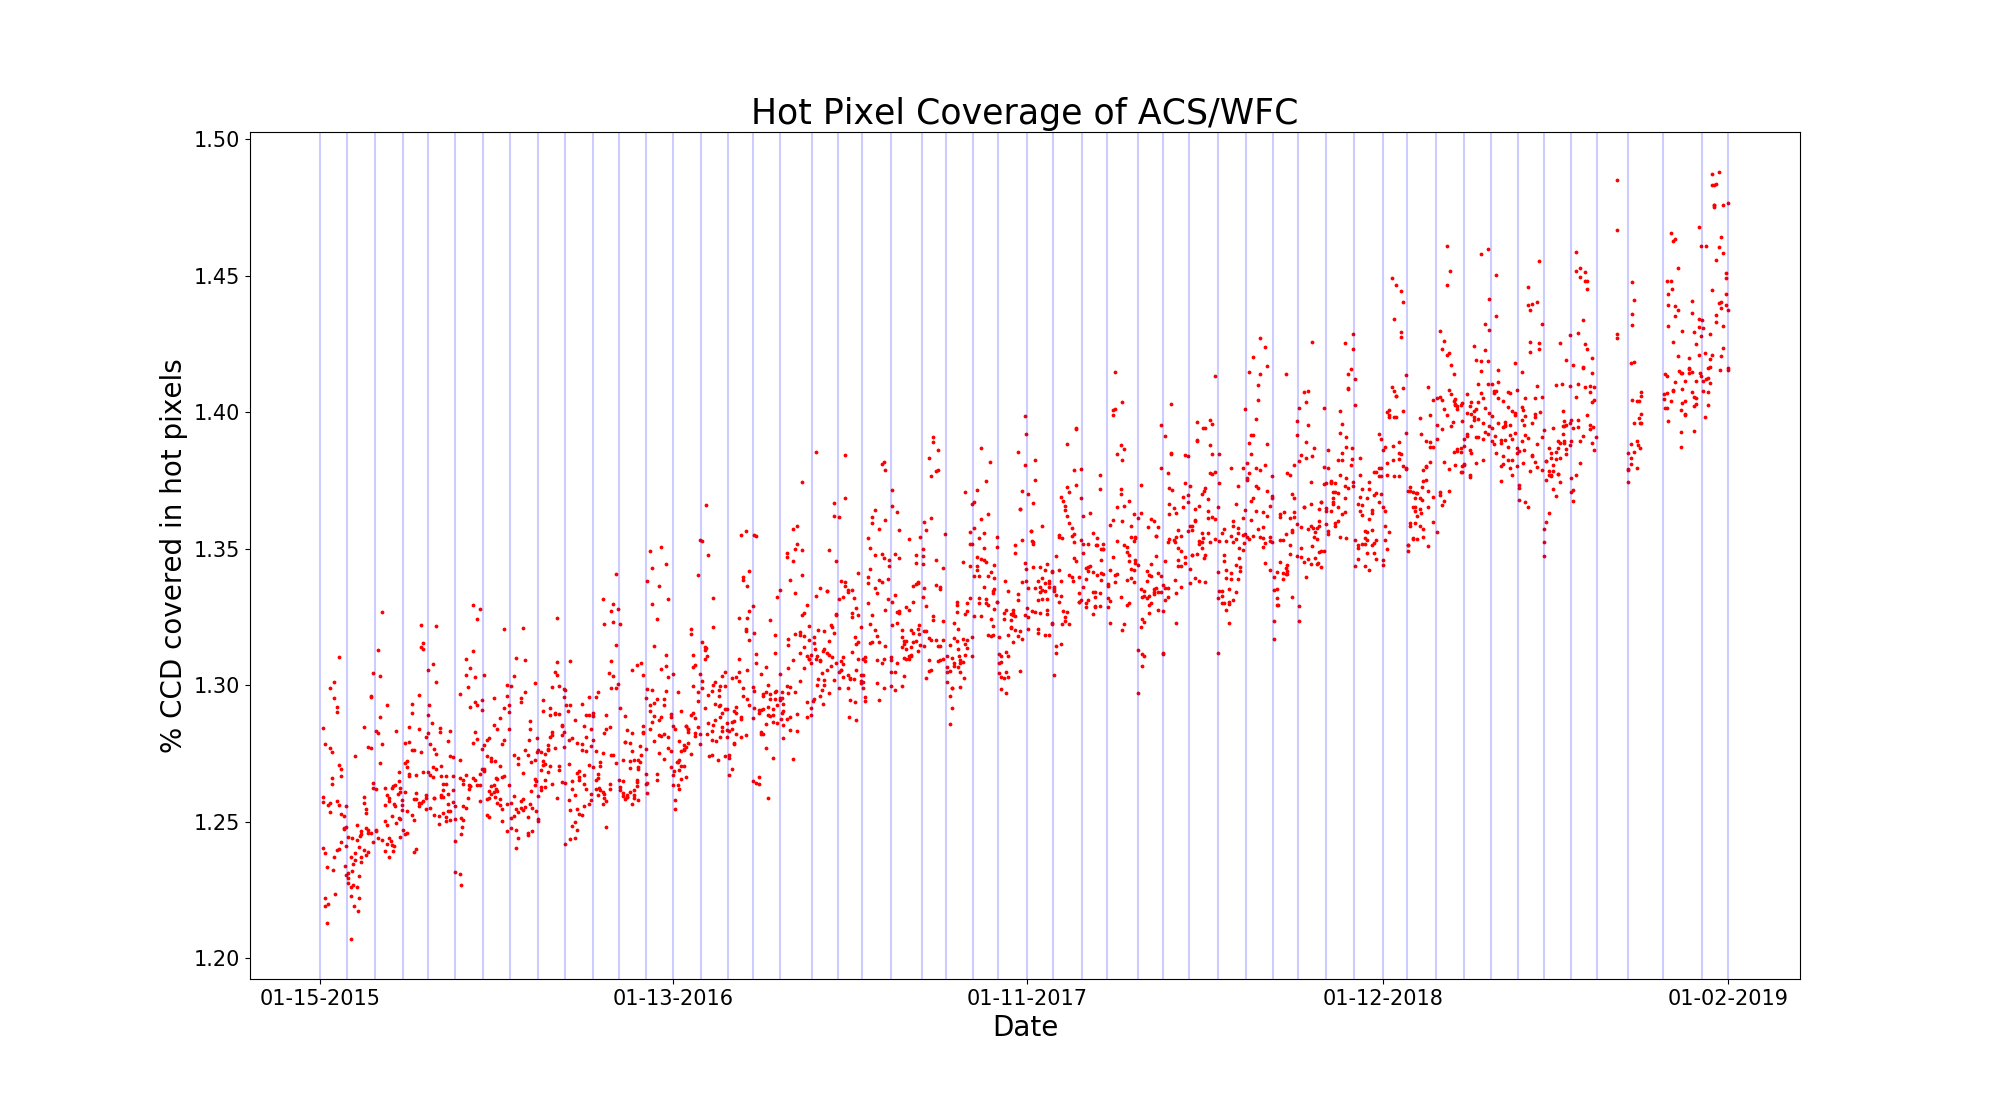
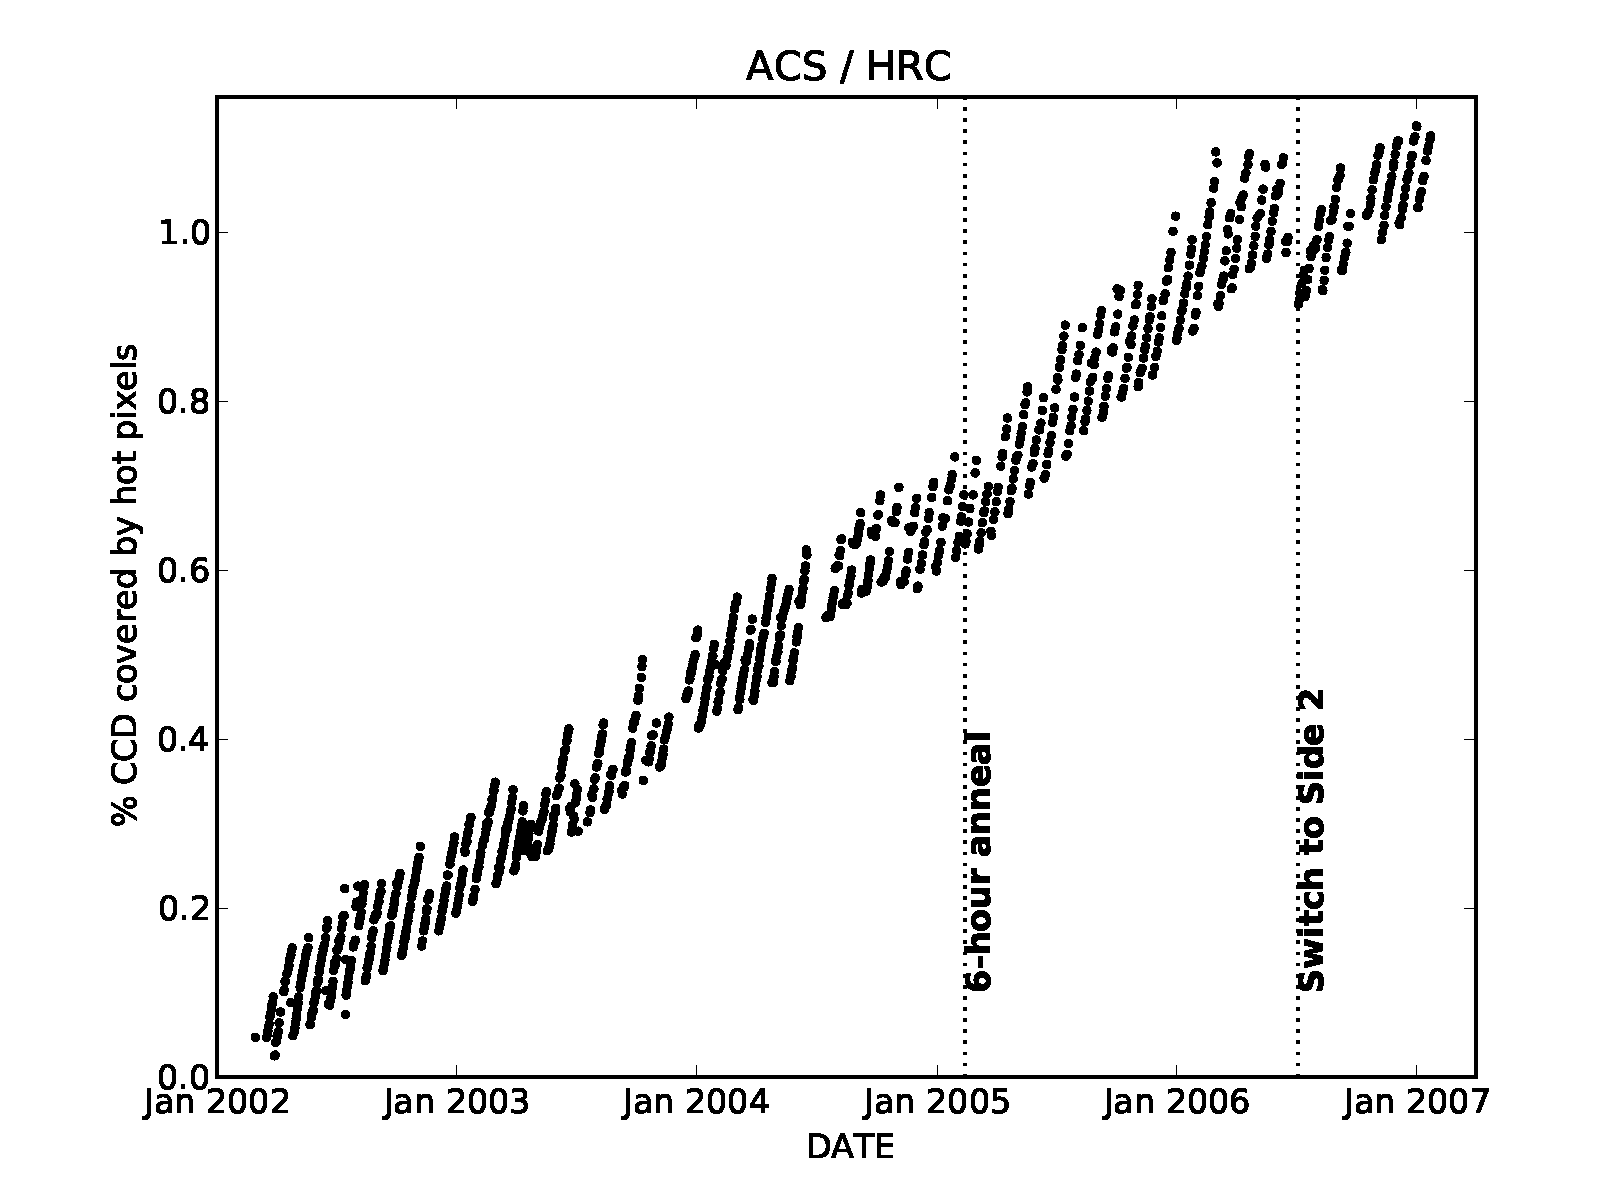
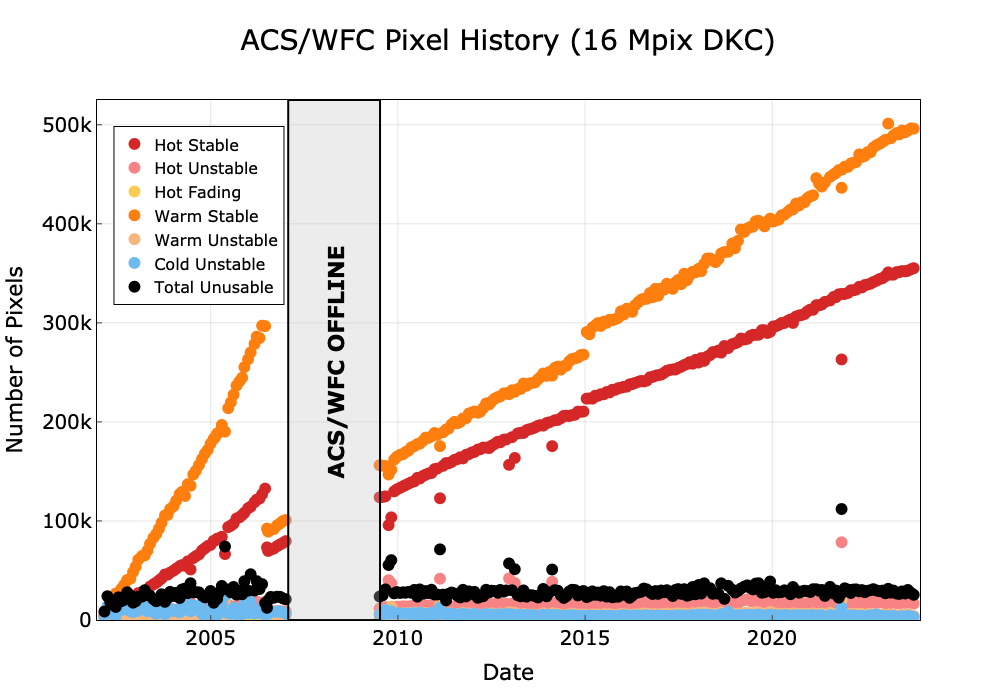
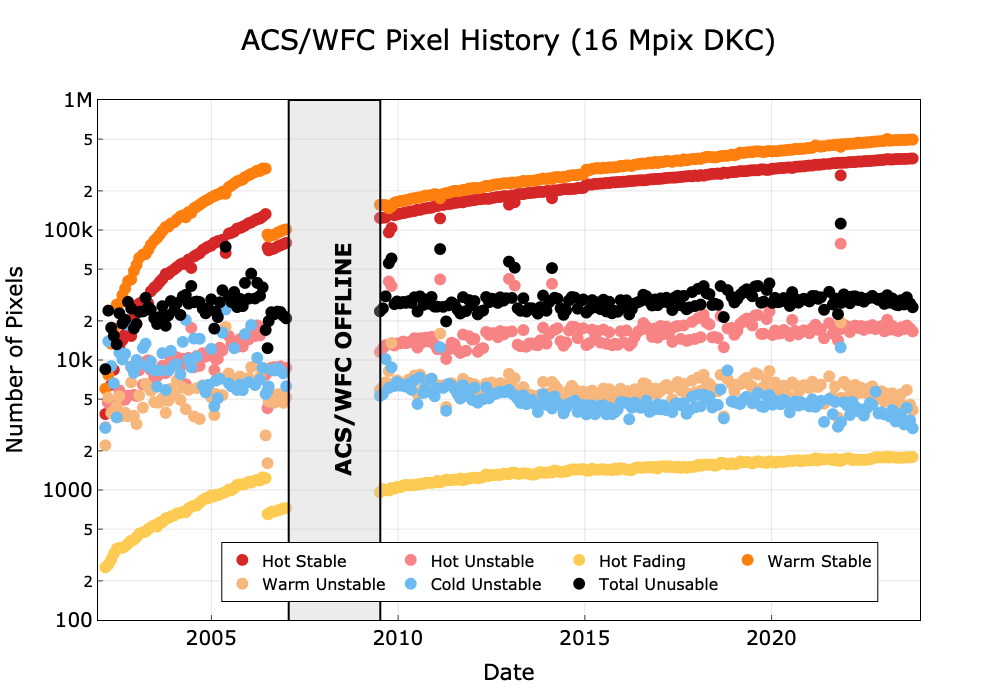
At the beginning of the Side 2 operation in July 2006, the temperature set point of the WFC was lowered from –77 °C to –81 °C (documented in ACS TIR 2006-021). Dark current and hot pixels depend strongly on the operating temperature. The reduction of the operating temperature of the WFC CCDs reduced the number of hot pixels by almost 50% (see Figure 4.8) and reduced the dark current in both WFC1 and WFC2. The dark rate shows a clear drop on July 4, 2006, when the temperature was changed. The new operating temperature brought the dark current of the WFC CCDs back to the level it was eighteen months after the launch.
Since January 2015, all dark frames taken as part of the CCD Daily Monitor calibration program are post-flashed, i.e., the exposures are illuminated with the LED to mitigate the effects of CTE losses (ACS ISRs 2015-03 and 2020-06). This has resulted in a slight increase in the noise of the final superdark images, but a more accurate representation of the dark current and hot/warm pixels. The higher background level provided by the flash alleviates the effects of CTE. As of December 2023, the dark current has been measured to be 49 to 60 e–/pixel/hour among the four amplifiers.
We note that the commanding overheads of WFC introduce an additional few seconds of dark current integration time beyond the commanded exposure time and post-flash duration, if used. This additional time is included in the dark current correction step of the CALACS pipeline (see the ACS Data Handbook for further details).
4.3.5 Warm and hot pixels
Please check for updates on the ACS website.
In the presence of a high electric field, the dark current of a single pixel can be greatly enhanced. Such pixels are called hot pixels. Although the increase in the mean dark current with proton irradiation is important, of greater consequence is the large increase in dark current nonuniformity (see Table 4.4).
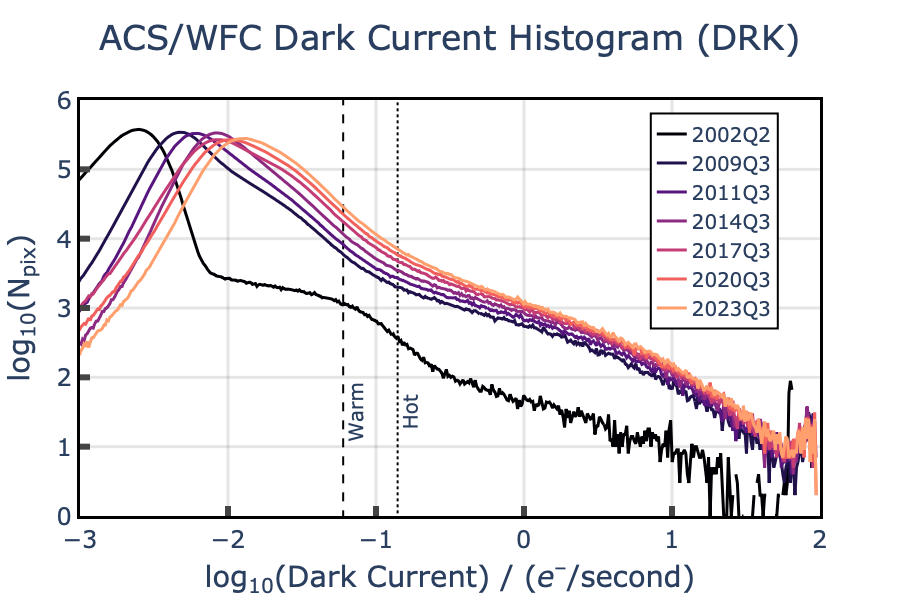
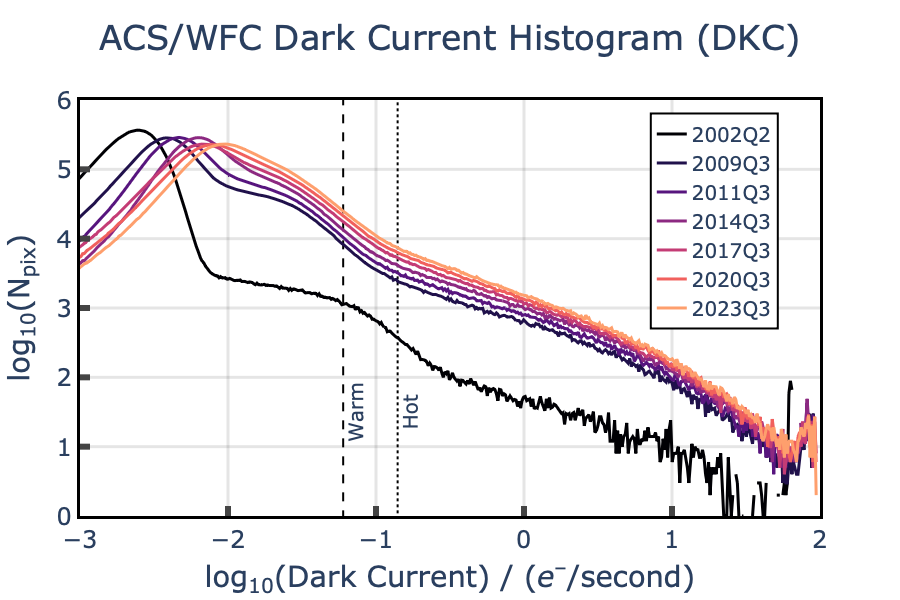
We have chosen to classify the field-enhanced pixels into two categories: warm and hot pixels. The definition of "warm" and "hot" pixel is somewhat arbitrary, and there have been several changes to the definition of warm and hot pixel throughout the lifetime of ACS. The values associated with these flags over time are summarized in Table 4.5. In January 2015 we adjusted the ranges of hot and warm pixels as follows; a pixel above 0.14 e–/pixel/second is considered a "hot" pixel. A pixel below the hot pixel range but above 0.06 e–/pixel/second is considered a "warm" pixel. The new values were chosen by comparing the hot and warm pixel percentages found in the years following SM4 (ACS ISR 2015-03). For consistency, all archived WFC observations were updated in early 2018 to use the current warm and hot pixel definitions.
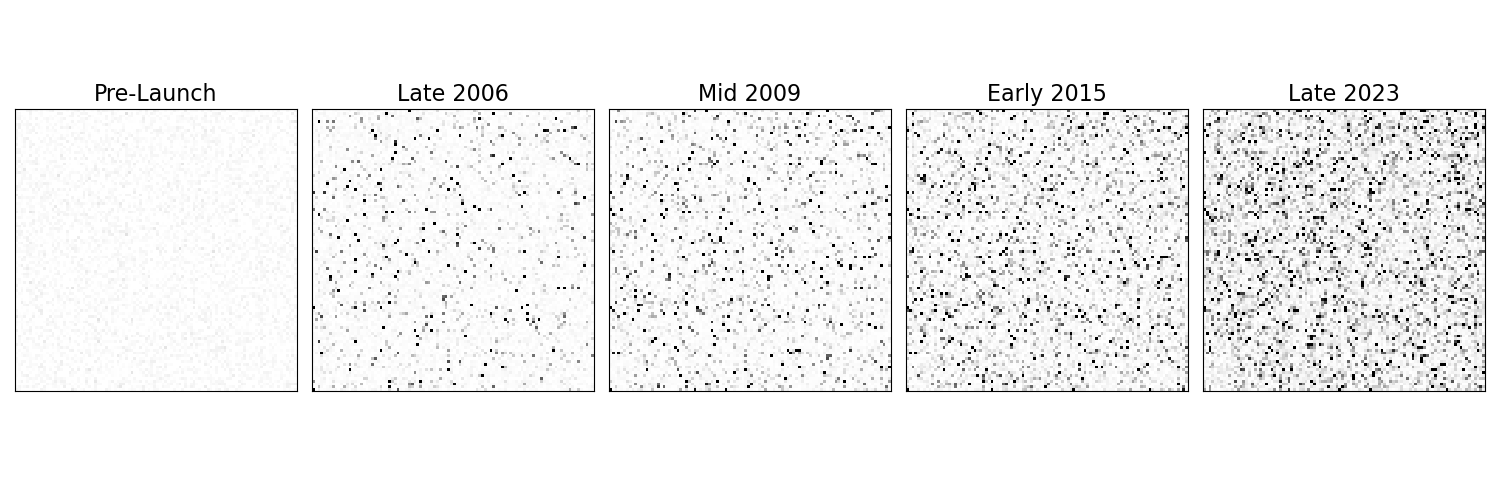
Warm and hot pixels accumulate as a function of time on orbit. Defects responsible for elevated dark rate are created continuously as a result of the ongoing displacement damage on orbit. The one-time reduction of the WFC operating temperature in 2006 dramatically reduced the overall dark current and hot pixel fraction but, by 2011, these values had degraded past their previous levels (see Table 4.4).
Table 4.4: Creation rate of new warm, hot, and unstable pixels (% of detector per year).
Pixel Type | WFC (–81 °C) |
Warm Stable (0.06 - 0.14 e–/pix/sec) | 0.16 |
Hot Stable (0.14 - 20 e–/pix/sec) | 0.10 |
Total Unstable | ~0 |
Many hot pixels are transient. Like other CCDs on HST, the ACS WFC undergoes a monthly annealing process. The WFC CCDs and the thermal electric coolers are powered off, and heaters are powered on to warm the CCDs to ~20 °C (ACS ISR 2020-05). Although the annealing mechanism at such low temperatures is not yet understood, after this "thermal cycle" the population of hot pixels is slightly reduced (see Figure 4.7 for examples). The anneal rate depends on the dark current rate; very hot pixels are annealed more easily than warm pixels. For pixels classified as "hot" (those with dark rate > 0.14 e–/pix/sec for WFC, and > 0.08 e–/pix/sec for HRC) the anneal heals ~3% for WFC and ~14% for HRC.
Table 4.5: Hot and Warm Pixel Flags Over the History of ACS
Dates | Warm pixel flag (e–/s) | Hot pixel flag (e–/s) |
Launch - Oct 8 2004 | Not used | Static hot pixel list |
Oct 8 2004 - Jan 2007 (Pre SM4) | 0.02 - 0.08 | ≥0.08 |
May 2009 (SM4) - Jan 15 2015 | 0.04 - 0.08 | ≥0.08 |
Jan 15 2015 - present | 0.06 - 0.14[a] | ≥0.14[a] |
a In 2018, the ACS team re-calibrated all historical WFC observations to use the same warm and hot pixel thresholds of 0.06 and 0.14 e-/s, respectively
Annealing has no effect on the normal pixels that are responsible for the increase in the mean dark current rate. Such behavior was also seen with STIS and WFC3 CCDs during ground radiation testing. Since the anneal cycles do not repair 100% of the hot pixels, there is a growing population of permanent hot pixels (see Figures 4.8, 4.9, and 4.10).
Stable warm and hot pixels are eliminated by the superdark subtraction. However, some pixels show a dark current that is not stable with time but switches between well-defined levels. These fluctuations may have timescales of a few minutes and have the characteristics of random telegraph signal (RTS) noise (ACS ISR 2017-05). In addition, many field-enhanced hot pixels have dark rates that decrease with exposure time, i.e., they fade during an exposure. This effect becomes significant for dark rates above 20 e-/pix/s, such that these fading hot pixels cannot be properly dark-corrected (ACS ISR 2022-07). The dark current in field-enhanced hot pixels can be dependent on the signal level, so the noise also is much higher than the normal shot noise.
The locations of warm and hot pixels are known from dark frames, so they are flagged in the DQ array. Unstable pixels of any dark current level and fading hot pixels are also flagged in the DQ array (DQ flag 32). By default, only unstable pixels and fading hot pixels are discarded during image combination if multiple exposures are combined as part of a dither pattern (stable hot pixels are retained). In Figure 4.8, we show the prevalence of unstable pixels of various dark current levels over the lifetime of ACS/WFC.
Using a CR-SPLIT approach allows rejection of cosmic rays, but hot pixels cannot be eliminated in post-observation processing without dithering between exposures.
Observers who previously used CR-SPLIT for their exposures are advised to use a dither pattern instead. Dithering by at least a few pixels allows the removal of cosmic rays, hot pixels, and other detector artifacts in post-observation processing.
For example, a simple ACS-WFC-DITHER-LINE pattern has been developed that shifts the image by two pixels in X and two pixels in Y along the direction that minimizes the effects of scale variation across the detector. The specific parameter values for this pattern are given on the ACS Dither webpage.
Additional information can be found in the Phase II Proposal Instructions.
4.3.6 Sink Pixels
Sink pixels are pixels in a CCD detector that are anomalously low compared to the background, due to the presence of extra charge traps. These charge traps can trap electrons in the sink pixel itself and also trap electrons from pixels that are transferred through the sink pixel during the readout process, giving rise to a low-valued trail following the sink pixel. The length of the trail depends on the background level of the image, in that images with higher backgrounds exhibit shorter sink pixel trails. In addition, about 30% of the time, a charge excess is found in the pixel immediately downstream of the sink pixel, closer to the amplifier. About 0.3 to 0.5% of pixels in the WFC detector are considered sink pixels in a given anneal cycle. Depending on the background level of an image, in total, about 3% of pixels in an image are sink pixels or affected by sink pixels. These pixels are flagged with DQ flag 1024 in all WFC images observed after January 15, 2015. Sink pixels are identified in post-flashed dark frames, which were obtained beginning in January 2015. More details can be found in ACS ISR 2017-01.
4.3.7 Cosmic Rays
Studies have been made of the characteristics of cosmic ray (CR) impacts on the HRC and WFC. The fraction of pixels affected by cosmic rays varies from 1.5% to 3% during a 1000 second exposure for both cameras, similar to what was seen on WFPC2 and STIS. This number provides the basis for assessing the risk that the target(s) in any set of exposures will be compromised. The affected fraction is the same for the WFC and HRC despite their factor of two difference in pixel areas. This is because the census of affected pixels is dominated by charge diffusion, not direct impacts. Observers seeking rare or serendipitous objects, as well as transients, may require that every single WFC pixel is free from cosmic ray impacts in at least one exposure among a set of exposures. For the cosmic ray fractions of 1.5% to 3% in 1000 seconds, a single ~2400 second orbit must be broken into four exposures (500 to 600 seconds each) to reduce the number of pixels affected by CRs in every exposure to one or fewer. Users requiring lower read noise may prefer three exposures of ~800 seconds, in which case CR-rejection should still be very good for most purposes. Two long exposures (i.e., 1200 seconds) are not recommended because residual CR contamination would be unacceptably high in most cases. We recommend that users dither these exposures to remove hot pixels as well as cosmic rays (see Section 7.4).
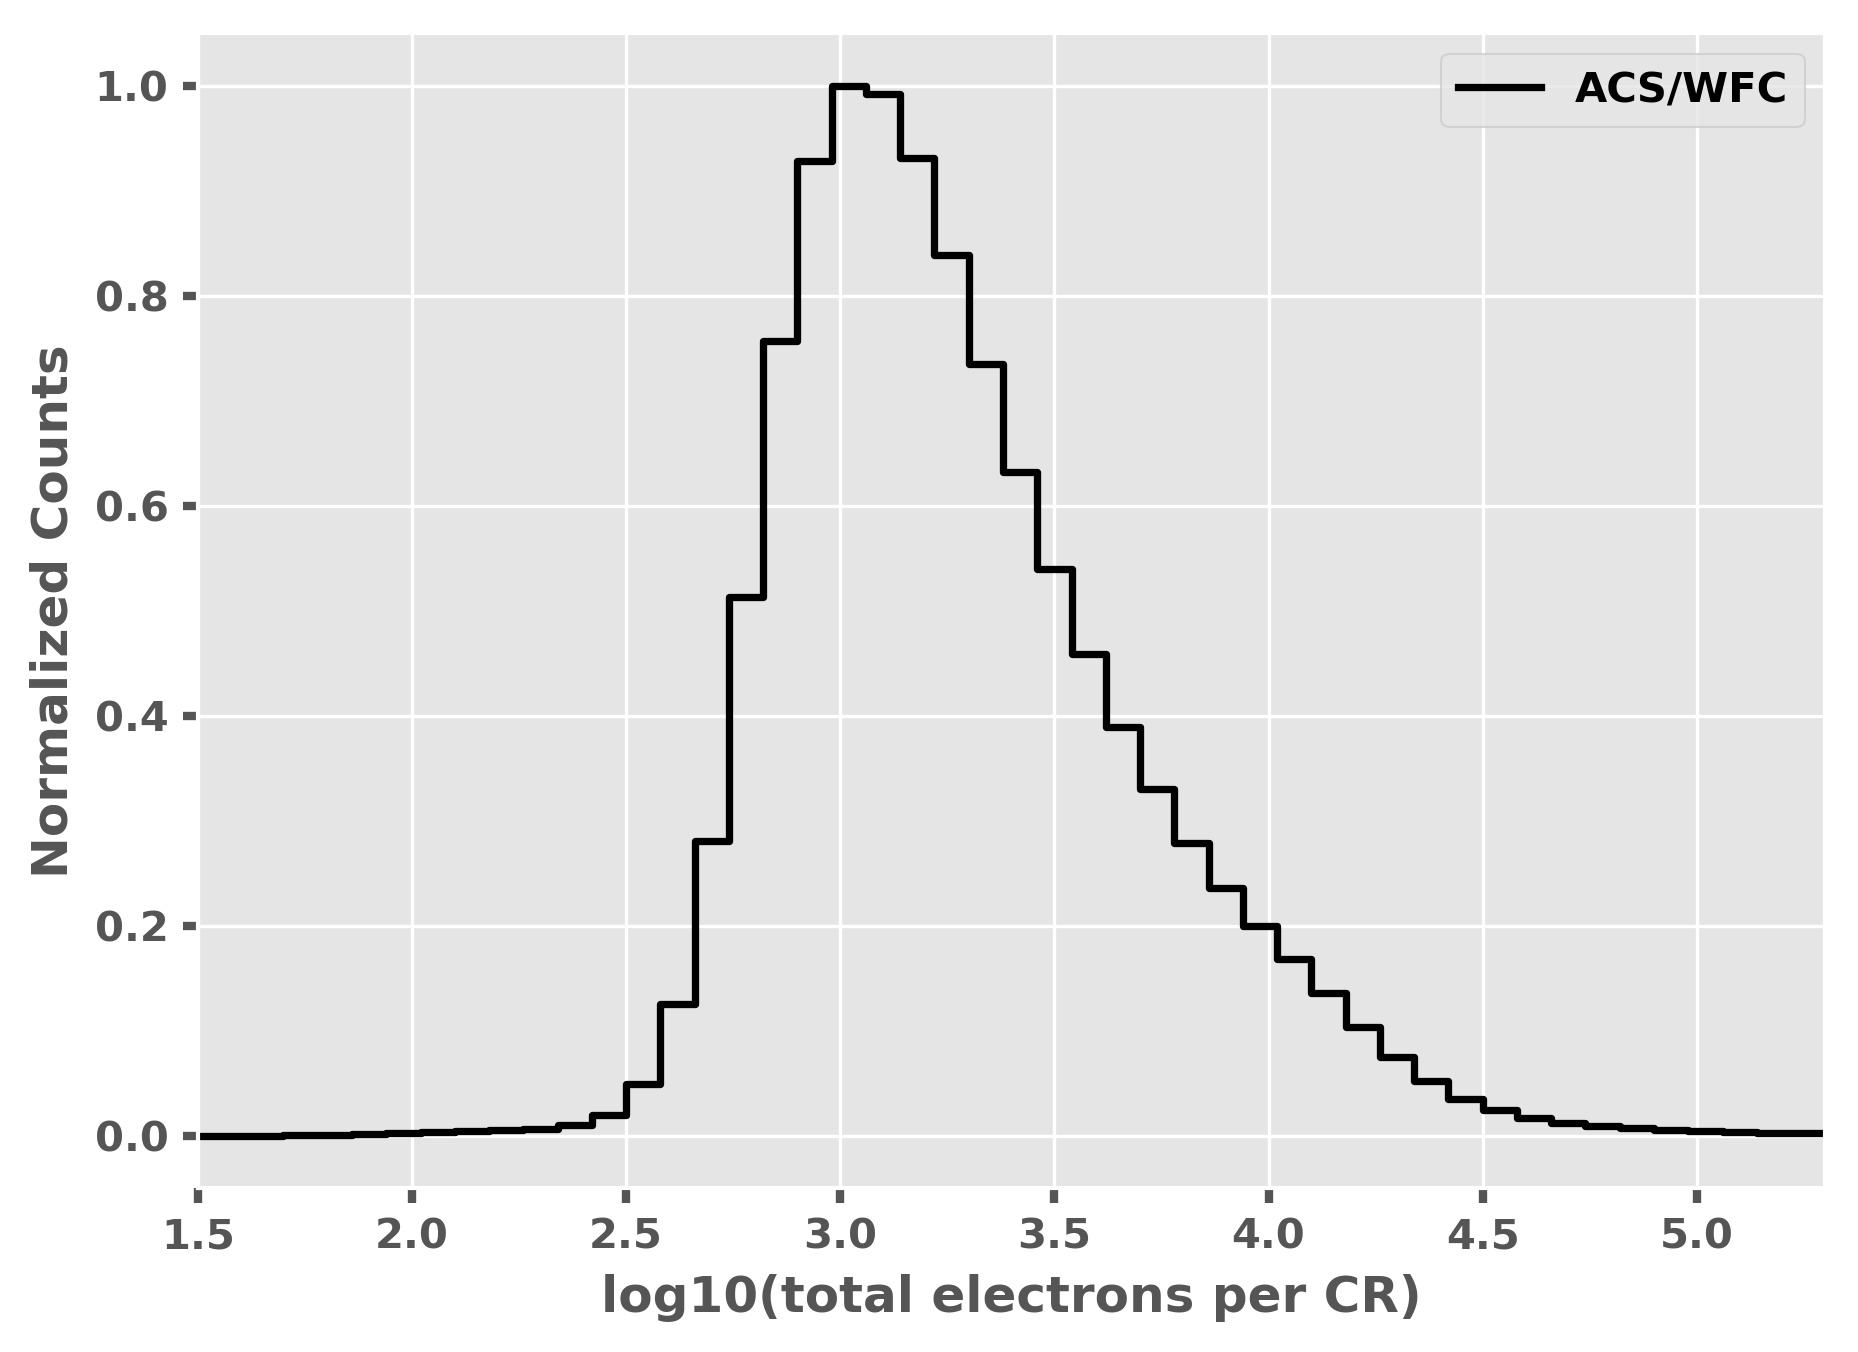
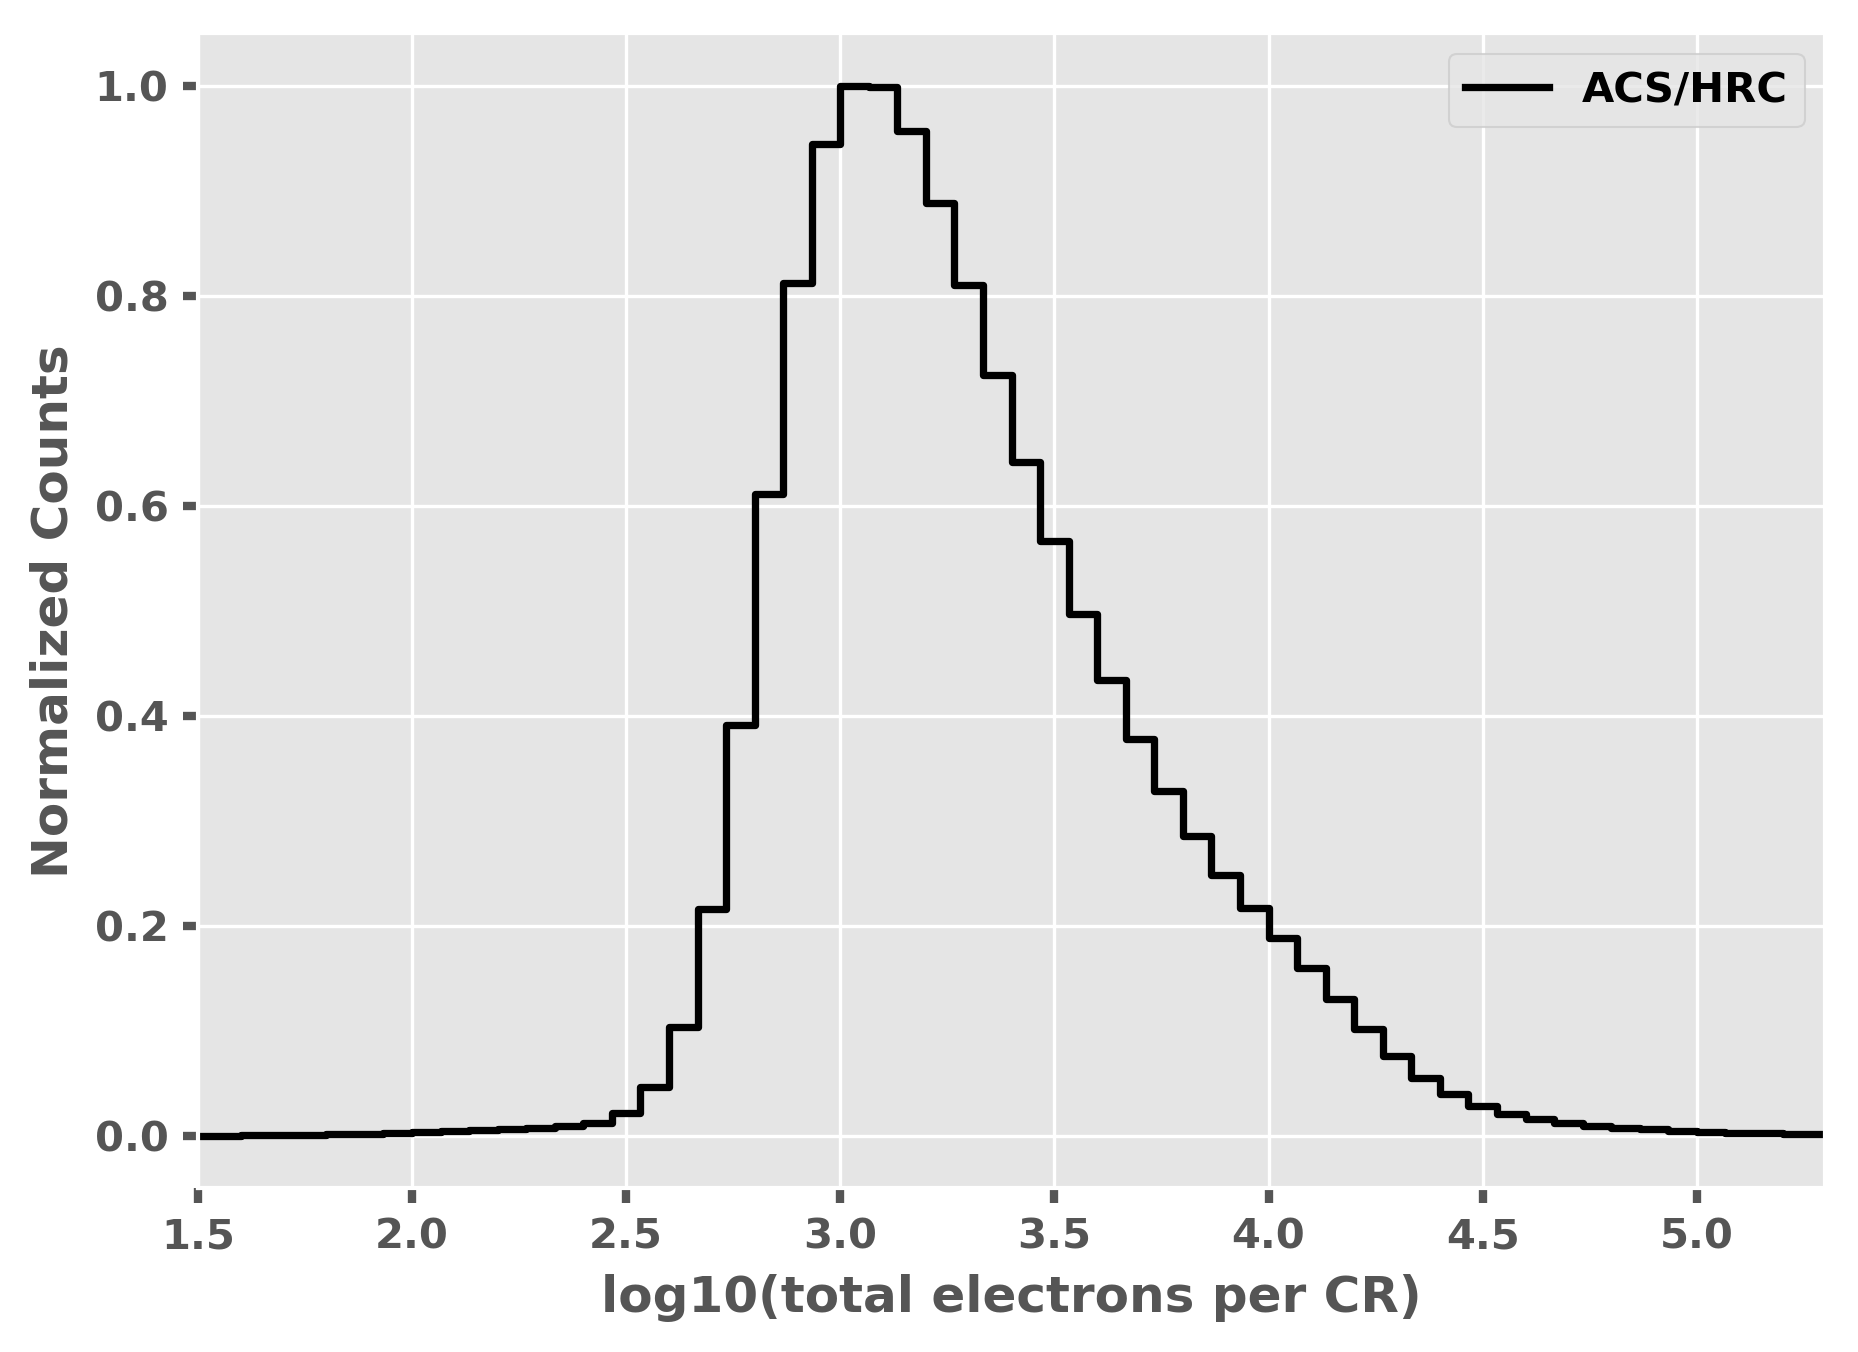
The flux deposited on the CCD from an individual cosmic ray does not depend on the energy of the cosmic ray, but rather the distance it travels in the silicon substrate. An analysis of 13,311 WFC darks and 5,477 HRC darks demonstrates that the interaction of high energy cosmic rays with the silicon substrate has a very well-defined distribution (Miles et al. 2021). The peak of the distribution occurs at ~1000 electrons and the distribution has a clear cut-off below ~500 electrons (see Figures 4.11 and 4.12).
The standard deviation of deposited energy can be useful for distinguishing cosmic rays from astrophysical sources in a single image. The median of the standard deviation distributions for HRC and WFC are 0.5 and 0.6 pixels, respectively (Miles et al. 2021). This is much narrower than the PSF and is thus a useful discriminant between unresolved sources and cosmic rays.
4.3.8 Charge Transfer Efficiency
Please check for updates on the ACS website.
Charge transfer efficiency (CTE) is a measure of how effectively the CCD moves charge between adjacent pixels during readout. A perfect CCD would be able to transfer 100% of the charge as it is shunted across the CCD and out through the serial register. In practice, small traps in the silicon lattice compromise this process by holding on to electrons, releasing them at a later time. Depending on the trap type, the release time ranges from a few microseconds to several seconds. For large charge packets (several thousands of electrons), losing a few electrons during readout is not a serious problem, but for smaller (~100e– or less) signals, it can have a substantial effect.
The CTE numbers for the ACS CCDs at the time of installation are given in Table 4.6. While the numbers look impressive, reading out the WFC CCD requires 2048 parallel and 2048 serial transfers, which leads to almost 2% of the charge from a pixel in the corner opposite to the readout amplifier being lost during readout.
Table 4.6: Charge transfer efficiency measurements of the ACS CCDs prior to installation from Fe55 experiments (Sirianni et al. 2000, Proc. SPIE 4008)
CCD | Parallel | Serial |
WFC1 | 0.999994 | 0.999999 |
WFC2 | 0.999995 | 0.999998 |
HRC | 0.999997 | 0.999998 |
Like other CCD cameras aboard HST, WFC has suffered degraded CTE due to radiation damage since its installation in 2002. Since 2003, specific calibration programs aimed at characterizing the effects of the CTE on stellar photometry have been performed. Results from the internal CTE monitor program shows that CTE appears to decline linearly with time, and that CTE losses are stronger for lower signal levels (ACS ISR 2005-03, ACS ISR 2018-09).
In order to derive an accurate CTE correction formula for point-source photometry, a number of observations at different epochs, sky backgrounds, and stellar fluxes have to be accumulated. The results of the observations taken through November 2011 are described in several ISRs (ACS ISR 2009-01, ACS ISR 2011-01, ACS ISR 2012-05, ACS ISR 2022-06) and are summarized here. Yearly monitoring observations result in regular updates the correction formula. Significant photometric losses are apparent for stars undergoing numerous parallel transfers (y-direction). As of 2023, the CTE loss was ~33% for a fiducial 100e– star at the center of the CCD with a typical background of 30e–. This loss can rise to >50% in worst cases (faint sources, low backgrounds, farthest from the CCD serial register), rendering faint sources undetectable and thus unrecoverable with current pixel-based CTE correction algorithms.
However, ACS ISR 2022-04 shows that when the background is 40e– or greater, even the faintest stars retain >50% of their electrons. The dependence on background is therefore significant, and it is possible to increase the background by using the post-flash capability. This is unlikely to be useful for most observations, but may make a significant difference in observations with extremely low background (ACS ISRs 2014-01 and 2018-02). The use of post-flash is discussed in more detail in Section 9.6.6.
It may also be useful, in some specific cases, to choose the filter in order to obtain a higher background (e.g., F606W). CTE degradation also has an impact on astrometry (see ACS ISR 2007-04). Therefore, for astrometric programs of relatively bright objects, the use of post-flash may be considered. Minor losses are apparent for WFC due to serial transfers (x-direction), and are currently being investigated. Further details on CTE corrections of very bright stars on subarrays can be found in the ACS ISR 2011-01. A study of the CTE evolution is presented in ACS ISR 2012-03.
The predicted photometric losses (due to imperfect CTE) in observations carried out with the ACS/WFC may be calculated with the formulae in the ACS ISR 2022-06. The ACS Photometric CTE Calculator is available to correct point source photometry (from data that has not had the pixel-based CTE correction applied) with these correction formulae. Given these formulae, we consider three "typical" science applications:
- A star of magnitude 22 in the Vega system observed with the F502N narrow band filter for an exposure time of 100 seconds has a sky background of 1.7 electrons. It is located 1000 parallel pixel transfers from the serial register, and therefore suffers a magnitude change of 0.74 mag.
- A Type Ia supernova at z ~ 1.5 close to its peak brightness (~26.5 mag in Vega system), observed with filter F775W for 600 seconds, results in a sky background of ~50 electrons. It is located 1000 parallel pixel transfers from the serial register, and therefore has a magnitude change of 0.26 mag.
- A point source of magnitude 26 in the Vega system observed for 600 seconds with F606W could result in a sky background level of 85 electrons. CTE losses would cause a magnitude change of 0.13 mag when subject to 1000 parallel pixel transfers.
Anderson & Bedin 2010, PASP, 122, 1035 developed an empirical approach based on the CTE-trailed profiles of warm and hot pixels to characterize the effects of CTE losses for ACS/WFC. Their algorithm first develops a model that reproduces the observed trails and then inverts the model to convert the observed pixel values in an image into an estimate of the original pixel values.
An improved version of CALACS was released in 2012. Along with implementing the pixel-based CTE correction algorithm, that update also included corrections for the electronic artifacts introduced by the repair of the WFC during SM4, namely the bias shift effect (ACS ISR 2012-02), the bias striping effect (ACS ISR 2011-05), and the crosstalk effect (ACS ISR 2010-02). CALACS applies the pixel-based CTE correction to the bias-corrected images and requires CTE-corrected dark reference files to complete calibration. The ACS Team has produced the dark reference frames for the entire ACS archive (ACS TIR 2012-02 and 2018-011). In addition to the standard data products (CRJ, FLT, and DRZ files), there are three pixel-based CTE-corrected data products (CRC, FLC, and DRC) available from the archive for full-frame data. Subarray data must be processed with acs_destripe_plus, included in acstools, to remove the bias-striping effect and apply the pixel-based CTE correction, if desired. See Section 5.2.6 and the ACS Subarrays notebook on the ACS Analysis Tools webpage for more details.
The pixel-based CTE correction algorithm was updated again and included in CALACS in August 2017. It works very well for intermediate to high flux levels (>200 e–) and is more effective at low flux levels (<100 e–). The algorithm also includes a step for mitigating read noise amplification, and employs a more accurate time and temperature dependence for CTE over the ACS lifetime (ACS ISR 2018-04). A tool that uses the CTE model to simulate ACS/WFC readout, called the forward model, has been made available to users as part of CALACS and acstools. A python notebook that provides guidelines for running the forward model is available at the ACS Analysis Tools webpage.
The results of the pixel-based CTE correction algorithm on stellar fields are found to be in agreement with the photometric correction formula of ACS ISR 2022-06. Please refer to the ACS website for the latest information.
4.3.9 UV Light and the HRC CCD
In the optical, each photon generates a single electron. However, shortward of ~3200 Å, there is a finite probability of creating more than one electron per UV photon (see Christensen, O., J. App. Phys. 47, 689, 1976). At room temperature, the theoretical quantum yield (i.e., the number of electrons generated for a photon of energy E > 3.5eV (λ~3500 Å)), is Ne = E(eV)/3.65. The HRC CCDs quantum efficiency curve has not been corrected for this effect. The interested reader may wish to see the STIS Instrument Handbook for details on the signal-to-noise treatment for the STIS CCDs.
1TIRs available upon request.
-
ACS Instrument Handbook
- • Acknowledgments
- • Change Log
- • Chapter 1: Introduction
- Chapter 2: Considerations and Changes After SM4
- Chapter 3: ACS Capabilities, Design and Operations
- Chapter 4: Detector Performance
- Chapter 5: Imaging
- Chapter 6: Polarimetry, Coronagraphy, Prism and Grism Spectroscopy
-
Chapter 7: Observing Techniques
- • 7.1 Designing an ACS Observing Proposal
- • 7.2 SBC Bright Object Protection
- • 7.3 Operating Modes
- • 7.4 Patterns and Dithering
- • 7.5 A Road Map for Optimizing Observations
- • 7.6 CCD Gain Selection
- • 7.7 ACS Apertures
- • 7.8 Specifying Orientation on the Sky
- • 7.9 Parallel Observations
- • 7.10 Pointing Stability for Moving Targets
- Chapter 8: Overheads and Orbit-Time Determination
- Chapter 9: Exposure-Time Calculations
-
Chapter 10: Imaging Reference Material
- • 10.1 Introduction
- • 10.2 Using the Information in this Chapter
-
10.3 Throughputs and Correction Tables
- • WFC F435W
- • WFC F475W
- • WFC F502N
- • WFC F550M
- • WFC F555W
- • WFC F606W
- • WFC F625W
- • WFC F658N
- • WFC F660N
- • WFC F775W
- • WFC F814W
- • WFC F850LP
- • WFC G800L
- • WFC CLEAR
- • HRC F220W
- • HRC F250W
- • HRC F330W
- • HRC F344N
- • HRC F435W
- • HRC F475W
- • HRC F502N
- • HRC F550M
- • HRC F555W
- • HRC F606W
- • HRC F625W
- • HRC F658N
- • HRC F660N
- • HRC F775W
- • HRC F814W
- • HRC F850LP
- • HRC F892N
- • HRC G800L
- • HRC PR200L
- • HRC CLEAR
- • SBC F115LP
- • SBC F122M
- • SBC F125LP
- • SBC F140LP
- • SBC F150LP
- • SBC F165LP
- • SBC PR110L
- • SBC PR130L
- • 10.4 Geometric Distortion in ACS
- • Glossary
