6.2 Coronagraphy
HRC has been unavailable since January 2007. Information about the HRC is provided for archival purposes.
The ACS High Resolution Channel (HRC) had a user-selectable coronagraphic mode for imaging faint objects (e.g., circumstellar disks, substellar companions, quasar-host galaxies) near bright point sources (e.g., stars, quasars). The coronagraph suppressed the diffraction spikes and rings of the occulted source below the level of the scattered light, most of which was caused by surface errors in the HST optics. The coronagraph was added after ACS construction began, at which point it was impossible to insert it into the aberration-corrected beam. Instead, the system was deployed into the aberrated beam, which was subsequently corrected by the ACS optics. Although it was not as efficient as a corrected-beam coronagraph (especially for imaging close to the occulted source) the HRC coronagraph significantly improved the high-contrast imaging capabilities of HST.
6.2.1 Coronagraph Design
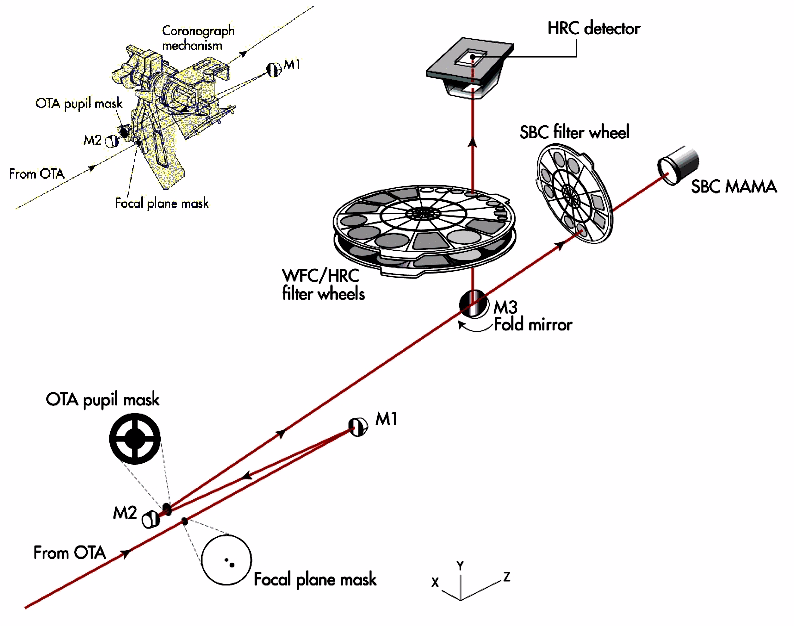
A schematic layout of the ACS coronagraph is shown in Figure 6.2. The aberrated beam from the telescope first encountered one of two occulting spots. The beam continued to the M1 mirror, which forms an image of the HST entrance pupil on the M2 mirror, which in turn corrects for the spherical aberration in the HST primary mirror. The coronagraph's Lyot stop was placed in front of M2. A fold mirror directed the beam onto the HRC's CCD detector. The field of view was 29 × 26 arcsec2 with a mean scale of 0.026 arcseconds/pixel. Geometric distortion resulted in effectively non-square pixels. The coronagraph could be used with any filter over the entire HRC wavelength range of λ = 2000 Å to 10,000 Å.
The occulting spots were placed at the circle of least confusion of the converging aberrated beam. The balance of defocus and spherical aberration at this location allowed maximal occulted flux and minimal spot radius. Nevertheless, the angular extent of the aberrated PSF in the occulting plane necessitated larger spots than would have been used in an unaberrated beam (Figure 6.3).
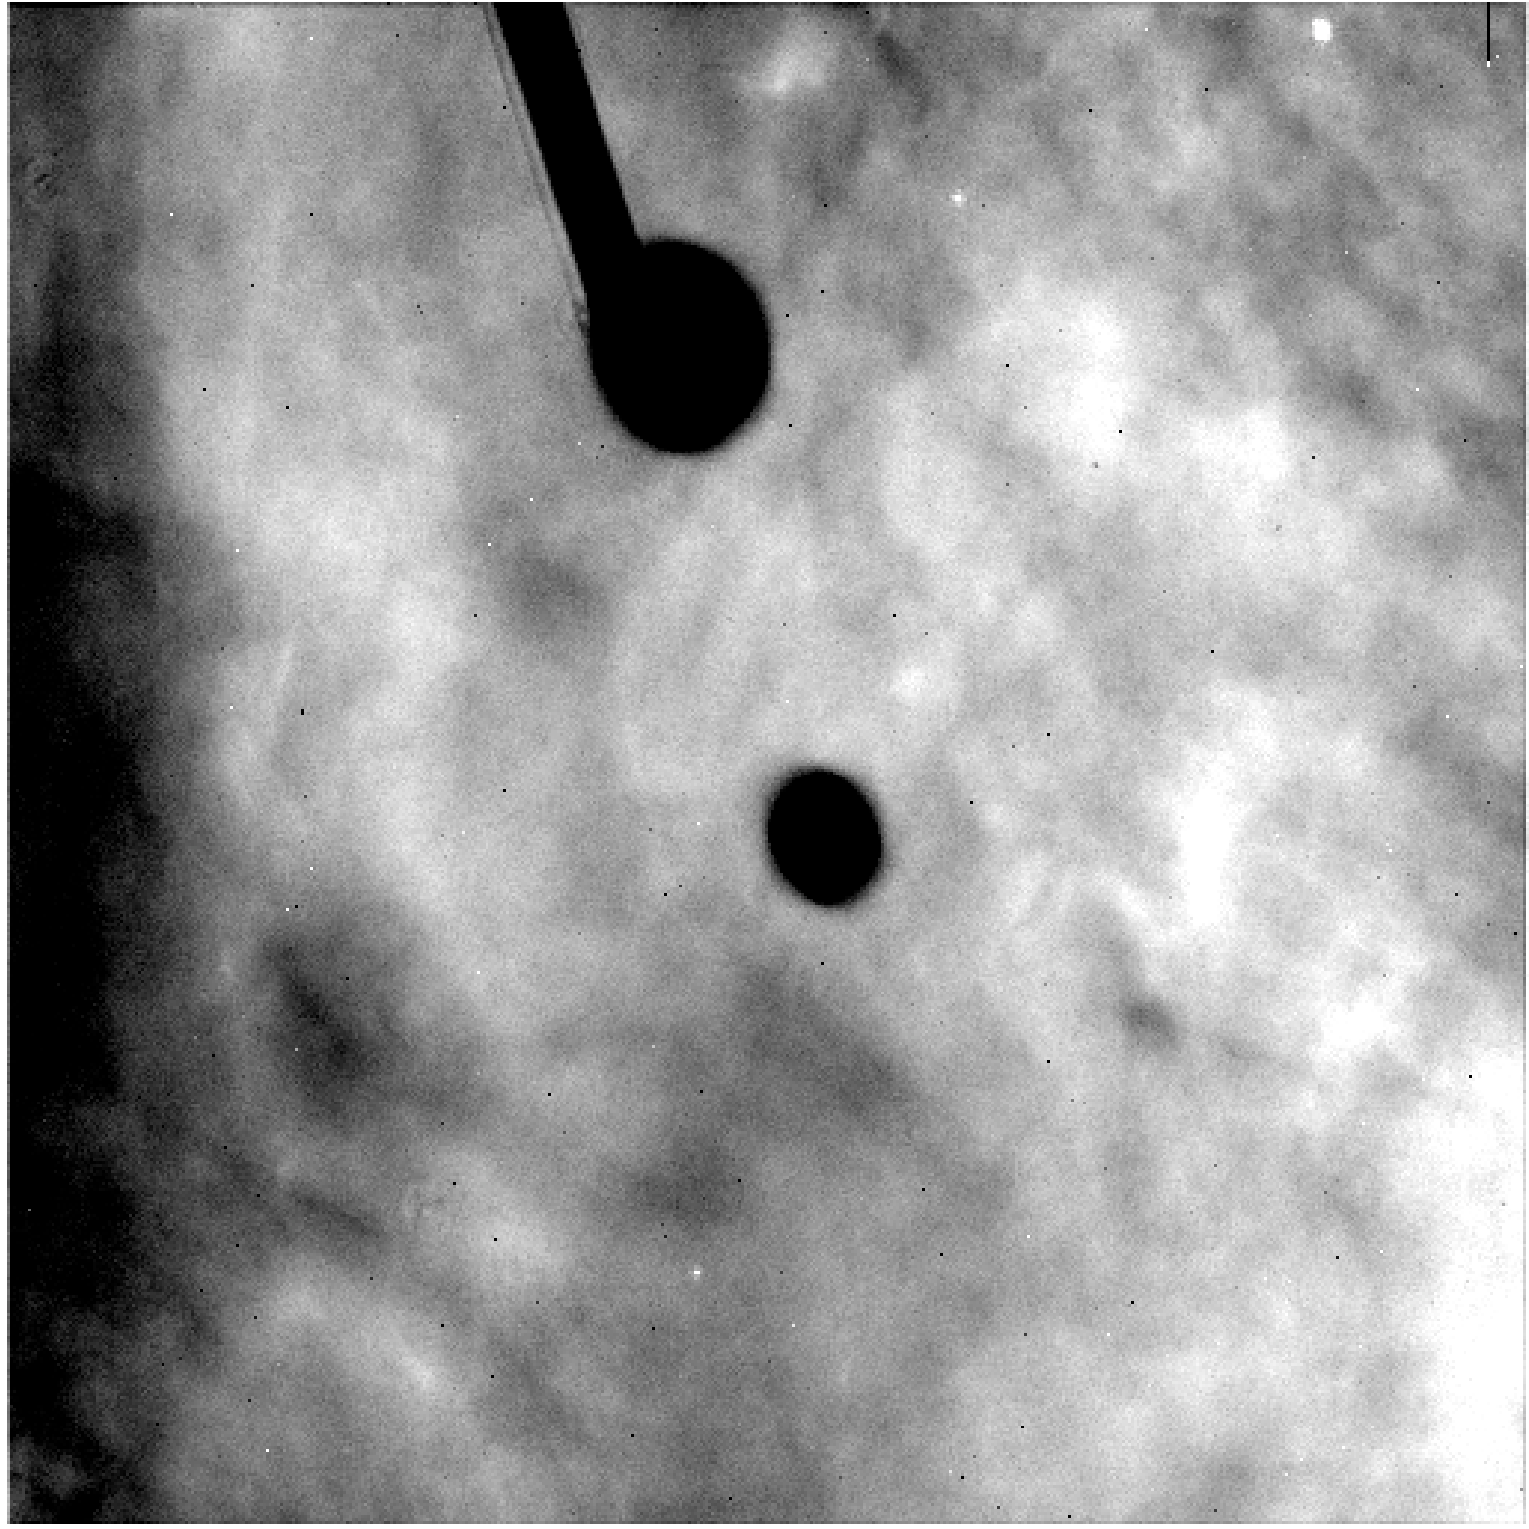
CORON-1.8. The larger spot had a diameter of 3.0 arcseconds and was located near the edge of the field (Figure 6.4). Its aperture designation was CORON-3.0. The small spot was used for the most coronagraphic observations because it allowed imaging closer to the occulted source. The large spot was used for very deep imaging of bright targets with less saturation around the spot than would occur with the smaller spot. Its position near the edge of the field also allowed imaging of faint objects up to 20 arcseconds from the occulted source.The Lyot stop was a thin metal mask that covered the diffracting edges in the HST OTA (i.e., the outer aperture, secondary mirror baffle, secondary mirror support vanes, and primary mirror support pads) at the reimaged pupil. The sizes of the Lyot stop and occulting spots were chosen to reduce the diffracted light below the level of the scattered light, which was unaltered by the coronagraph. The smaller aperture and larger central obscuration of the Lyot stop reduced the throughput by 48% and broadened the field PSF. The spots and Lyot stop were located on a panel attached to the ACS calibration door mechanism and could be flipped out of the beam when not in use. The inside surface of the calibration door could be illuminated by a lamp to provide flat field calibration images for direct imaging, but not coronagraphic imaging.
In addition to the two occulting spots, an occulting finger measuring 0.8 arcseconds × 5 arcseconds (designated OCCULT-0.8) was permanently located at the window of the CCD dewar. The finger was intended to allow unsaturated imaging closer to stars than was possible with the occulting spots, but without suppression of diffracted light by the Lyot stop. It was originally aligned with the center of the large spot, but shifting of the spots during launch ultimately placed the finger near the edge of the large spot. Because the finger was located some distance from the focal plane, the field around its edges was significantly vignetted. This vignetting and the sensitivity of the occulted PSF to its position relative to the finger significantly reduced the efficacy of this observing mode.
6.2.2 Acquisition Procedure and Pointing Accuracy
A bright source had to be placed precisely behind the occulting spot to ensure the proper suppression of the diffracted light. The absolute pointing accuracy of HST is about 1 arcsecond, which is too crude to have ensured accurate positioning behind the spot. Consequently, an on-board acquisition procedure was used to provide better alignment. With the coronagraph deployed, acquisition images were taken using a 200 x 200 pixel2 (5 × 5 arcsec2) subarray at a region of the field near the small occulting spot. The observer specified a filter and exposure time that provided an unsaturated image of the bright source. Narrowband and crossed filters (e.g., F220W+F606W, F220W+F550M, and F220W+F502N) were most often used to obtain images that contained enough signal for a good centroid measurement. However, the photometric performance of the crossed filters was not well calibrated, so estimated count rates for these configurations from synthetic photometry or the ETC were accurate only within a factor of two.
Two identical acquisition images were taken, from which the on-board computer selected the minimum value for each pixel as a crude way of rejecting cosmic rays. The result was then smoothed with a 3 × 3 pixel2 boxcar and the maximum pixel in the subarray was identified. The centroid of the unsmoothed image was then computed within a 5 × 5 pixel2 box centered on this pixel. Based on this position, the telescope was slewed to place the source behind the occulting spot. The combined acquisition and slew errors were approximately ±0.25 pixels (±6 milliarcseconds). While small, these errors required the use of subpixel registration techniques to subtract one coronagraphic PSF from another (Section 6.2.5). The position of the spots relative to the detector also varied over time. This movement further altered the PSF and caused subtraction residuals.
6.2.3 Vignetting and Flat Fields
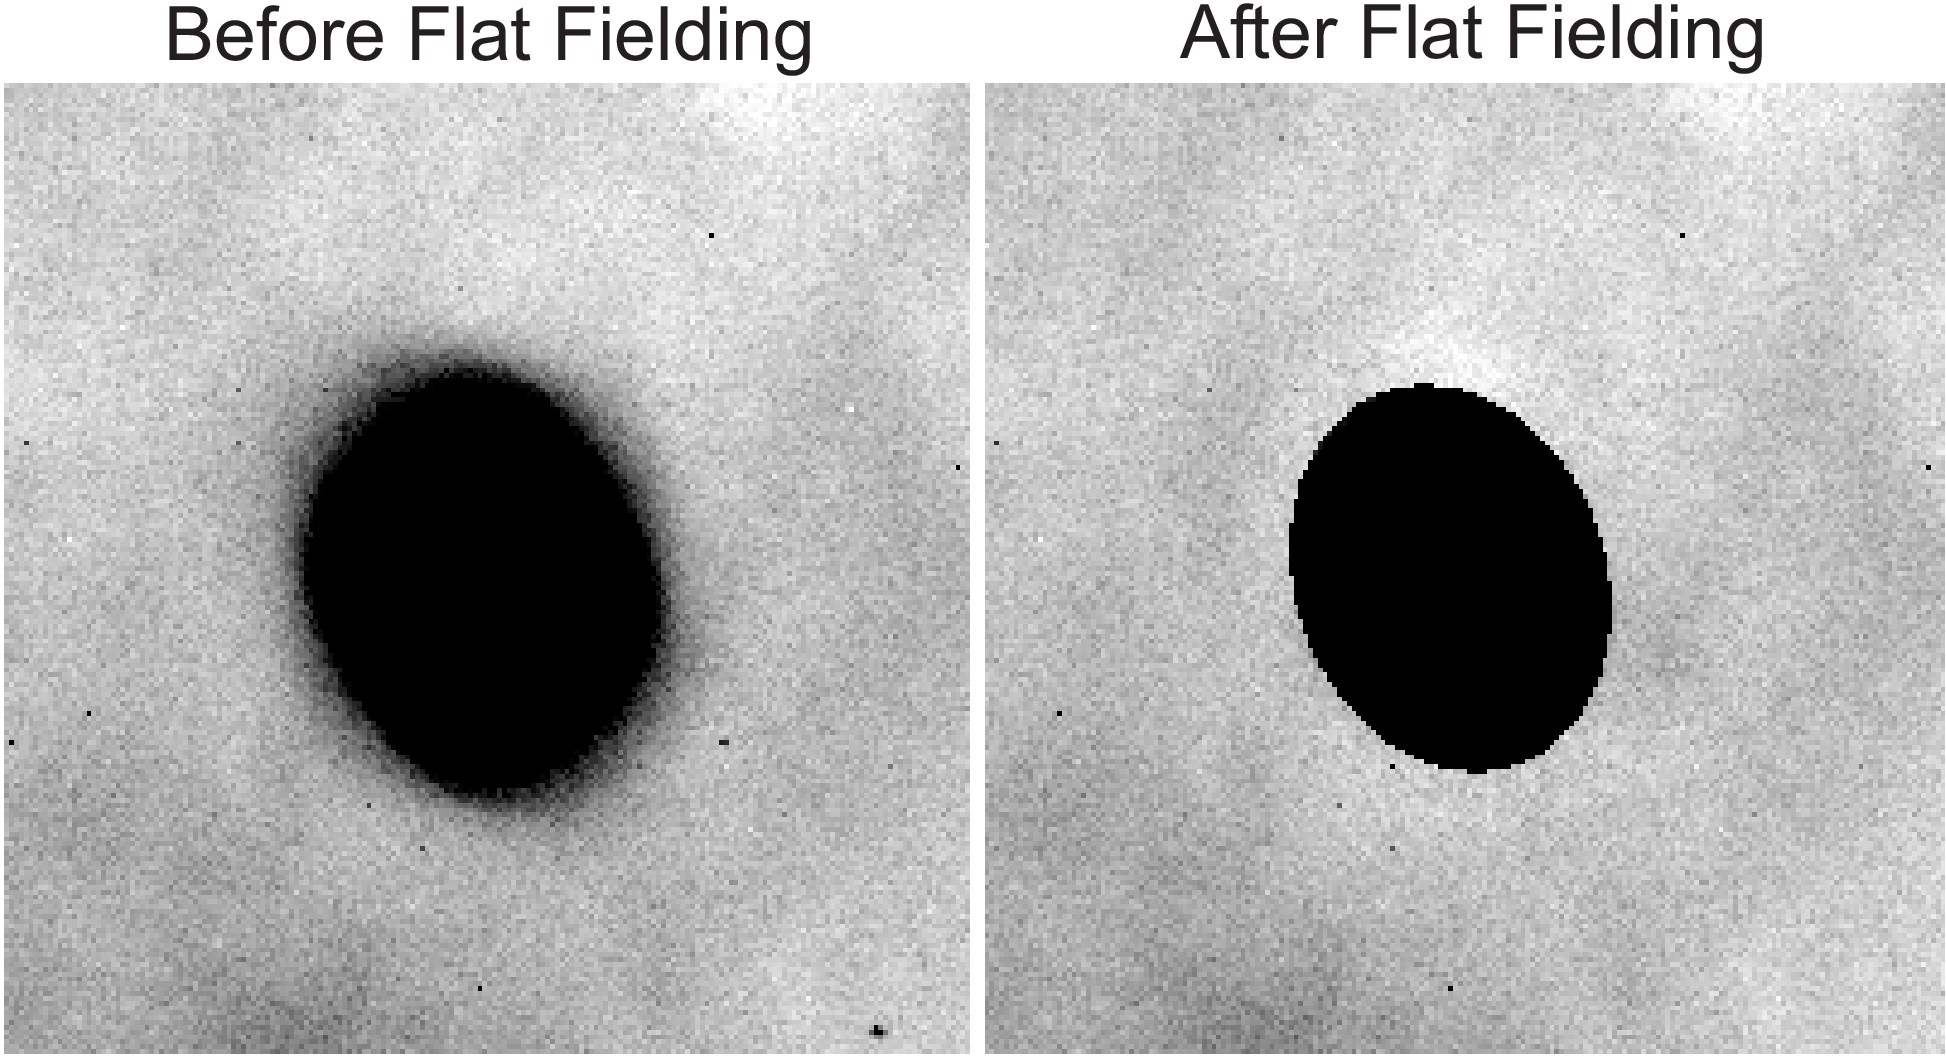
ACS coronagraphic flat fields differ from standard flat fields because of the obscurations from the occulting spots and vignetting by the Lyot stop. The large angular size of the aberrated PSF caused vignetting beyond one arcsecond of the spot edge (Figure 6.4), but this could be corrected by dividing the image by the spot pattern (Figure 6.5). To facilitate this correction, separate flat fields were derived that contained just the spot patterns (spot flats) and the remaining static features (P-flats). For a full discussion see ACS ISR 2004-16.
The ACS data pipeline divides coronagraphic images obtained with filters F330W, F435W, F475W, F606W, and F814W using coronagraphic P-flats derived from either ground-based or on-orbit data. Coronagraphic images obtained with other filters are calibrated with non-coronagraphic flats, which may cause some small-scale errors around dust diffraction patterns. The pipeline then divides the images by the spot flat, using a table of time-dependent spot positions to determine the proper registration of the spot flat. Spot flats for the filters listed above are available for download from the HST Calibration Reference Data System webpage. For other filters, the available spot flat closest in wavelength should be used. The spot flat must be shifted by an amount listed in the coronagraphic spot table, r3301467j_csp.fits.
Because coronagraphic P-flats and spot flats exist only for the few filters listed above, observers are encouraged to use those filters. It is unlikely that coronagraphic flat fields for other filters will be available in the future.
6.2.4 Coronagraphic Performance
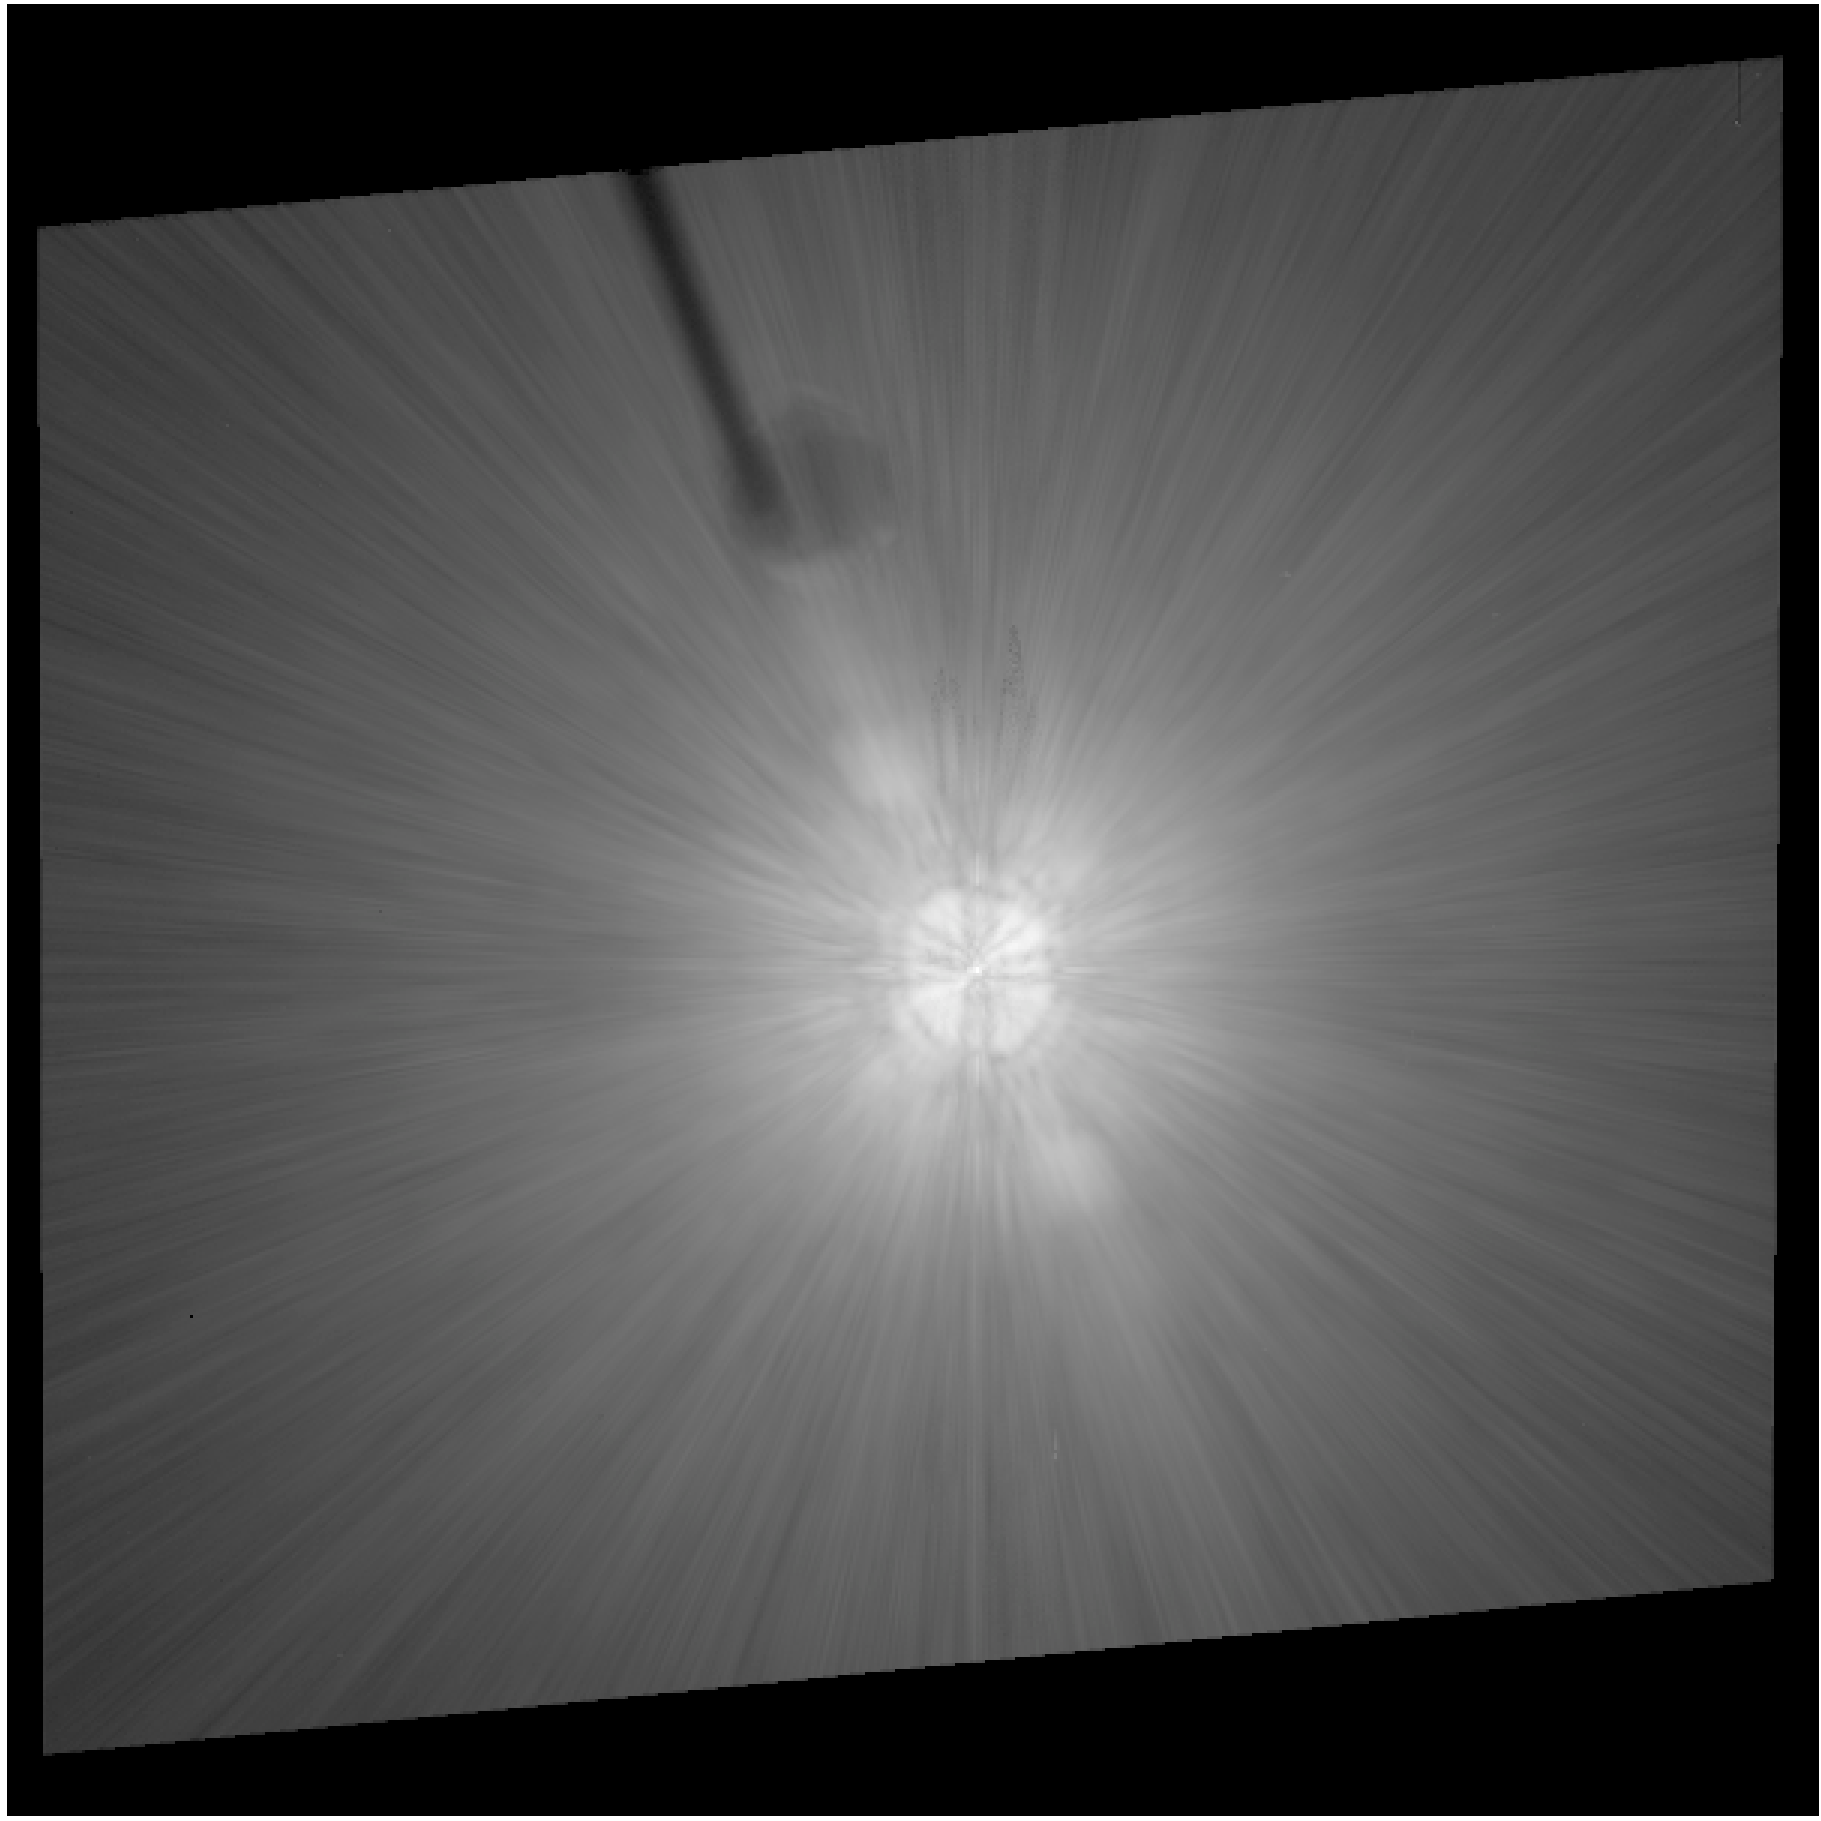
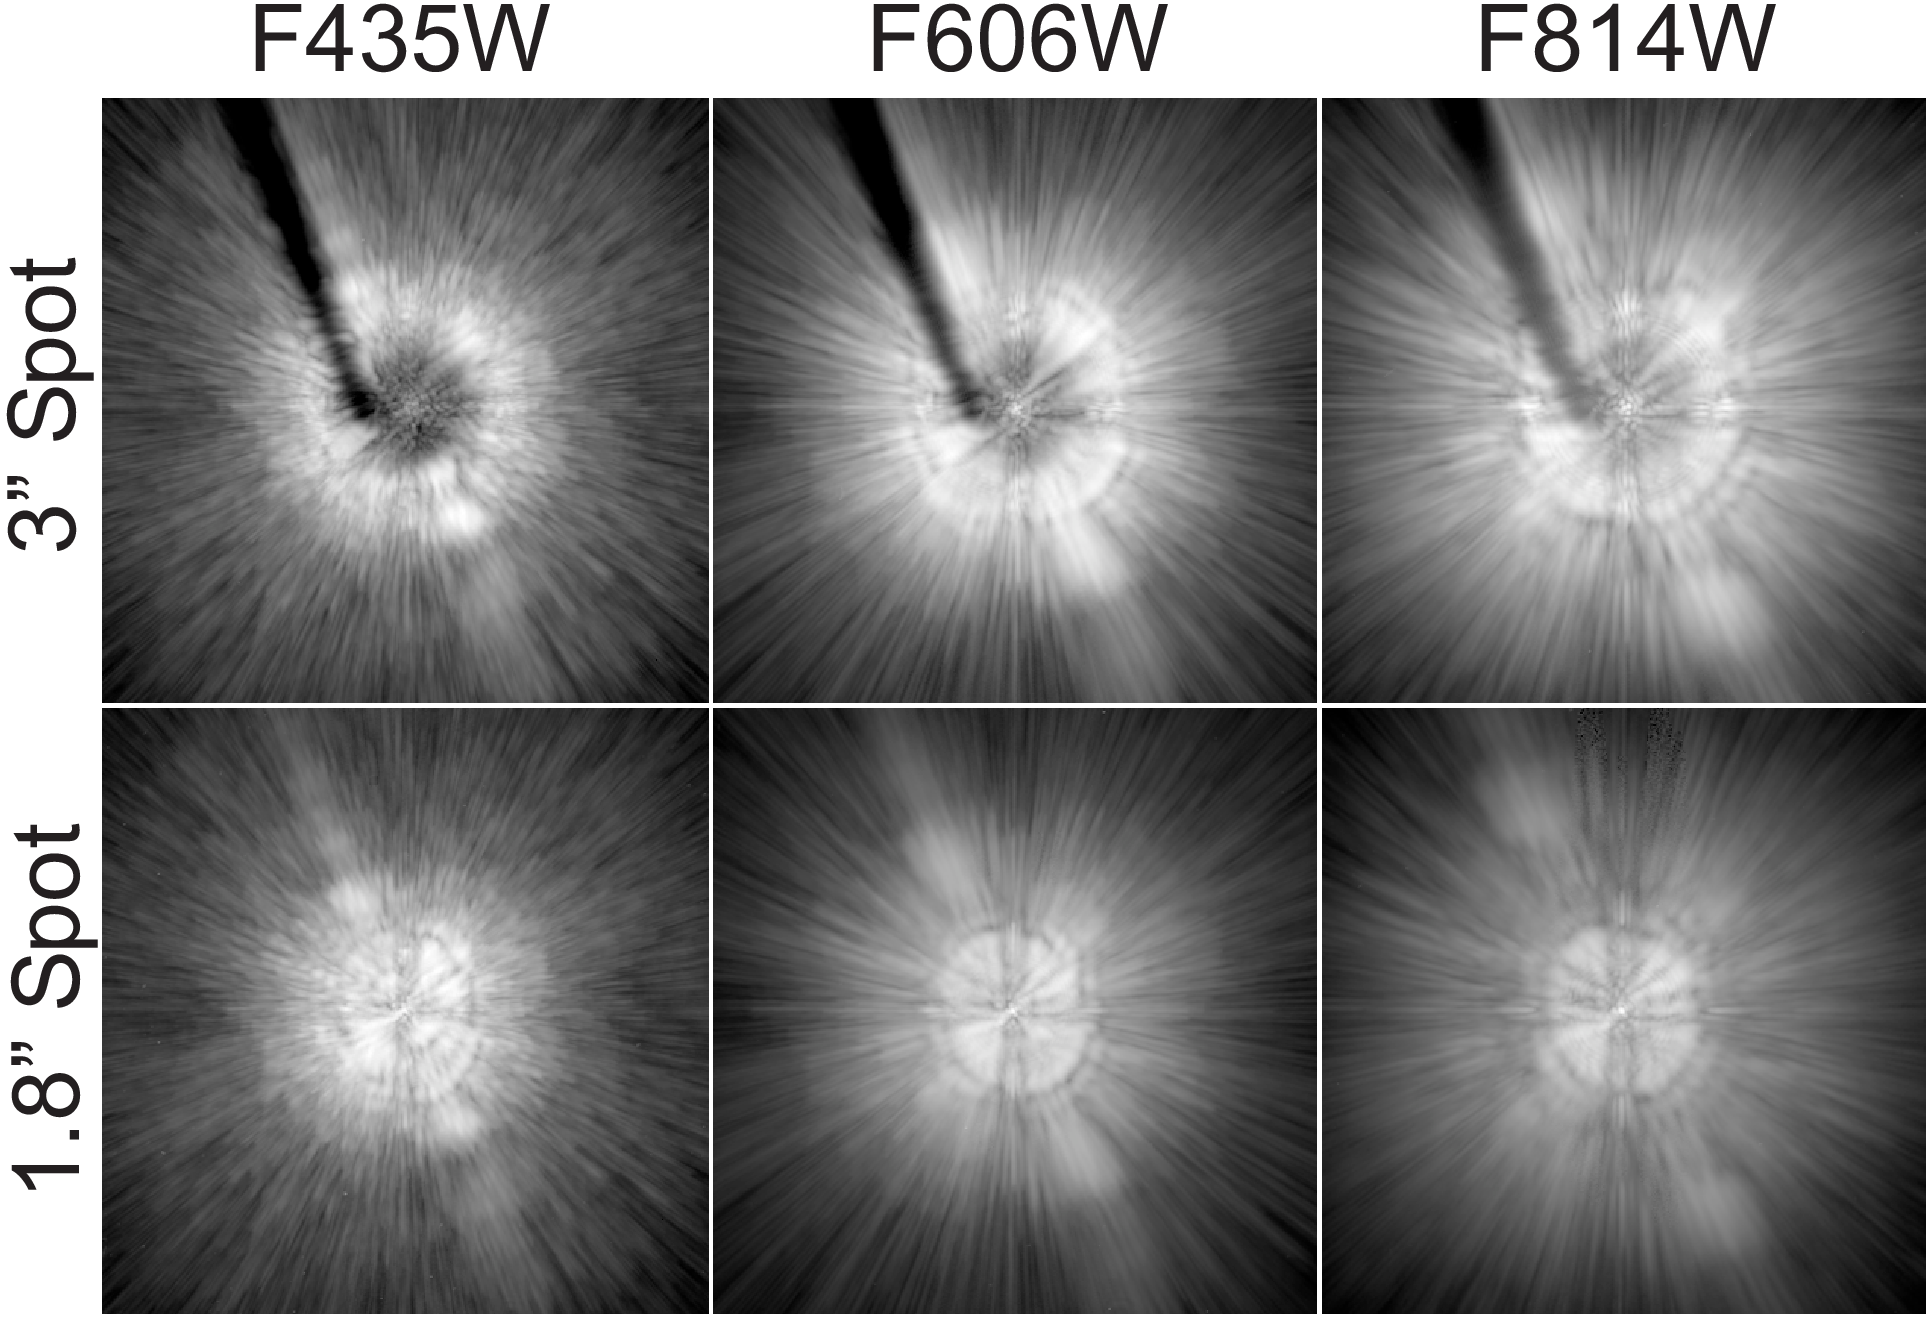
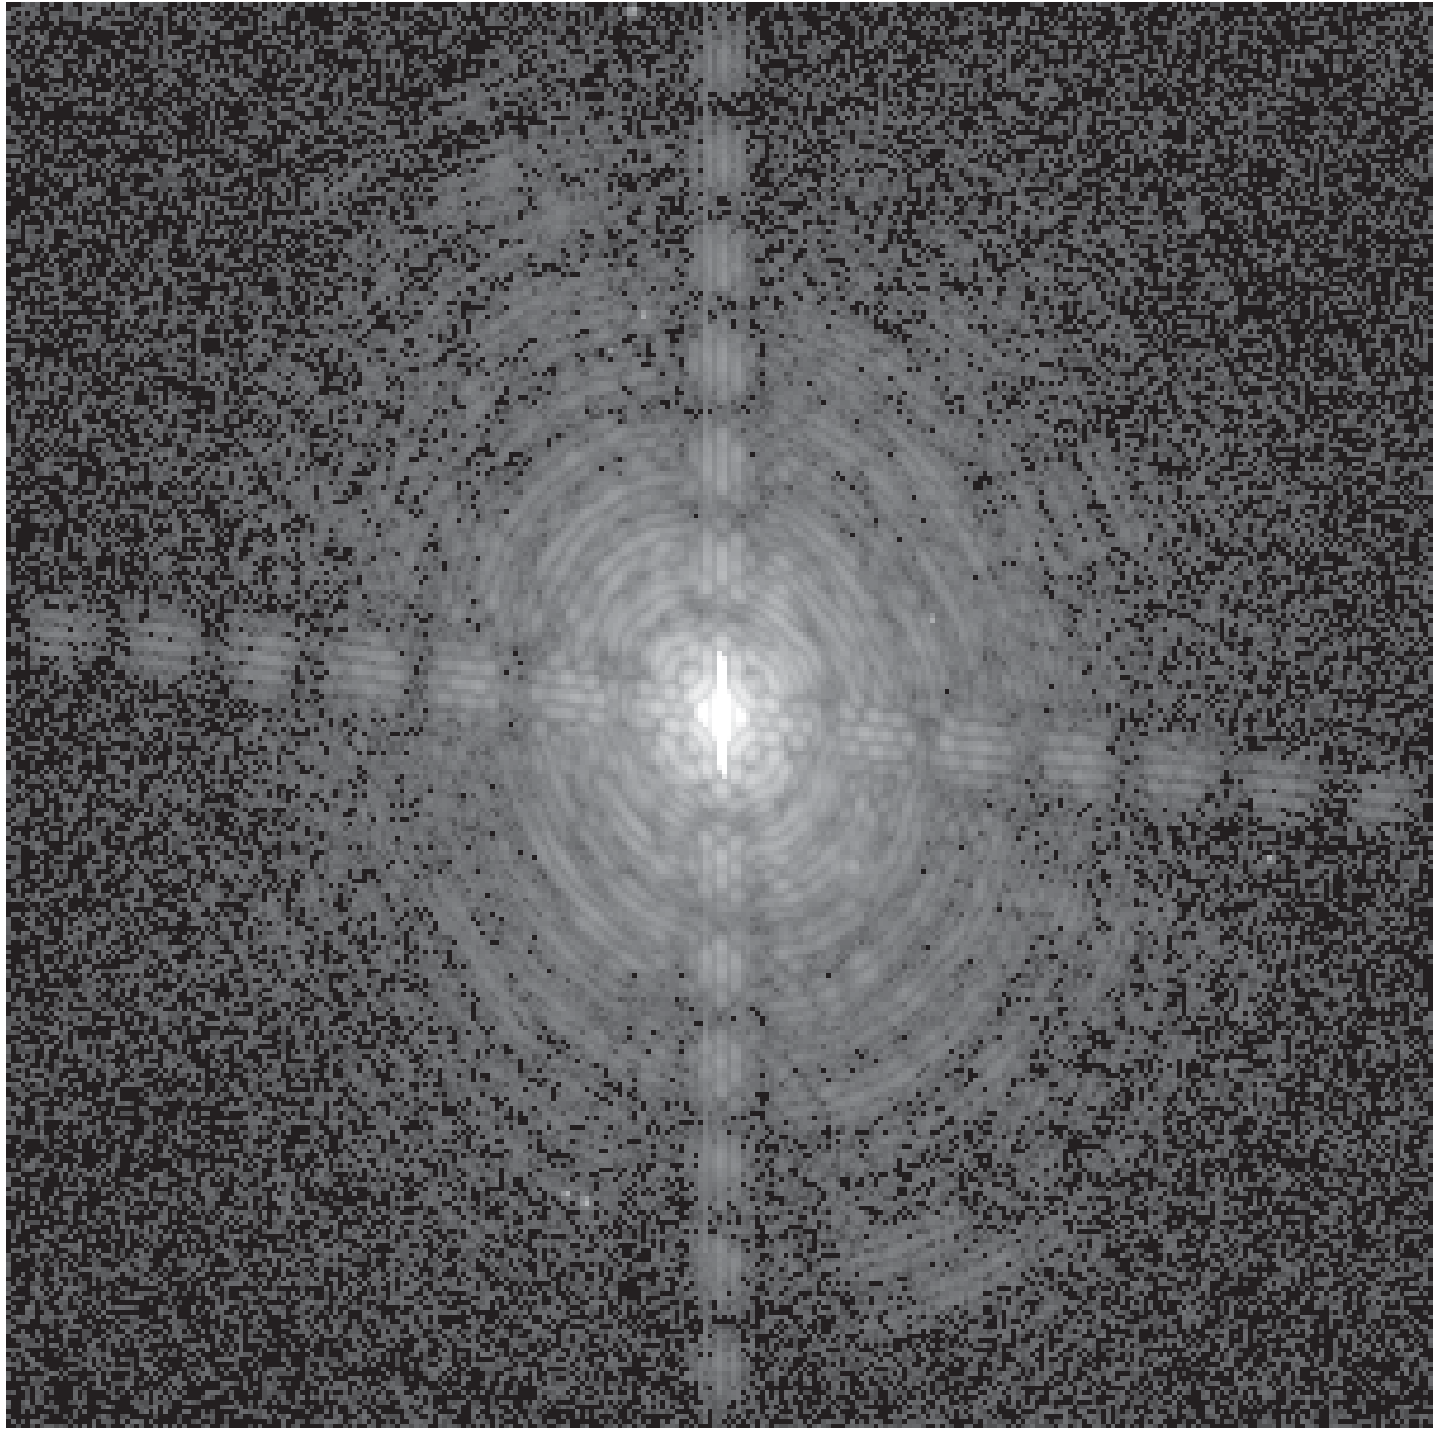
Early in Cycle 11, HRC coronagraph performance verification images were taken of the V = 0 star Arcturus (Figure 6.6 and Figure 6.7). This star has an angular diameter of 25 milliarcseconds and was thus unresolved by the coronagraph. The images of the occulted star are atypical coronagraphic images because the occulting spots were placed in the aberrated beam. The interiors of the imaged spots are filled with a diminished and somewhat distorted image of the star that was caused by mirror M2's correction of unocculted aberrated light from the star. The image of the small spot is filled with light, while the image of the large one is relatively dark. Broad, ring-like structures surround the spots, extending their apparent radii by about 0.5 arcseconds. These rings are due to diffraction of the aberrated PSF by the occulting spots themselves. Consequently, the coronagraphic images of bright stars could saturate at the interior and edges of the spots within a short time. The brightest pixels within the small spot saturated in less than one second for a V = 0.0 star, while the pixels at edge of the large spot saturated in about 14 seconds.
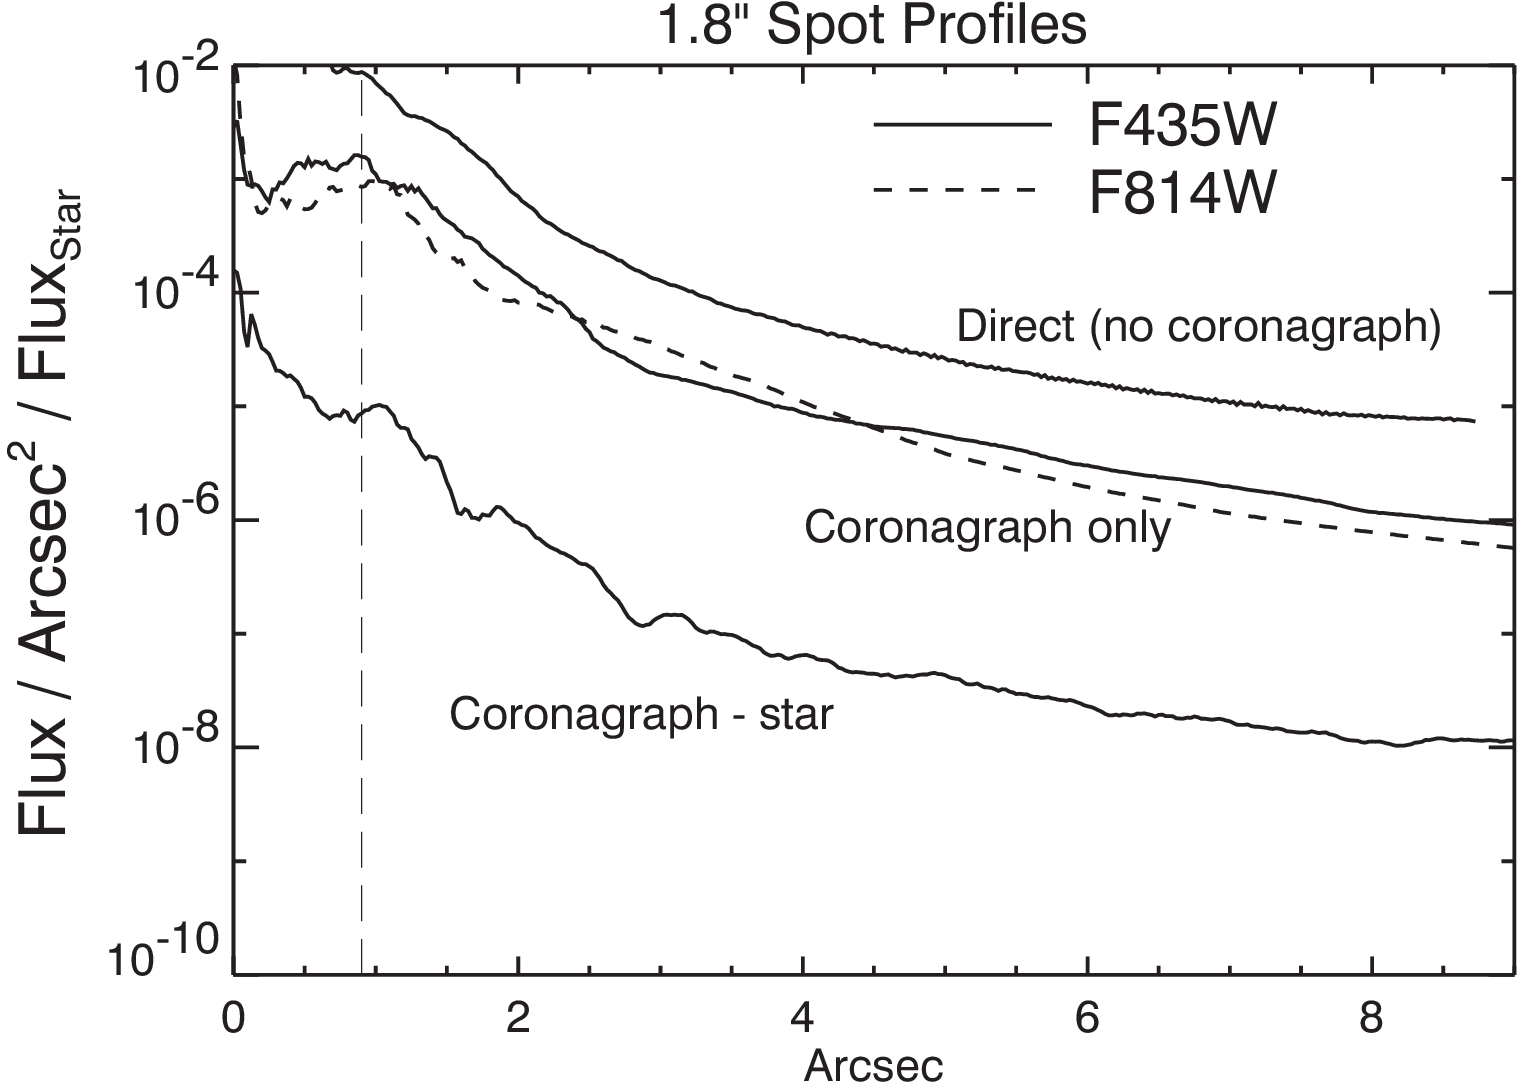
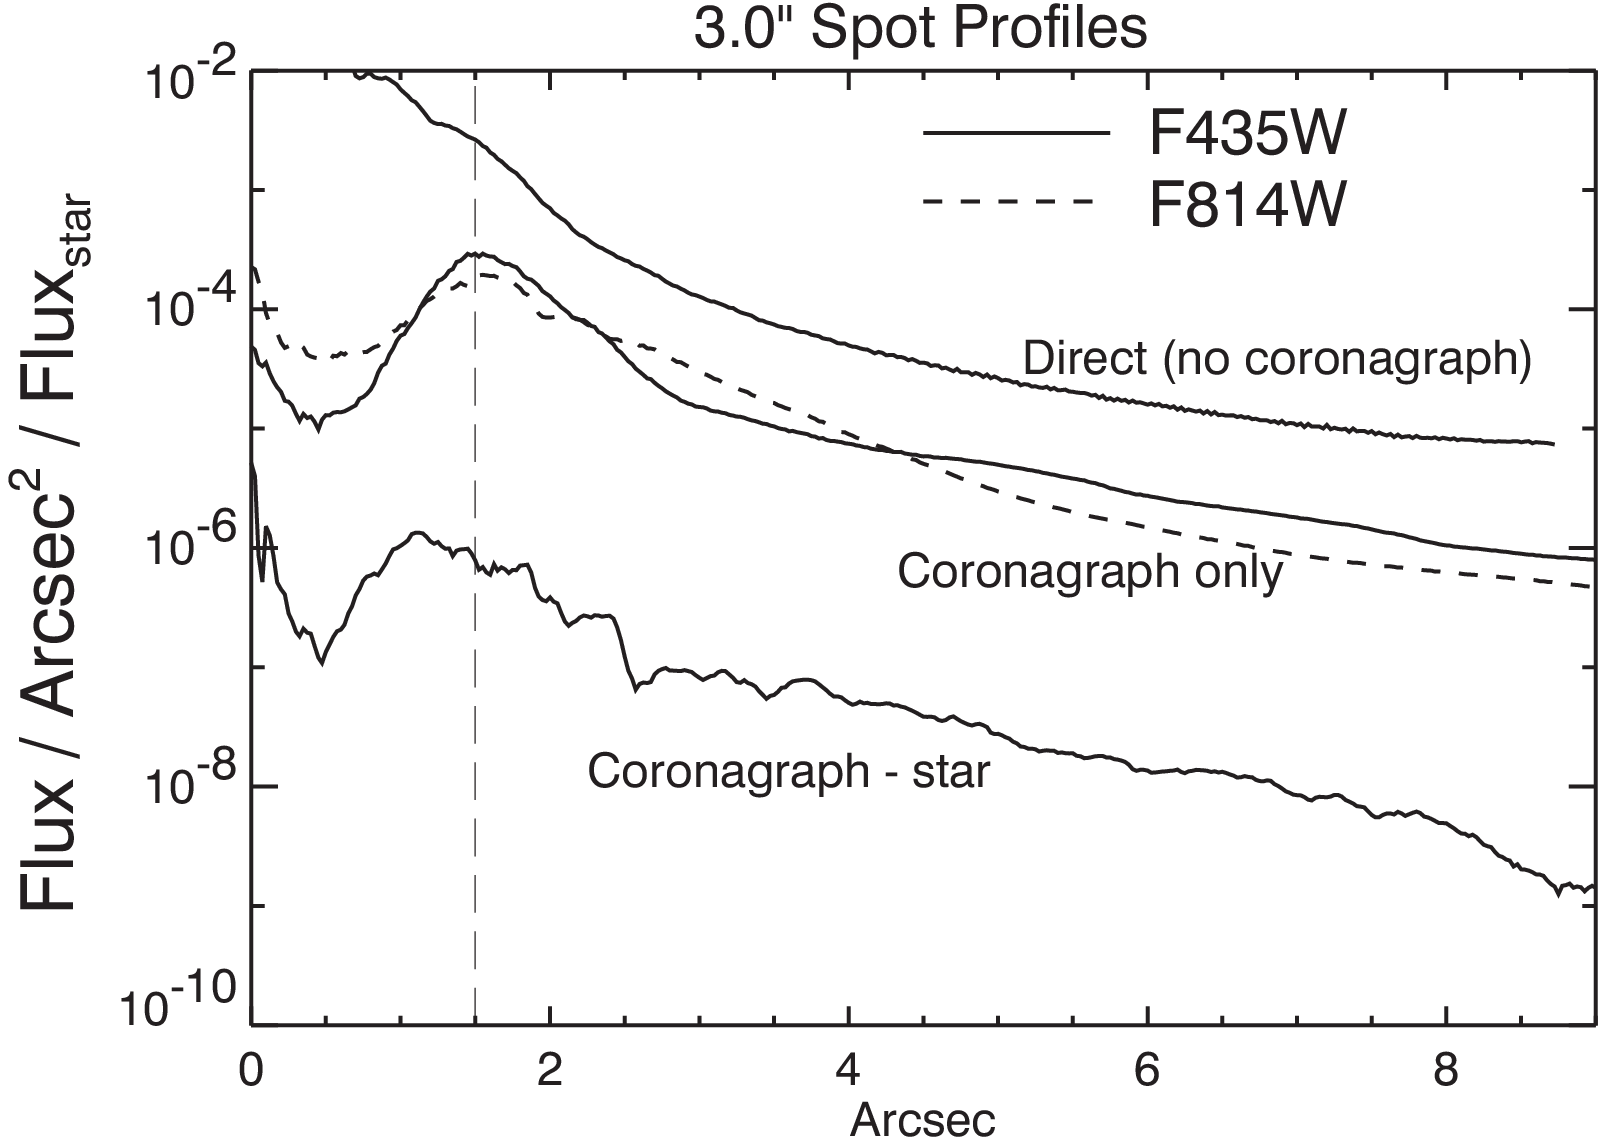
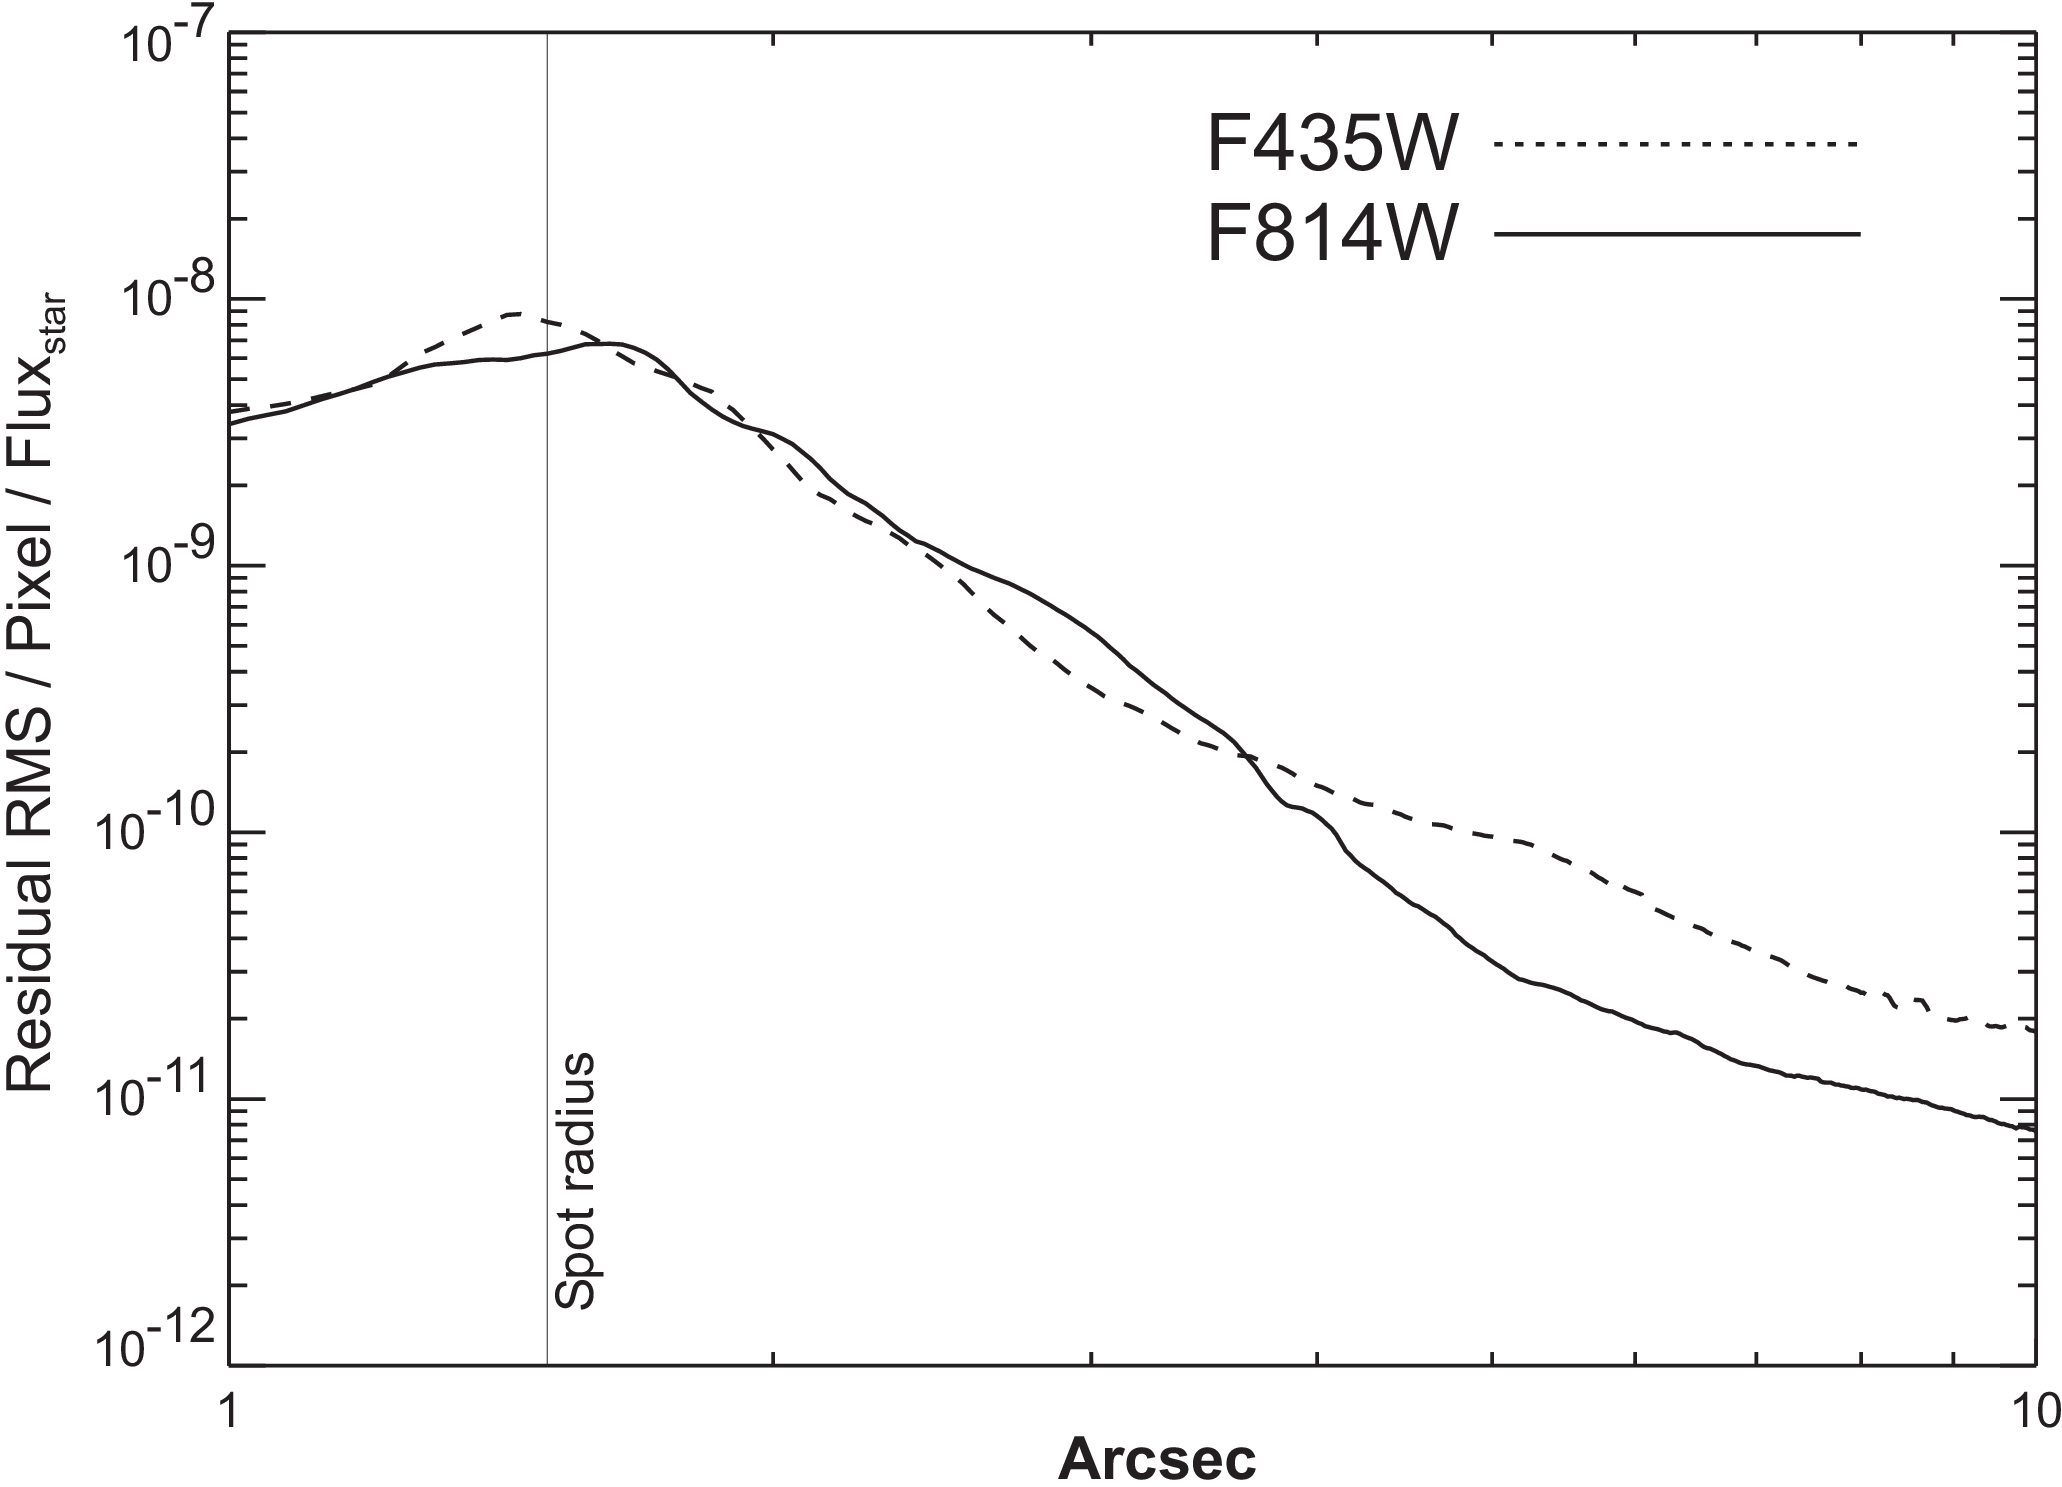
The measured radial surface brightness profiles (Figure 6.8) show that the coronagraph was well aligned and operating as expected. The light diffracted by the HST obscurations was suppressed below the level of the scattered light—there are no prominent diffraction spikes, rings, or ghosts beyond the immediate proximity of the spots. At longer wavelengths (λ > 6000 Å) the diffraction spikes appear about as bright as the residual scattered light because the diffraction pattern is larger and not as well suppressed by the coronagraph. The spikes are more prominent in images with the large spot than the small one because the Lyot stop is not located exactly in the pupil plane but is slightly ahead of it. Consequently, the beam can "walk" around the stop depending on the field angle of the object. Because the large spot is at the edge of the field, the beam is slightly shifted, allowing more diffracted light to pass around the edges of the stop.
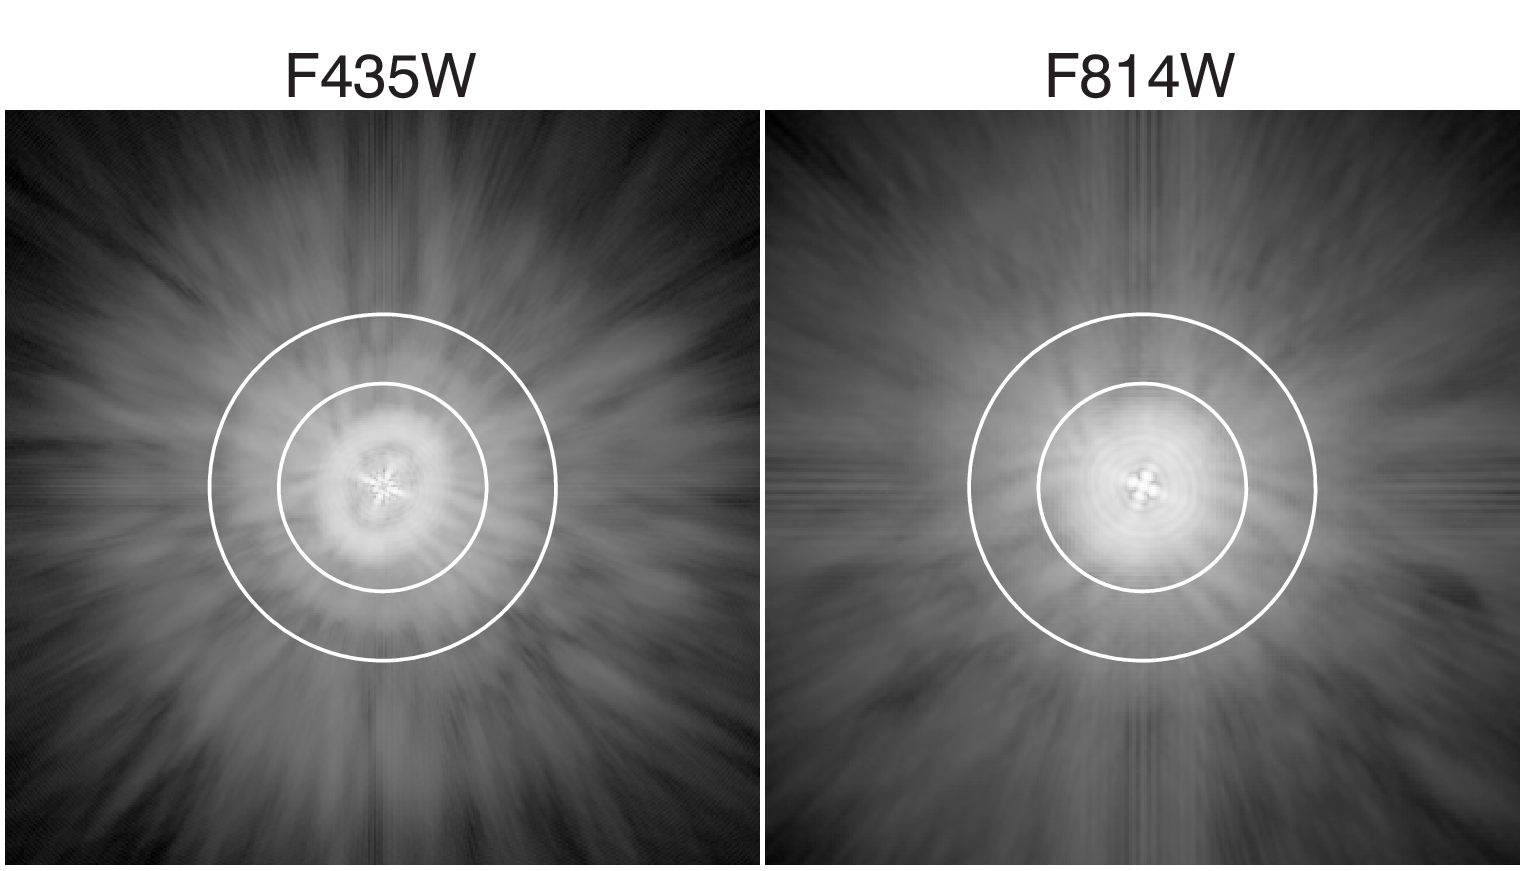
The coronagraphic PSF is dominated by radial streaks that are caused primarily by scattering from zonal surface errors in the HST mirrors. This halo increases in brightness and decreases in size towards shorter wavelengths. One unexpected feature is a diagonal streak or "bar" seen in both direct and coronagraphic images. It is about 5 times brighter than the mean azimuthal surface brightness in the coronagraphic images. This structure was not seen in the ground test images and is likely due to scattering introduced by the HST optics. There appears to be a corresponding feature in STIS as well.
6.2.5 Subtraction of the coronagraphic PSF
Although the coronagraph suppressed the diffracted light from a bright star, the scattered light from the HST mirrors could still overwhelm faint, nearby sources. It is possible to subtract most of the remaining light using an image of another occulted star. PSF subtraction has been successfully used with images taken by other HST cameras, with and without a coronagraph. The quality of the subtraction depends critically on how well the target and reference PSFs match.
For any pair of target and reference PSF images, there is likely to be a difference of 5 to 20 milliarcseconds between the positions of the stars. The scattered light background is largely insensitive to small errors in star-to-spot alignment, so most of it can be subtracted if the images of the two stars are precisely registered and normalized. The numerous sharp, thin streaks that form the scattered light background allow registration errors as small as 0.03 pixels (0.75 milliarcseconds) to be visually detected. To achieve this level of accuracy, the reference PSF may be iteratively shifted and subtracted from the target PSF until an offset is found where the residual streaks are minimized. This method relies on the judgment of the observer, as any circumstellar material could unexpectedly bias a registration optimization algorithm. A higher-order sampling method, such as cubic convolution interpolation, should be used to shift the reference PSF by subpixel amounts. Simpler schemes such as bilinear interpolation degrade the fine PSF structure too much to provide good subtractions.
Brightness normalization errors as small as 1% to 4% between the target and reference stars may also create significant subtraction residuals. However, derivation of the normalization factors from direct photometry is often not possible. Images of unocculted bright stars through medium or broadband filters were often saturated at the shortest exposure time (0.1 seconds). In such cases, accurate normalization may be obtained through synthetic photometry, a comparison of the relative numbers of saturated pixels in the images, and visual inspection of the PSF-subtracted image.
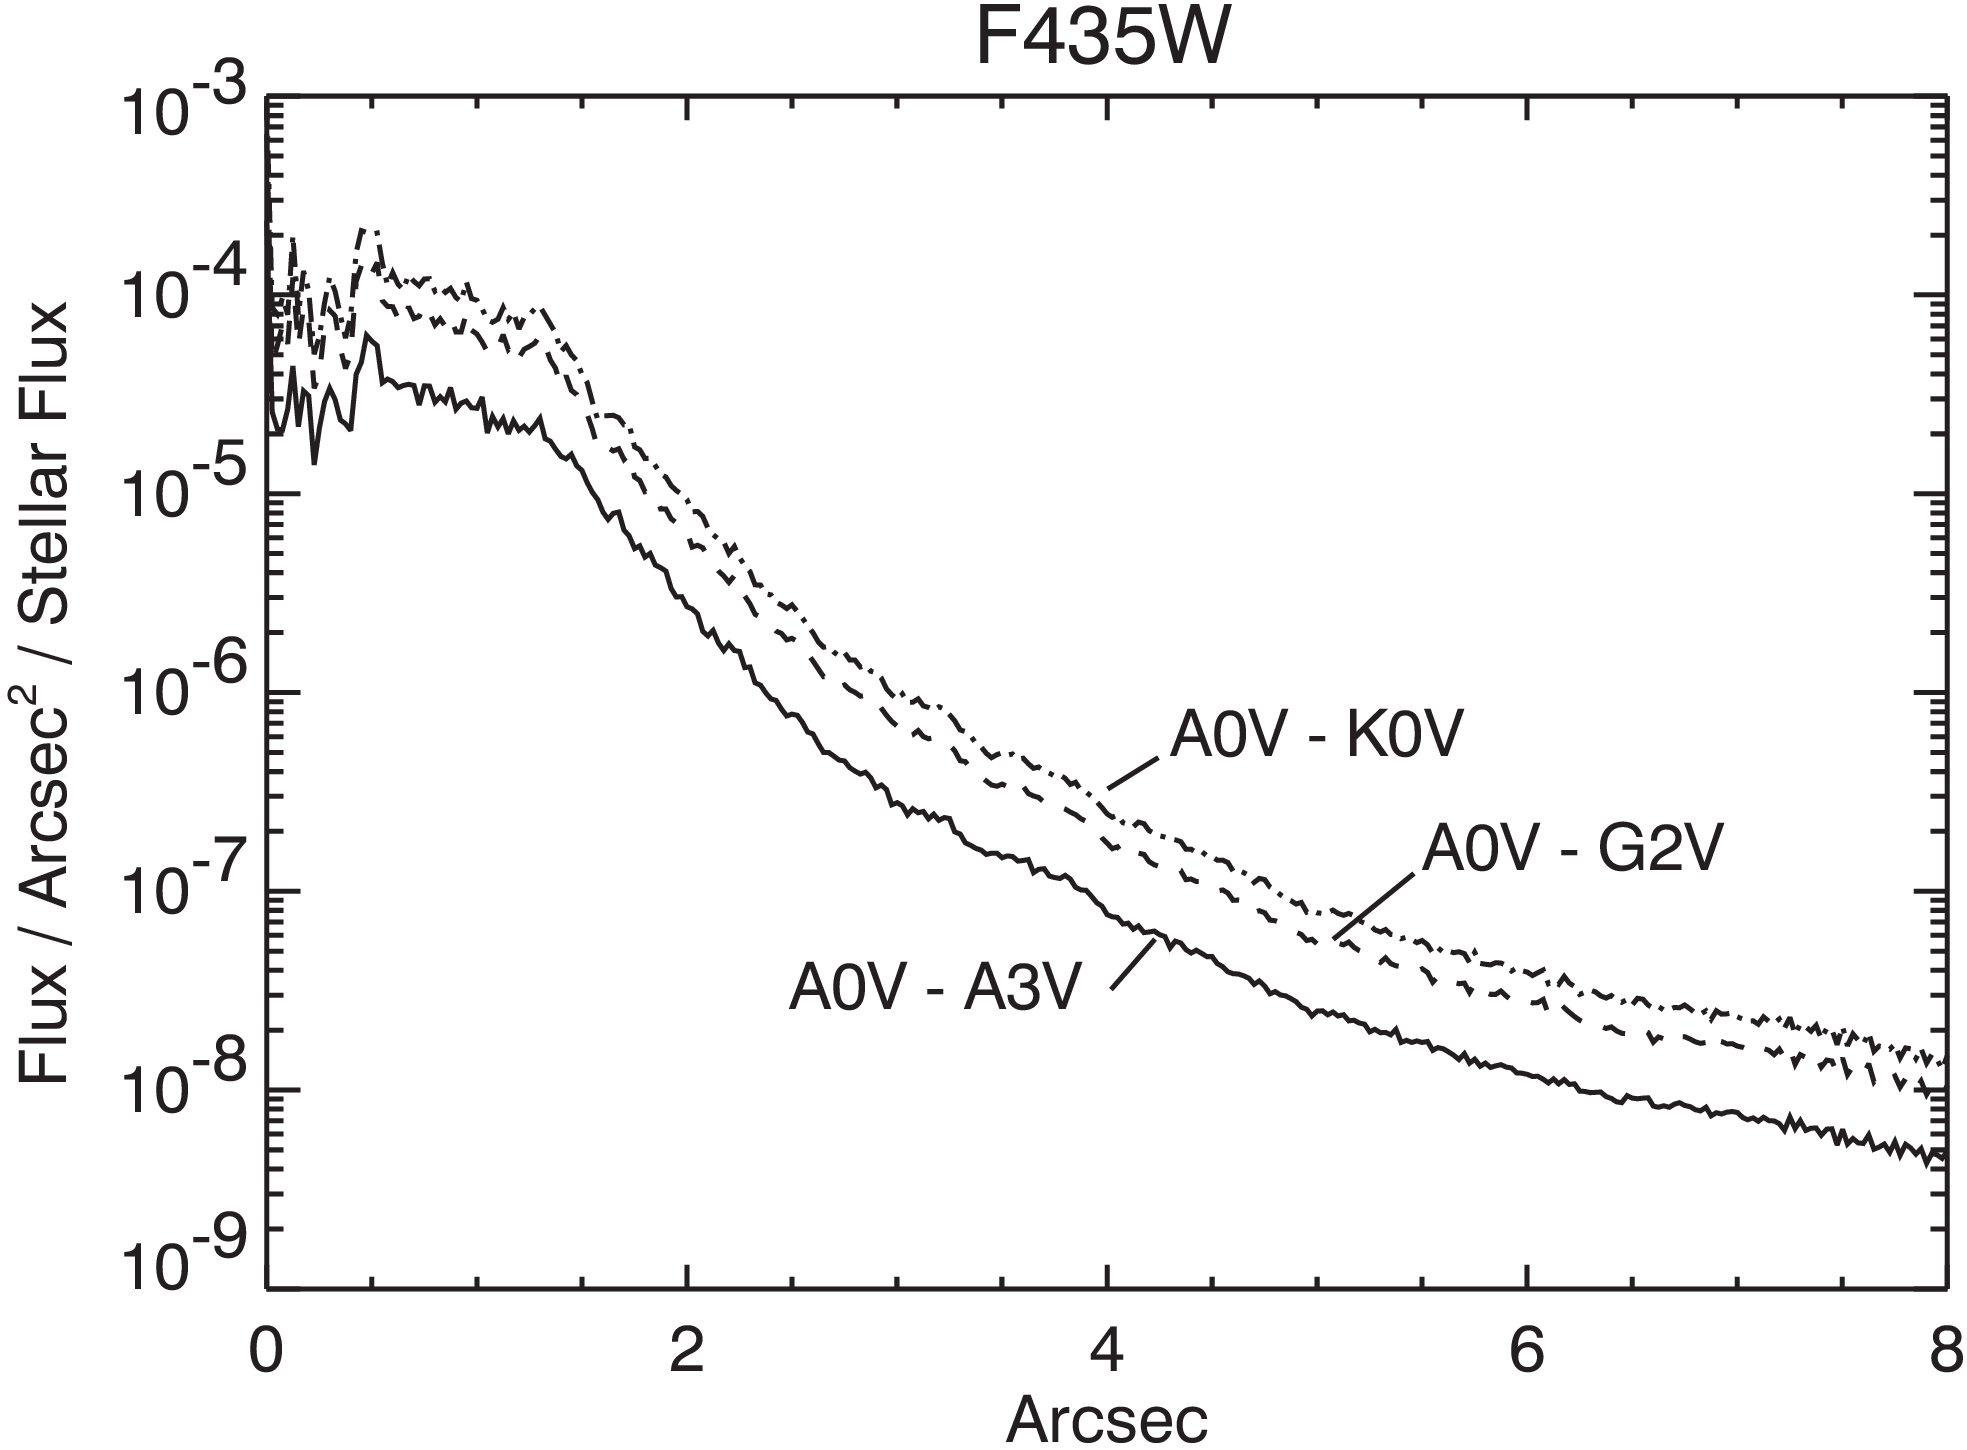
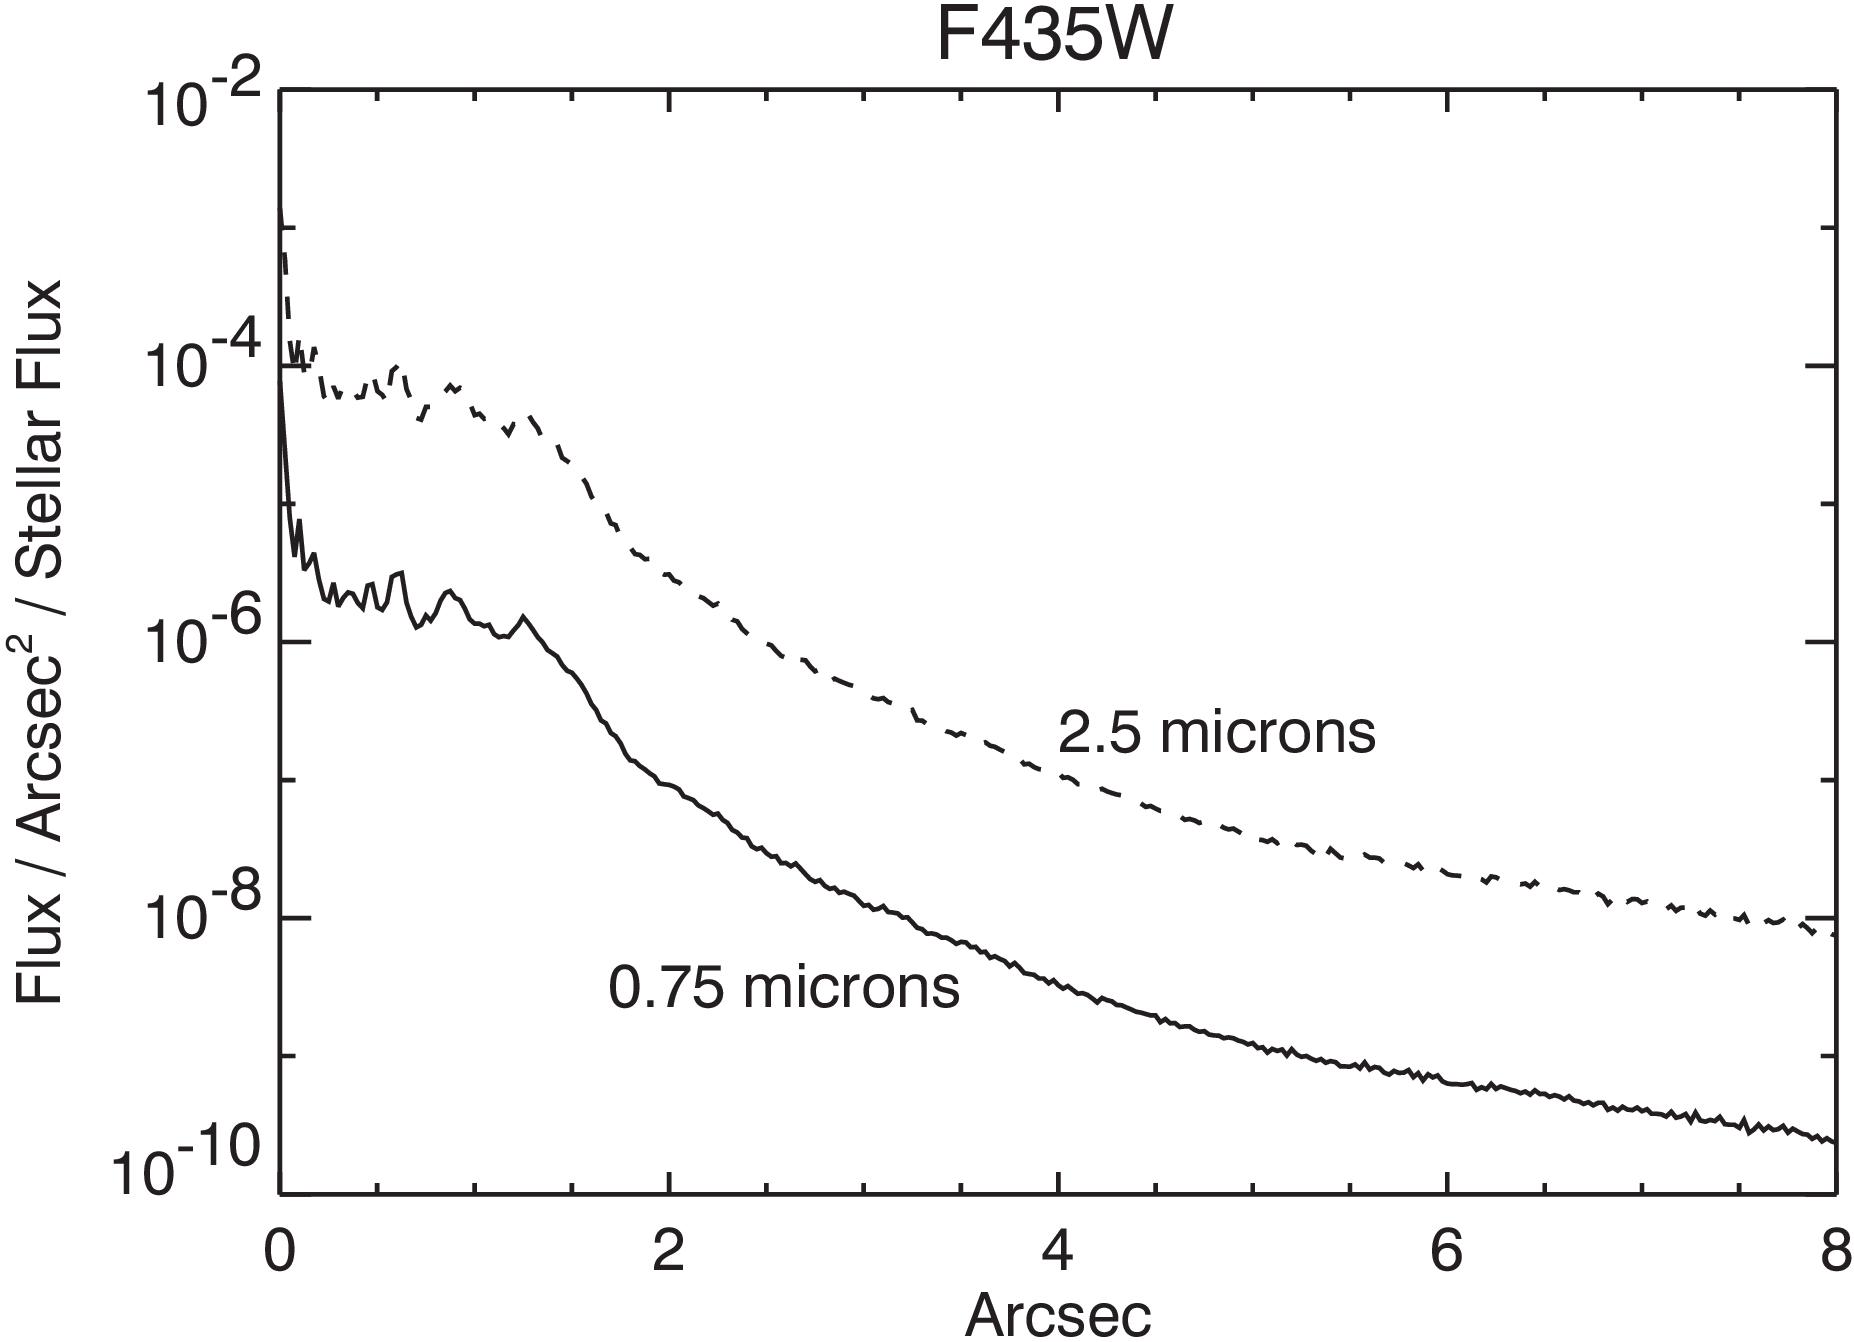
Color differences between the target and reference stars also affect the quality of the PSF subtraction. As wavelength increases, the speckles that make up the streaks in the coronagraphic PSF move away from the center while their intensity decreases (Figure 6.7). The diffraction rings near the spot edges also expand. These effects can be seen in images through wideband filters—a red star will appear to have a slightly larger PSF than a blue one. Thus, an M-type star should be subtracted using a similarly red star—an A-type star would cause significant subtraction residuals. Even the small color difference between A0 V and B8 V stars, for example, may be enough to introduce bothersome errors (Figure 6.9).
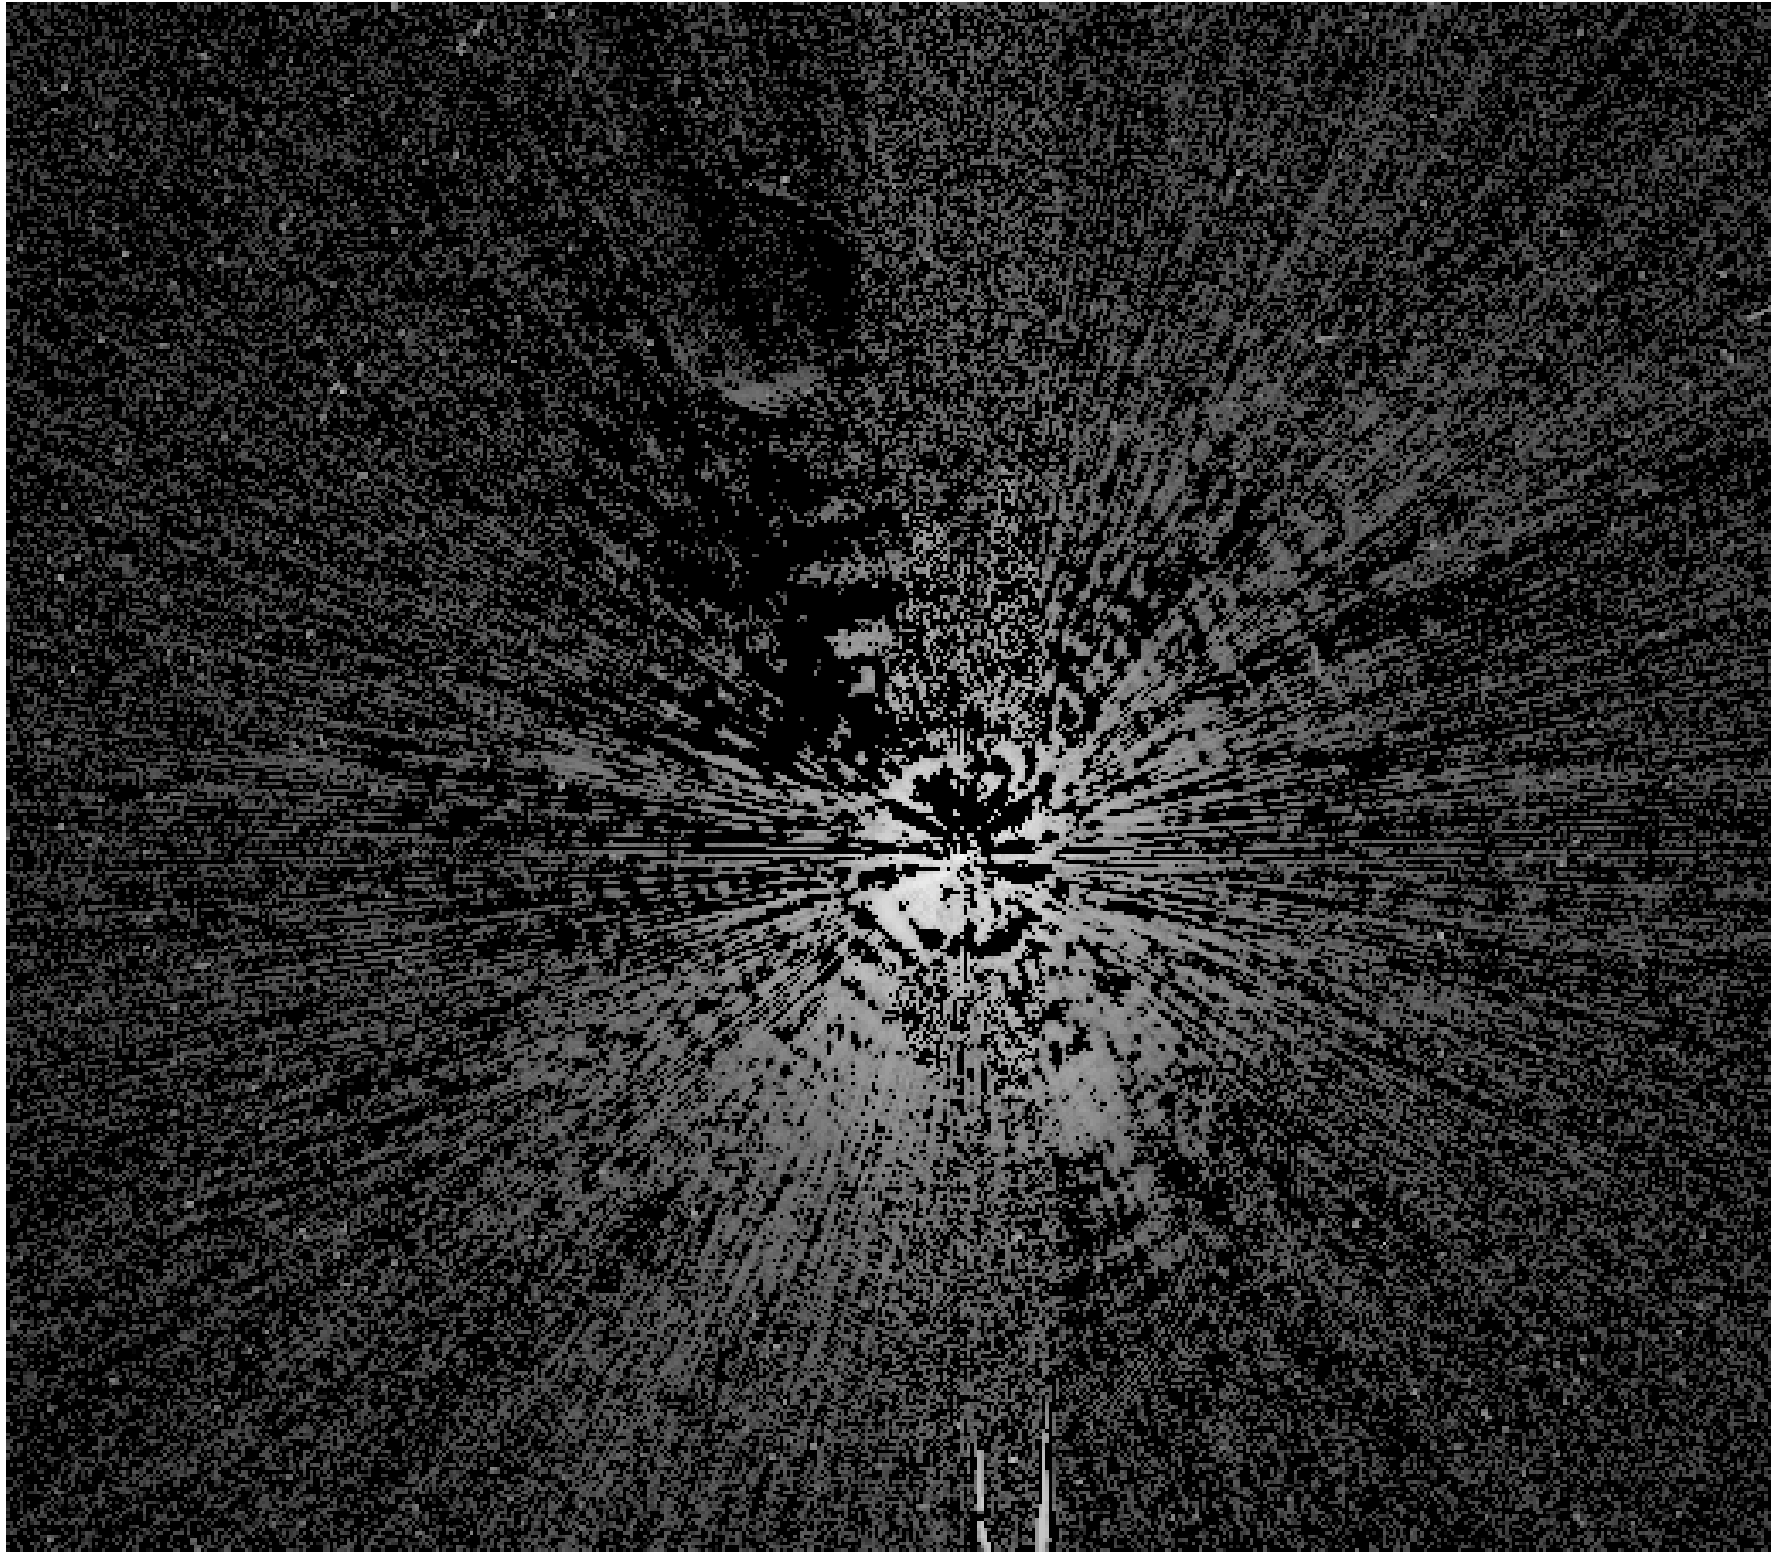
Changes in HST's focus also altered the distribution of light in the coronagraphic PSF (Figure 6.10). Within an orbit, the separation between HST's primary and secondary mirrors varies on average by 3 µm, which corresponds to a variation in the wavefront that results in 1/28 wavelengths of RMS focus difference at λ = 5000 Å (ACS ISR 2008-03). This effect, known as breathing, is caused by the occultation of the telescope's field of view by the warm Earth, which typically occurs during half of each 96-minute orbit. This heating by the warm Earth expands HST's interior structure. After occultation the structure gradually shrinks. Changes relative to the sun (mostly anti-sun pointings) also cause contraction of the telescope, which gradually expands to "normal" size after a few orbits.
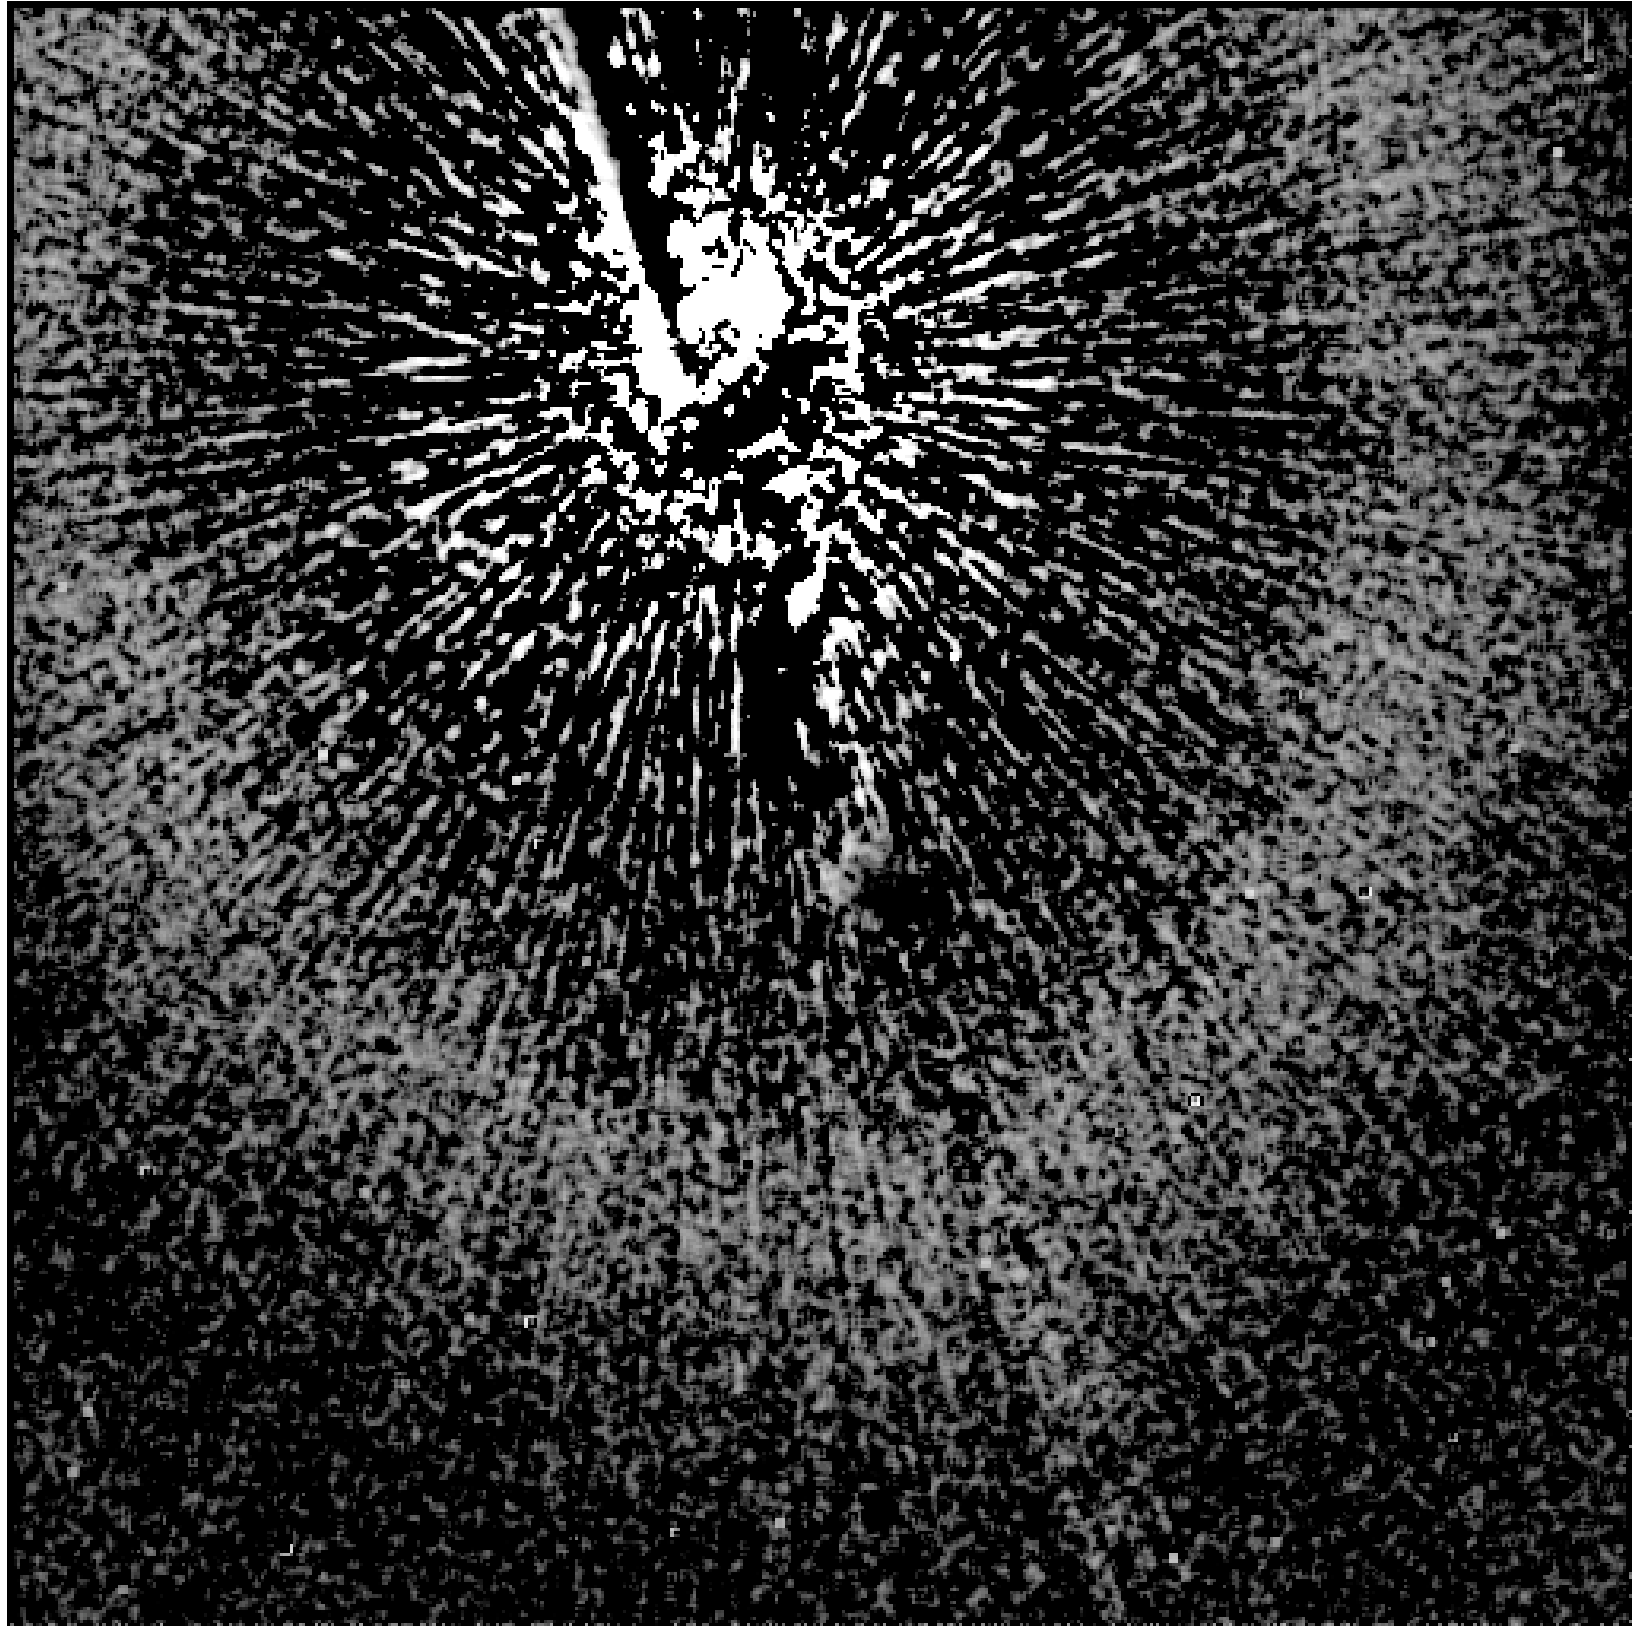
A frequently used method of avoiding the color and normalization problems involved the subtraction of images of the same target taken at two different field orientations. This technique, known as roll subtraction, was done either by requesting a roll of the telescope about the optical axis (up to 30°) between orbits, or by revisiting the target at a later date when the default orientation of the telescope was different. Roll subtraction only worked when the nearby or circumstellar object of interest was not azimuthally extended. It was the best technique for detecting point source companions or imaging strictly edge-on disks (e.g., Beta Pictoris). It could also be used to reduce the pixel-to-pixel variations in the subtraction residuals by rotating and co-adding the images taken at different orientations. (This worked for extended sources if another PSF star was used.) Ideally, the subtraction errors decreased as the square root of the number of orientations.
6.2.6 The Off-Spot PSF
Objects that were observed in the coronagraphic mode but not placed behind an occulting spot had PSFs that were defined by the Lyot stop. Because the Lyot stop effectively reduced the diameter of the telescope and introduced larger obscurations, this "off-spot" PSF was wider than normal, with more power in the wings and diffraction spikes (Figure 6.14). Together, the Lyot stop and occulting spot substrate reduced the throughput by 52.5%. In F814W, the "off-spot" PSF had a peak pixel containing 4.3% of the total (reduced) flux and a sharpness (including CCD charge diffusion effects) of 0.010. (Compare these to 7.7% and 0.026, respectively, for the normal HRC PSF.) In F435W, the peak was 11% and the sharpness is 0.025 (compared to 17% and 0.051 for the normal F435W PSF). Users needed to take the reduced throughput and sharpness into account when they determined the detection limits of HRC coronagraphic images. Tiny Tim may have been used to compute off-spot PSFs.
6.2.7 Occulting Spot Motions
The positions of the occulting spots were measured at weekly intervals using Earth flats. These measurements showed that the spots moved over daily to weekly time scales in an unpredictable manner. The cause of this motion remains unknown. The spot positions typically varied by ~0.3 pixels (8 milliarcseconds) over one week, but they occasionally shifted by 1 to 5 pixels over 1 to 3 weeks. During a single orbit, however, the spots were stable to within ±0.1 pixel when continuously deployed and they recovered their positions within ±0.25 pixel when repeatedly stowed and deployed.
After on-board analysis of the acquisition images, a coronagraphic target was moved to the previously measured position of an occulting spot, which may have been several days old. The uncertainties in the day-to-day spot positions could cause star-to-spot registration errors that would affect coronagraphic performance. If the star was offset from the spot center by more than 3 pixels, then one side of the coronagraphic PSF would be brighter than expected and may have saturated earlier than predicted. A large offset also degraded the coronagraphic suppression of the diffraction pattern. Most importantly, slight changes in the spot positions could alter the coronagraphic PSFs of the target and reference stars enough to cause large PSF-subtraction residuals. Consequently, observers could not rely on reference PSFs obtained from other programs or at different times.
To reduce the impact of spot motion, observers usually obtained a reference PSF image in an orbit immediately before or after their science image. A single reference PSF could be used for two science targets if all three objects were observed in adjacent orbits and had similar colors.
-
ACS Instrument Handbook
- • Acknowledgments
- • Change Log
- • Chapter 1: Introduction
- Chapter 2: Considerations and Changes After SM4
- Chapter 3: ACS Capabilities, Design and Operations
- Chapter 4: Detector Performance
- Chapter 5: Imaging
- Chapter 6: Polarimetry, Coronagraphy, Prism and Grism Spectroscopy
-
Chapter 7: Observing Techniques
- • 7.1 Designing an ACS Observing Proposal
- • 7.2 SBC Bright Object Protection
- • 7.3 Operating Modes
- • 7.4 Patterns and Dithering
- • 7.5 A Road Map for Optimizing Observations
- • 7.6 CCD Gain Selection
- • 7.7 ACS Apertures
- • 7.8 Specifying Orientation on the Sky
- • 7.9 Parallel Observations
- • 7.10 Pointing Stability for Moving Targets
- Chapter 8: Overheads and Orbit-Time Determination
- Chapter 9: Exposure-Time Calculations
-
Chapter 10: Imaging Reference Material
- • 10.1 Introduction
- • 10.2 Using the Information in this Chapter
-
10.3 Throughputs and Correction Tables
- • WFC F435W
- • WFC F475W
- • WFC F502N
- • WFC F550M
- • WFC F555W
- • WFC F606W
- • WFC F625W
- • WFC F658N
- • WFC F660N
- • WFC F775W
- • WFC F814W
- • WFC F850LP
- • WFC G800L
- • WFC CLEAR
- • HRC F220W
- • HRC F250W
- • HRC F330W
- • HRC F344N
- • HRC F435W
- • HRC F475W
- • HRC F502N
- • HRC F550M
- • HRC F555W
- • HRC F606W
- • HRC F625W
- • HRC F658N
- • HRC F660N
- • HRC F775W
- • HRC F814W
- • HRC F850LP
- • HRC F892N
- • HRC G800L
- • HRC PR200L
- • HRC CLEAR
- • SBC F115LP
- • SBC F122M
- • SBC F125LP
- • SBC F140LP
- • SBC F150LP
- • SBC F165LP
- • SBC PR110L
- • SBC PR130L
- • 10.4 Geometric Distortion in ACS
- • Glossary
