10.4 Geometric Distortion in ACS
HRC has been unavailable since January 2007. Information regarding the HRC is provided for archival purposes only.
WFC may be offered as shared risk in Cycle 34 and receive minimal support and calibration. See the ACS website, Call for Proposals, and OPCR webpage for the latest status.
The ACS detectors exhibit more distortion than previous HST instruments. The principal reason is that the optics have been designed with a minimum number of components, consistent with correcting for the spherical aberration induced by the Optical Telescope Assembly (OTA), without introducing coma. The result is a high throughput, but with focal surfaces far from normal to the principal rays. The WFC detector is tilted at 22° giving an elongation of 8% while the HRC and SBC have a 25° tilt leading to an elongation of 12%. In each case, the scales in arcseconds per pixel are smaller along the radial direction of the OTA field of view than along the tangential direction.
The orientations of the ACS detector edges are approximately 2.1° and 2.7° offset from the V2 and V3 coordinate axes of the telescope. Consequently, the eigenaxes of the scale transformation are along the diagonals for WFC, and the apertures and pixels appear non-rectangular in the sky projection. For the HRC and SBC, the situation is even more irregular because the aperture diagonals do not lie along a radius of the HST field of view. Figure 7.9 shows the ACS apertures in the telescope's (V2, V3) reference frame. For a telescope roll angle of zero, this would correspond to an on-sky view with the V3 axis aligned with North and the V2 with East.
There is not only a strong geometric distortion of ACS detectors, but a significant variation of the scale across each detector. For the WFC, the scale changes by approximately 10% from corner to corner. For the HRC and SBC, this variation is only about 1% as they cover much smaller fields of view. The Science Instrument Aperture File (SIAF) provides the most accurate values of the scale for all instruments on board HST. SIAF-related values can be found for all instruments on the HST FoV Geometry webpage. The area on the sky covered by a WFC pixel varies by about 18% from corner to corner, corrections for which must be made in photometry of extended objects. This variation of scale creates a problematic effect in combining ACS images by the fact that an integral pixel shift near the center of the detector will translate into a non-integral displacement for pixels near the edges. Therefore, image alignment and combining require an accurate geometric distortion model. A library of ACS dither patterns are available on the ACS Dither Strategies Webpage that are designed to optimally sample the pixel phase across the detector field of view, given the geometric distortion model. Further details can be found in Section 7.4.
The HRC geometric distortion calibration is fully described in ACS ISR 2004-15. The SBC geometric distortion is described in ACS ISR 2008-02. The WFC geometric distortion is described in ACS ISR 2015-06. The geometric distortion model is expressed by high-order polynomials for each of the ACS detectors in the form of reference files called as Instrument Distortion Coefficients Tables (IDCTAB) in the FITS format. On the top of the geometric distortion described by the polynomial equations, there are additional filter-dependent components of the distortion that are presented by a 2-D array and are applied to each row/columns of the WFC or HRC images. This filter-dependent component of the distortion is applied via a calibration file called NPOLFILE. In the case of the WFC, there is an additional component of the distortion called pixel-grid irregularities. These are caused by irregularities in the manufacturing process and are also presented by 2-D array to correct each row/column on WFC images. This correction is applied via the FITS formatted D2IMFILE. All distortion reference files are installed in the ACS data pipeline and used with the Drizzlepac software distributed by STScI.
10.4.1 WFC
The rhombus shape of the WFC is evident in Figure 7.9. The angle between the X and Y axes is 84.9° for WFC1 and 86.1° for WFC2. The geometric distortion map for WFC1 and WFC2 is illustrated in Figure 10.111. A vector diagram shows the contribution of the non-linear part of a quadratic fit only. At the center of chip WFC1, the scale in the X direction is 0.0493 arcsecond/pixel, and 0.0486 arcsecond/pixel in the Y direction. In the case of WFC2, the scale is 0.0498 arcsecond/pixel in the X direction, and 0.0503 arcsecond/pixel in the Y direction. Between the corner of WFC nearest to the V1 axis and the diagonally opposite corner, the scale increases by 10%. Therefore, WFC1 forms a slightly distorted rectangle 201 × 100 arcsecond2 in size, while WFC2 is 203 × 103 arcsecond2. There is a 2.5 arcsecond gap between the two chips. Additionally, the SIAF, orientation, and exact location of the ACS/WFC in the HST V2-V3 coordinate system were calibrated with respect to Gaia DR2 using observations of the open cluster M35 (TEL ISR 2019). See the HST FoV Geometry webpage for more details.
ACS ISR 2007-08 shows that the linear terms of the WFC geometric distortion are changing over time and distortion-corrected positions are noticeable after almost 20 years on orbit, reaching about 25 milliarcseconds from the original 2002-based distortion solution (ACS ISR 2015-06, ASC-ISR-2020-09). The X-scale and Y-skew changed after SM4, but the reason for the change is not yet understood. The time-dependent distortion has been calibrated for pre- and post-SM4 (ACS ISR 2015-06) and its parameters are implemented via the IDCTAB, which is used by both the ACS data pipeline and the Drizzlepac software. Geometric distortion reference files including the IDCTAB were updated (ACS ISR 2020-09) to reflect a new geometric distortion solution derived with respect to the Gaia DR2 catalog (ACS ISR 2018-01).
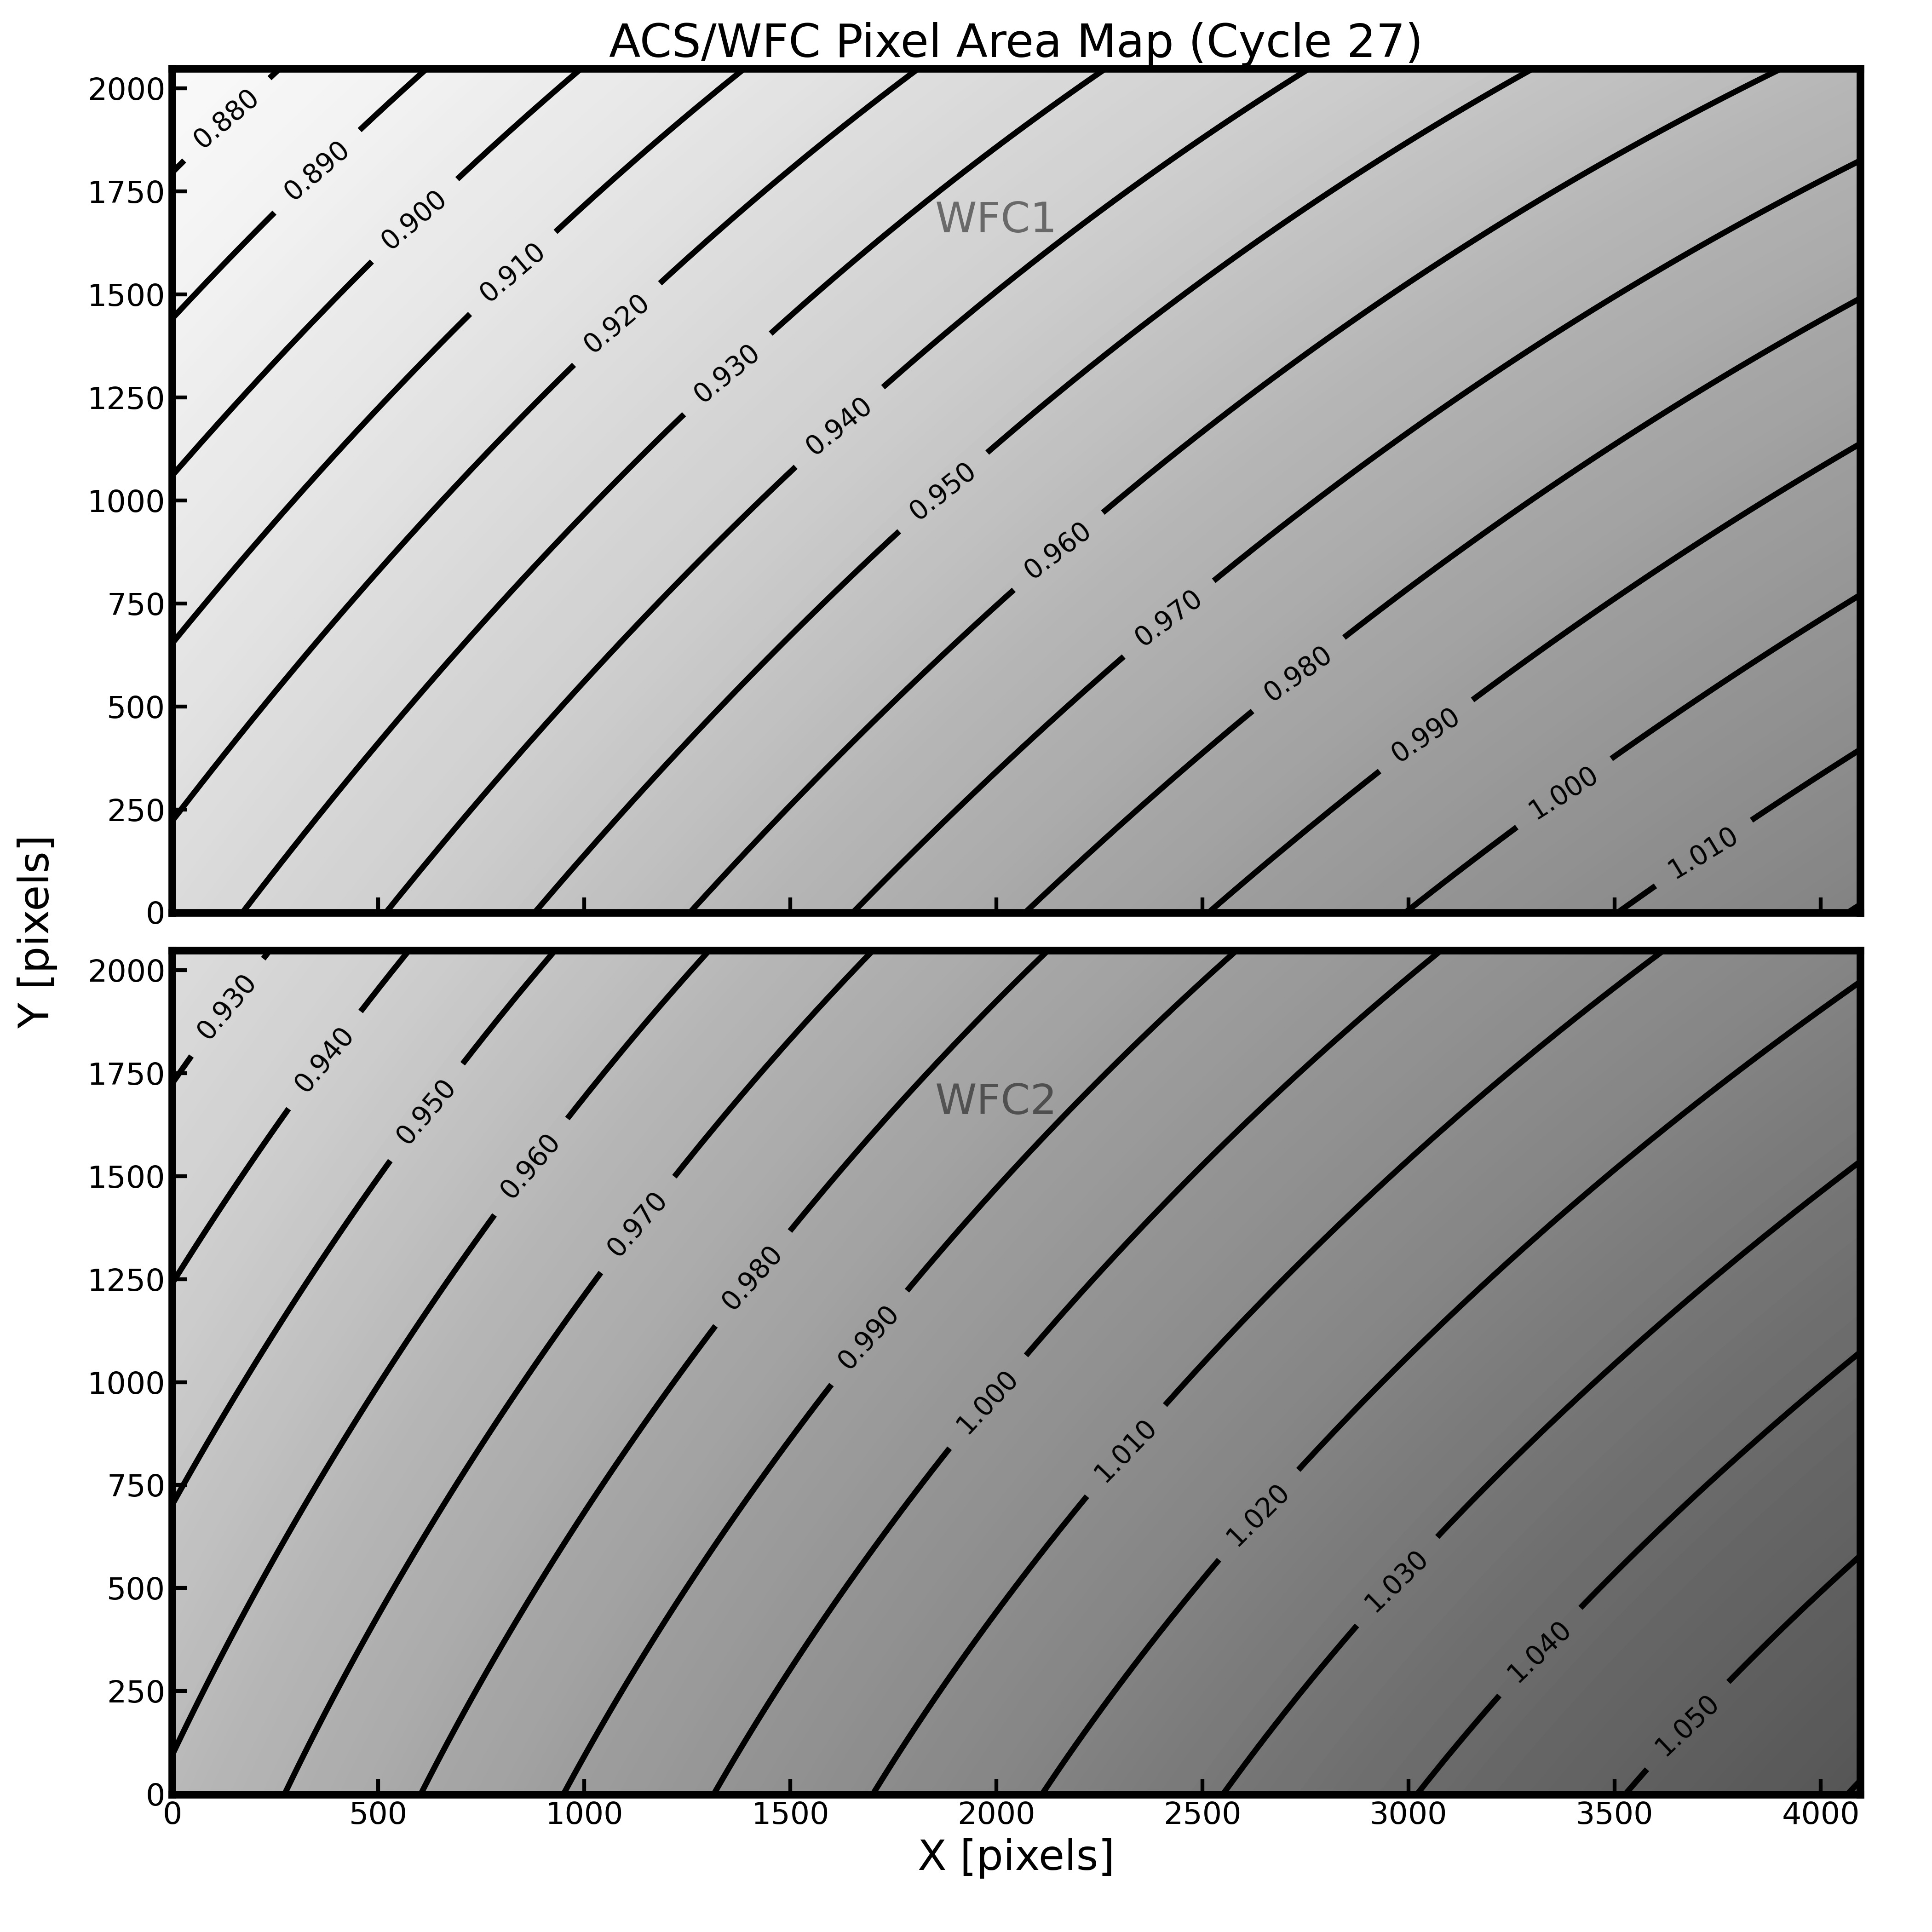
Geometric distortion affects not only the astrometry, but also the photometry, since it induces an apparent variation in surface brightness across the field of view. In order to preserve the point-source photometric accuracy of non-drizzled images, an additional correction to the photometry is required via multiplication of the ACS/WFC flat-fielded images by the pixel area map (PAM). The effective area of each pixel is shown in Figure 10.112 as a contour plot, generated from data taken in Cycle 27. The pixel area ranges from 0.88 to 1.06 times the central value. PAM files can be generated by following instructions on the Pixel Area Maps page of the ACS website. Note that non-polynomial distortion effects, tabulated in the NPOLFILE and D2IMFILE, are not included in PAMs generated by following these instructions. These PAMs change little with time; PAMs generated from 2004 and 2018 data are different by about 0.2%.
Time-averaged PAMs were created for both WFC chips and can also be accessed via the Pixel Area Maps page of the ACS website. As discussed there, the time-averaged PAMs provide photometry with 0.1% precision. These PAMs also do not include non-polynomial distortion effects.
Figure 10.111: The geometric distortion map for the ACS/WFC, which shows only the non-linear component to the solution.
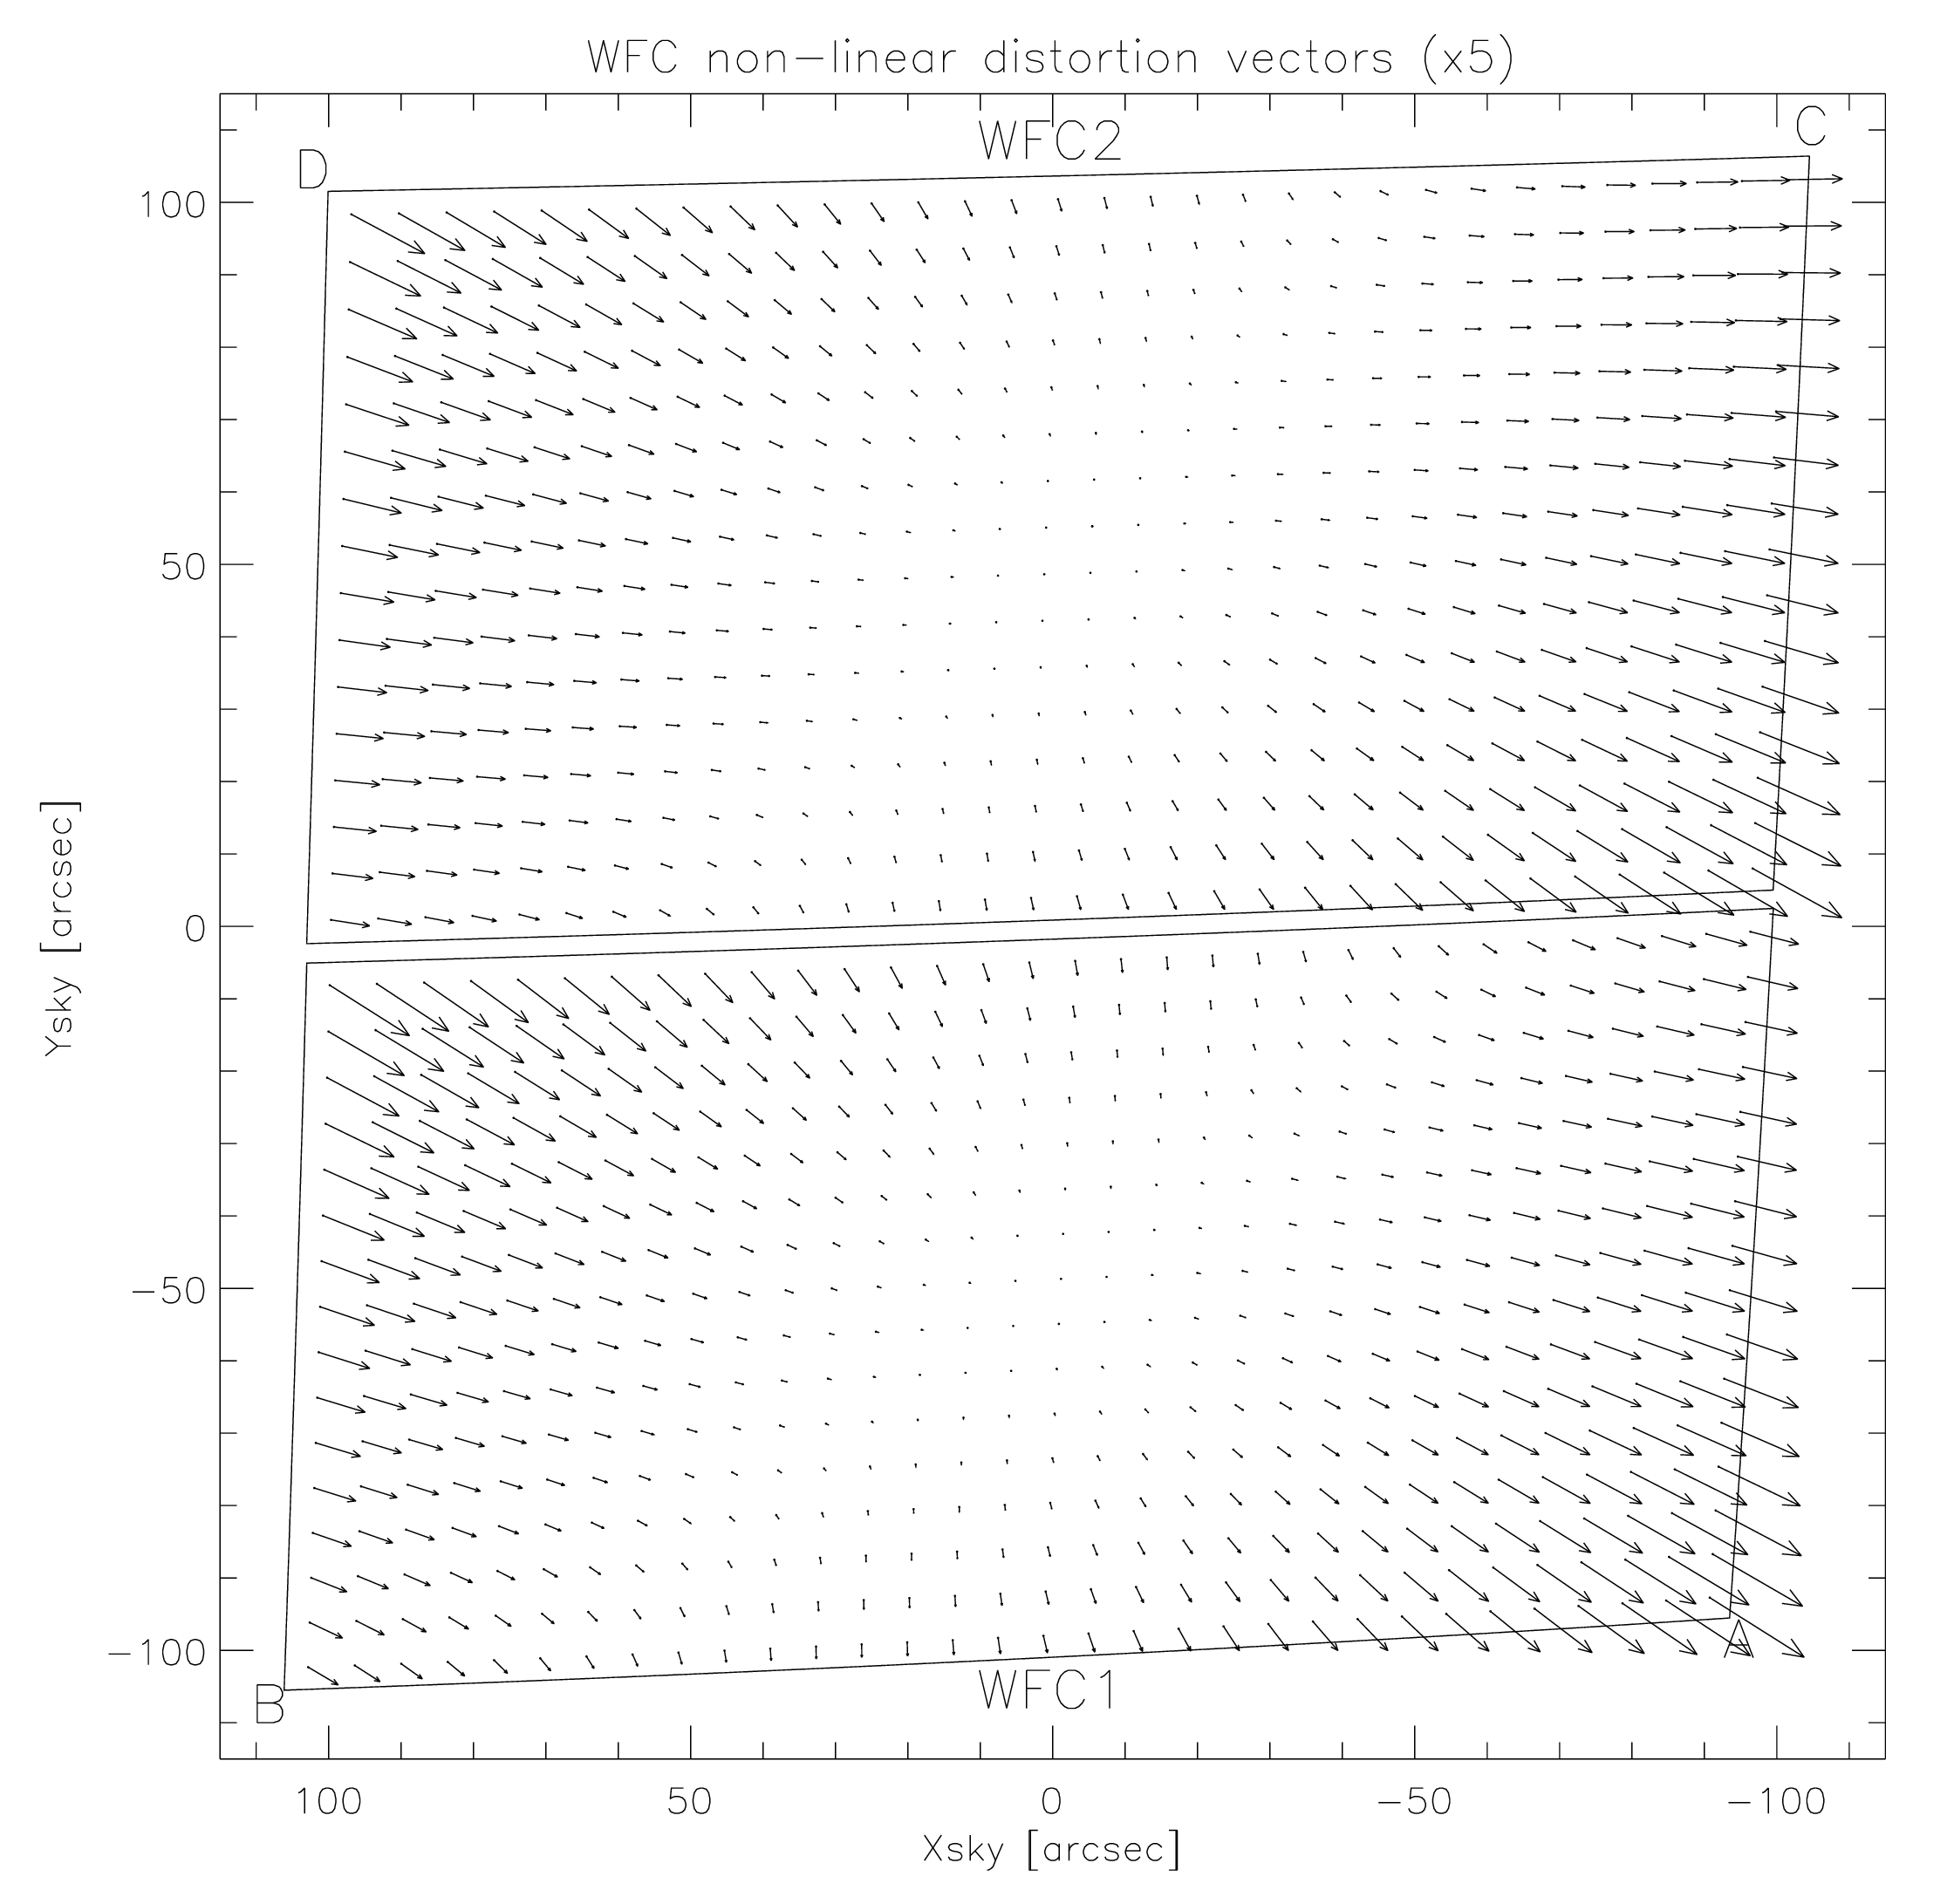
This figure is rotated 180° with respect to the pipeline calibration products, where WFC2 is the lower half of the detector.
Figure 10.112: Pixel area map of the ACS/WFC chips generated from Cycle 27 data.
10.4.2 HRC
The High Resolution Channel has its edges aligned approximately along the V2 and V3 axes. In this case, the center of the aperture lies on a line passing through the V2-V3 origin and making an angle of 22° with the V3 axis. The diagonal of the aperture does not correspond to a radius of the HST field of view, so the distortion has no particular symmetry with respect to the detector axes. The focal plane of HRC is also 25° away from the plane normal to the light path, hence the scales along the axes differ by 14%. The full field of view of the HRC is less than 30 arcseconds, therefore the scale variation over the field is much less than for the WFC, about 1%. At the center, the X and Y scales are 0.0284 and 0.0248 arcsecond/pixel respectively. The average scales across the middle of the detector are 0.02842 and 0.02485 arcsecond/pixel, making the X and Y widths 29.1 and 25.4 arcseconds. The slightly non-square projected aperture shape is evident in Figure 7.8. The angle between the X and Y axes on the sky is 84.2°. The geometric distortion map for HRC is given in Figure 10.113, where the residuals from the non-linearity are scaled by a factor of 10, with residuals as large as 0.14 arcseconds or 4.9 pixels.
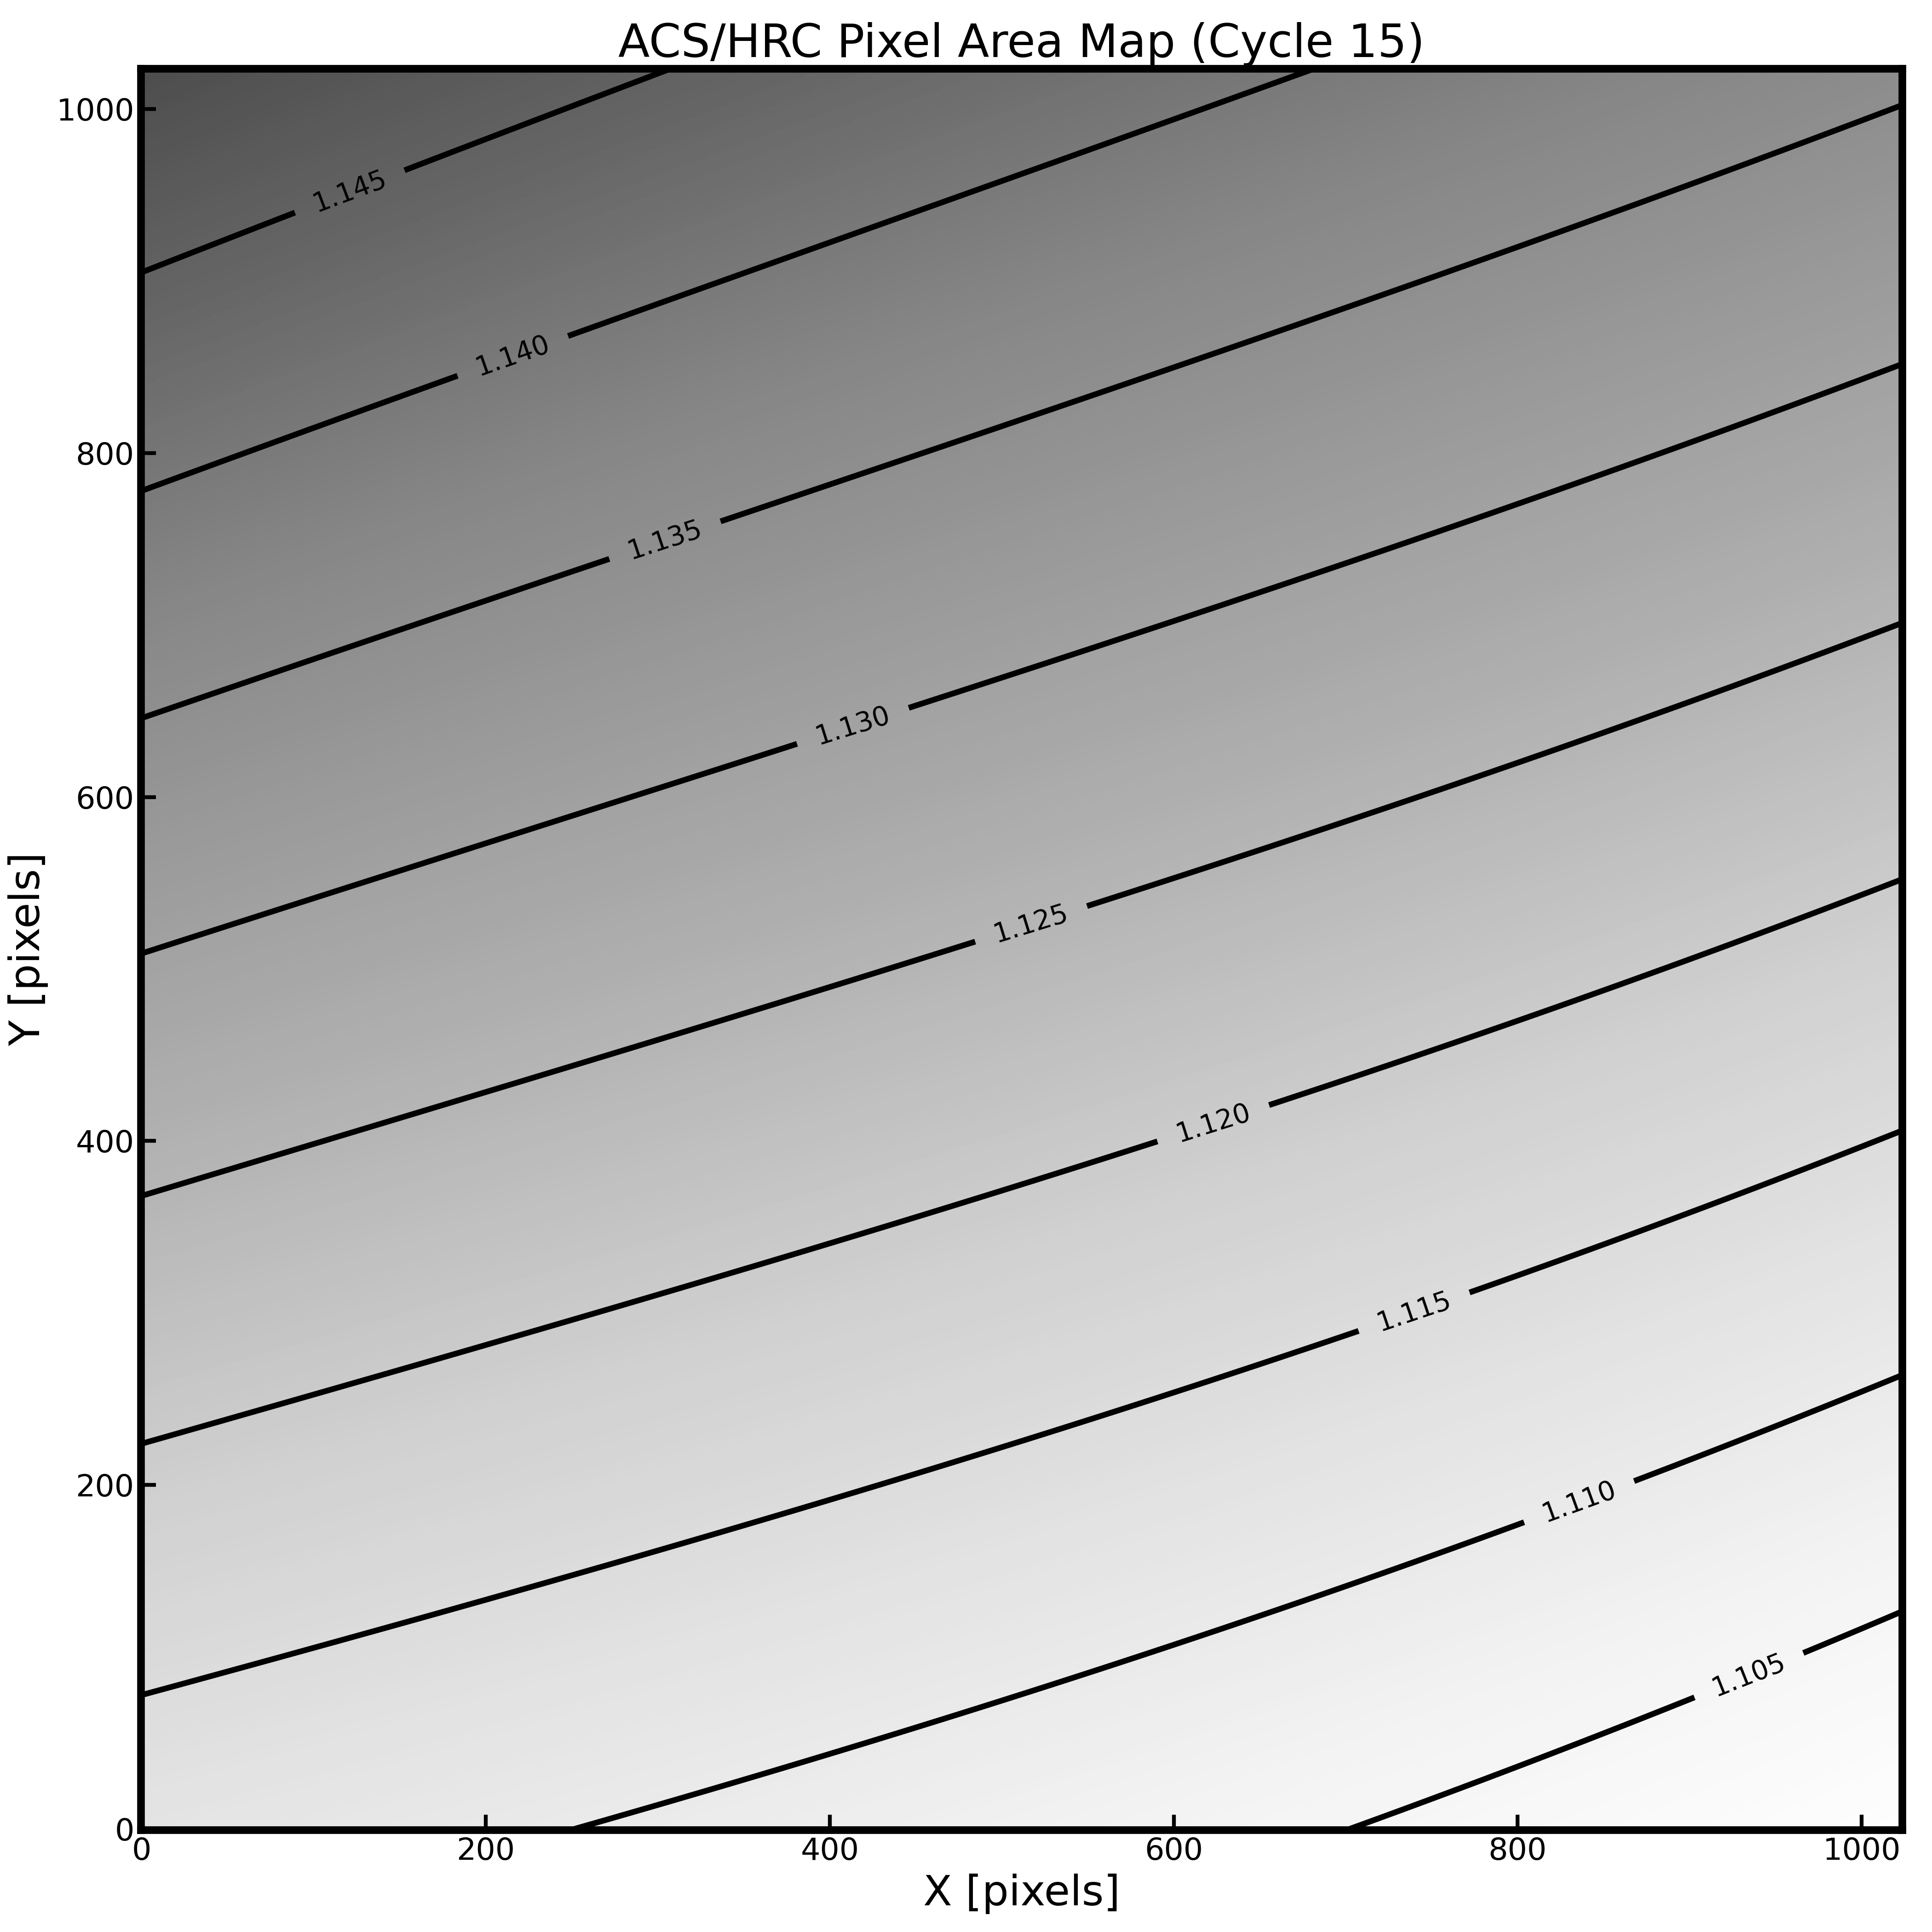
As in the case for the WFC, geometric distortion affects not only the astrometry but also the photometry, and a correction for the pixel area is required in order to restore the proper total counts of the target. The PAM generated from Cycle 15 is shown as a contour plot in Figure 10.114. The maximum deviation from the central value is about 3%. Because the PAM is normalized to square pixels of 0.025 arcsecond on a side rather than an area equal to that of the central HRC pixel, the PAM ranges from about 1.1 to 1.15. See the Pixel Area Maps page of the ACS website to access the static HRC PAM file.
Figure 10.113: The geometric distortion map for the HRC.
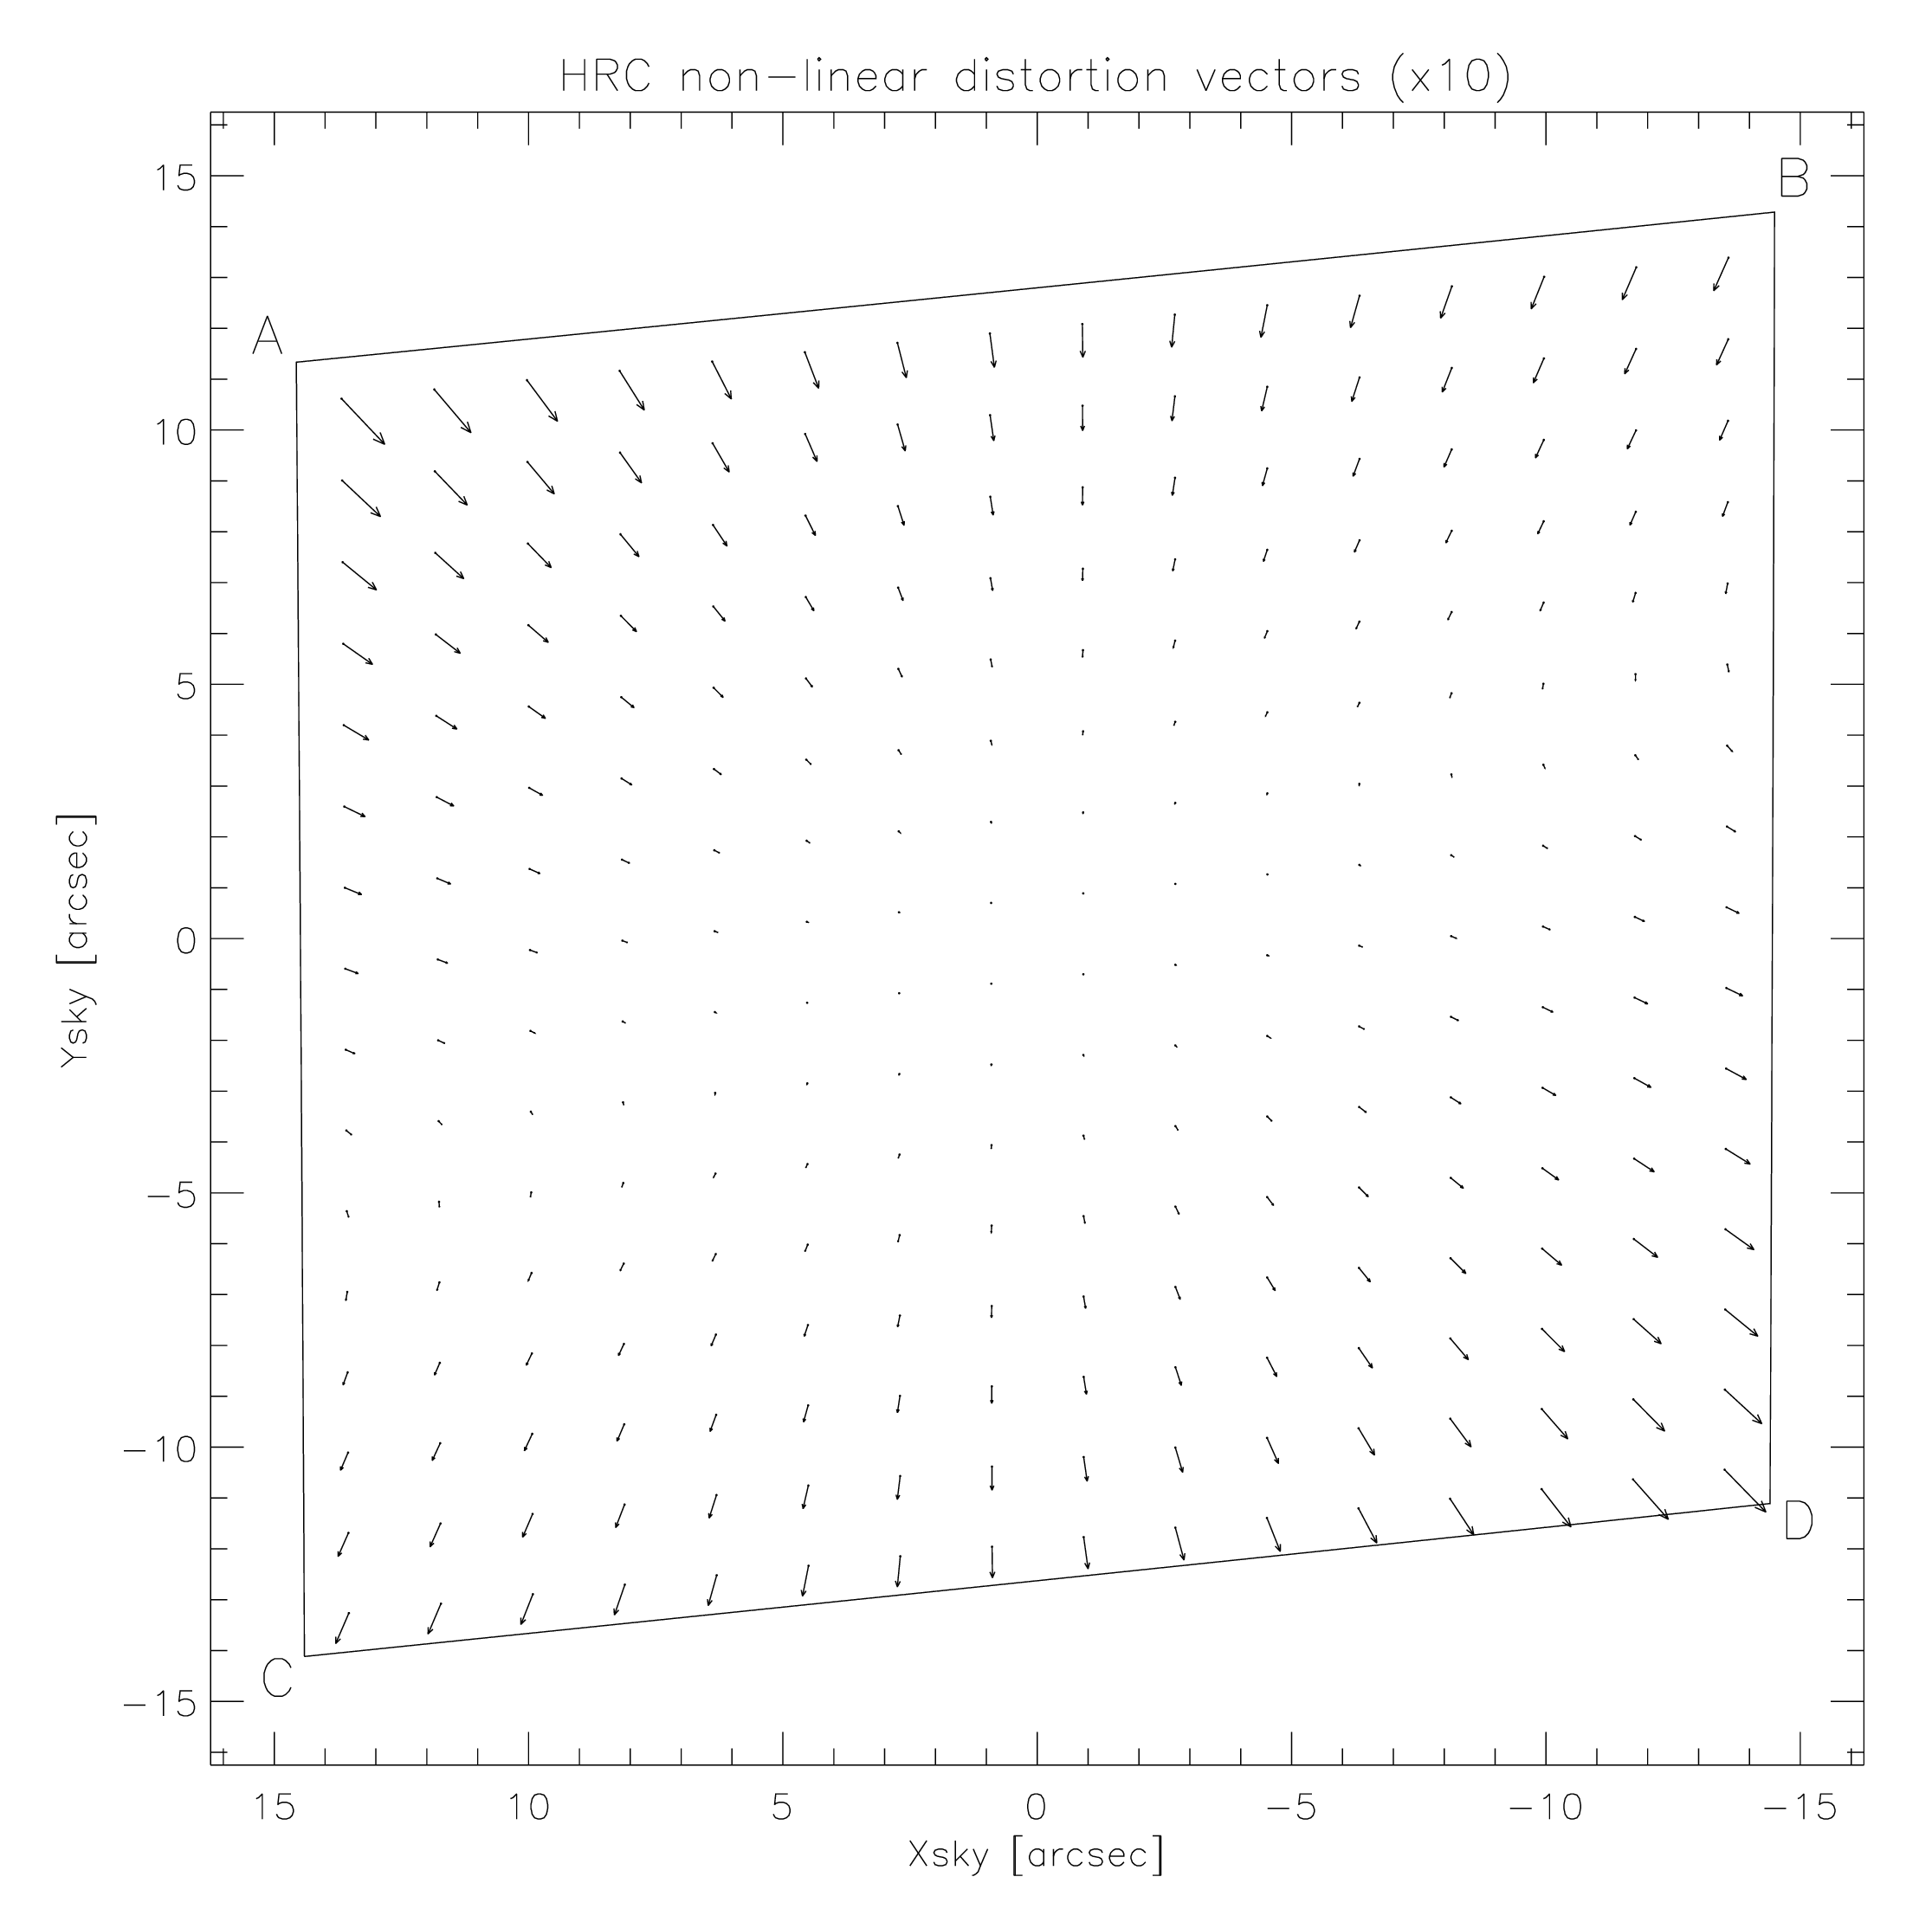
Figure 10.114: Pixel area map of the ACS/HRC chip generated from Cycle 15 data.
10.4.3 SBC
The Solar Blind Channel contains the MAMA detector, which is centered close to the HRC position in the (V2, V3) plane and has a slightly larger field of view, about ~35 × 31 arcsec2. The scales and distortions have been directly measured. The maximum distortion displacement is about 2 pixels or 0.06 arcseconds. Figure 10.115 shows the distortion map for the SBC detector.
The HRC and SBC both have much smaller fields of view than the WFC. For the SBC, the X direction scale is 0.0338 arcsecond/pixel and the Y direction scale is 0.0301 arcsecond/pixel. Similar to the HRC, the SBC exhibits a 13% difference between X and Y scales with a variation across the aperture of a little over 2%. As with the other cameras, geometric distortion affects photometry by a variation in pixel size across the SBC.
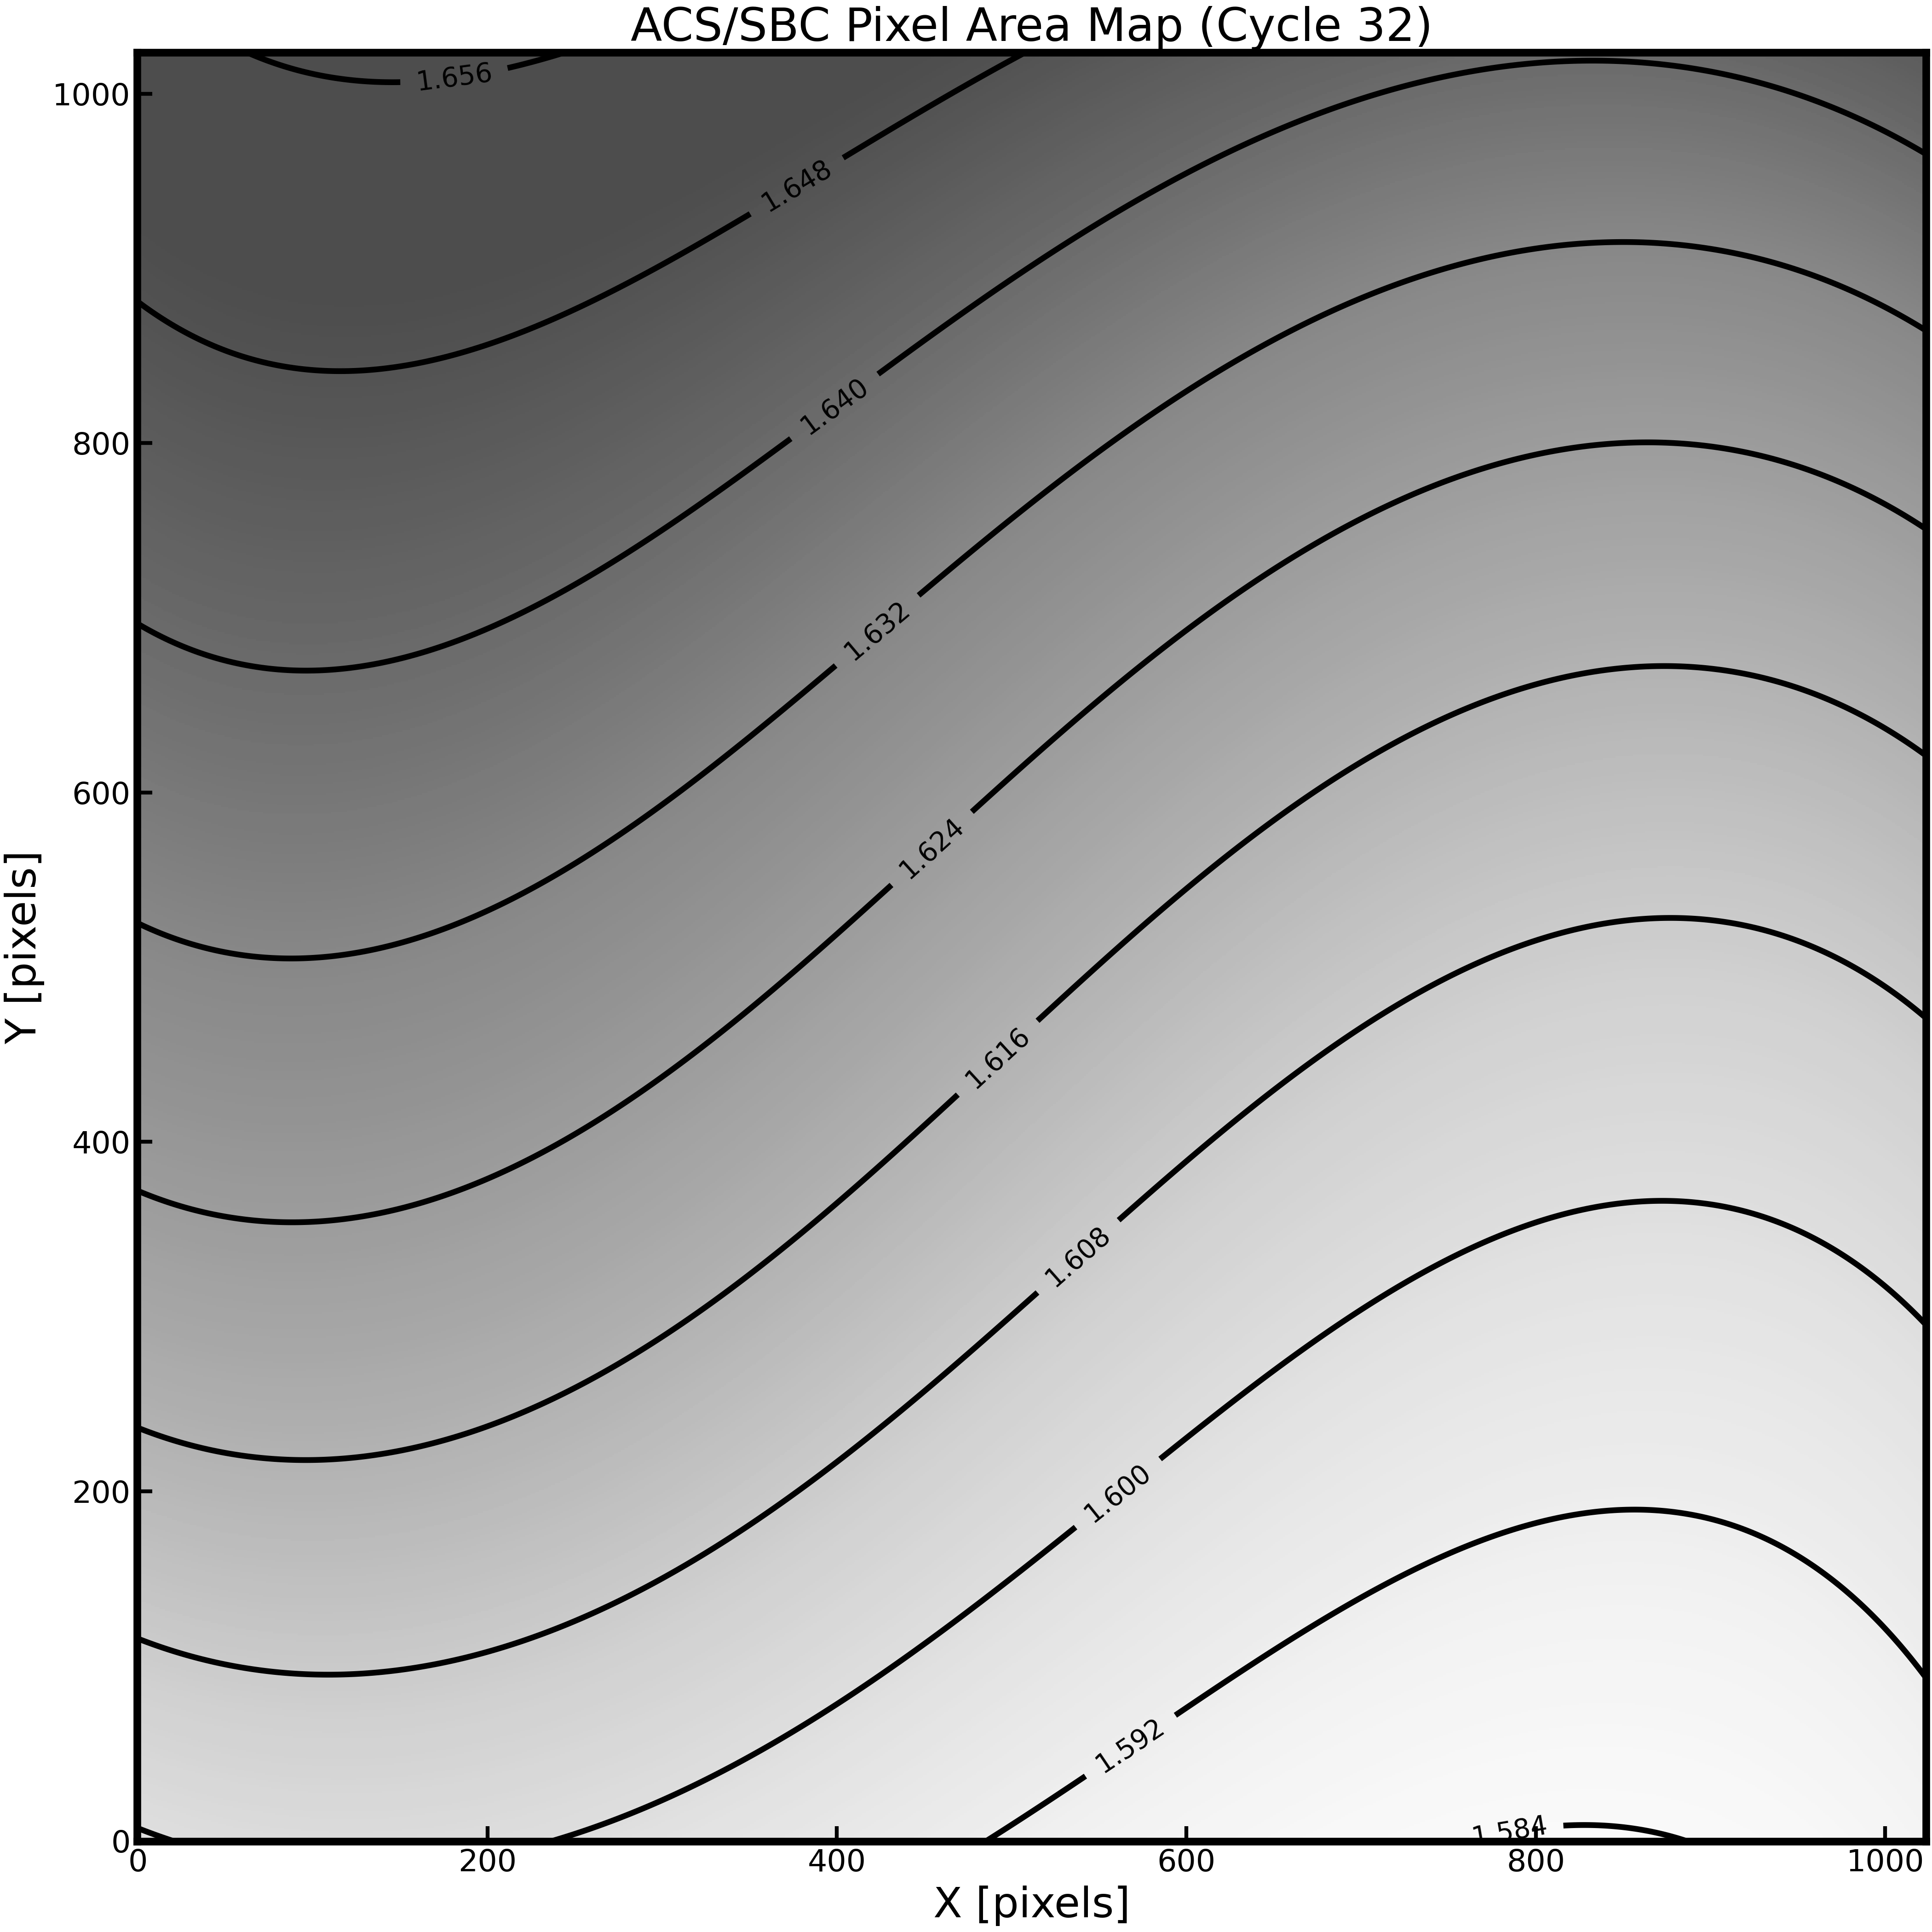
The map of the effective pixel areas of the SBC is shown in Figure 10.116. Because the pixel area map is normalized to square pixels which are 0.025 arcseconds on a side rather than an area equal to that of the central SBC pixel, the pixel area map ranges from about 1.58 to 1.65 (Meurer et al. 2003). The maximum deviation from the central value is about 5% (ACS ISR 2007-09 and ACS ISR 2008-02).
Figure 10.115: The geometric distortion map for the ACS/SBC.
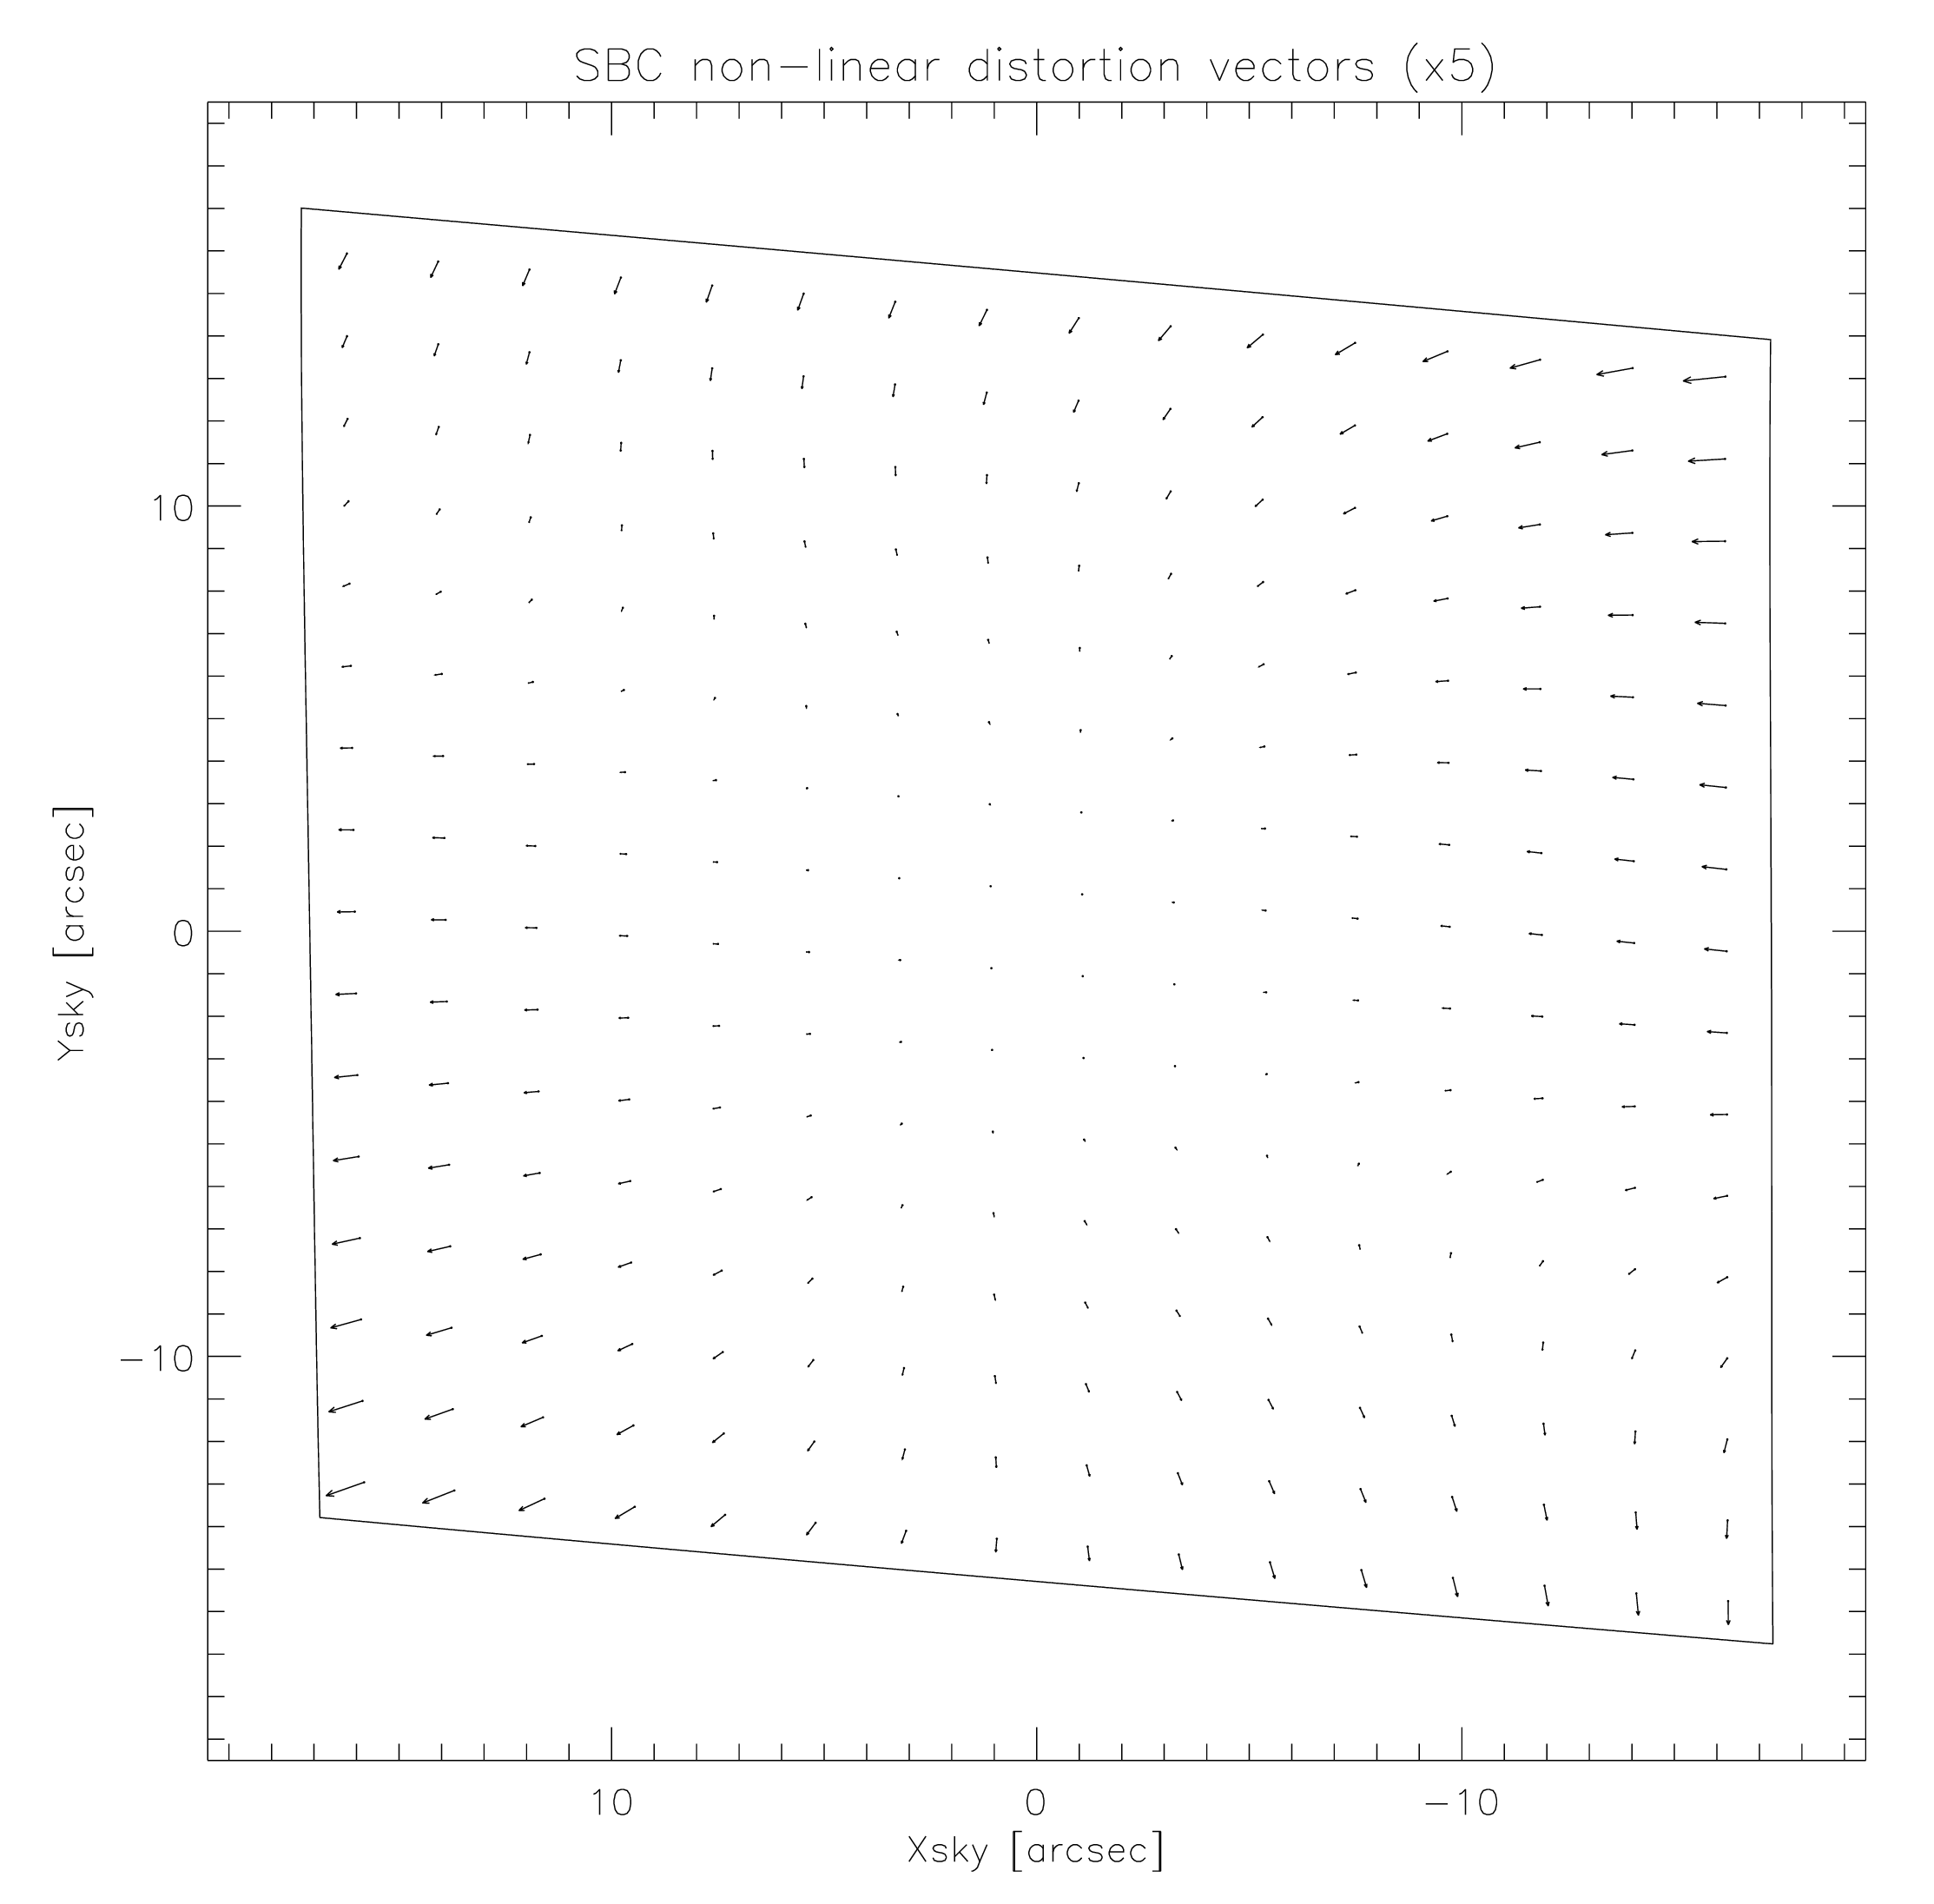
Figure 10.116: The map of the effective pixel areas of the ACS/SBC. The areas are normalized to 0.025 arcsecond square pixels.
-
ACS Instrument Handbook
- • Acknowledgments
- • Change Log
- • Chapter 1: Introduction
- Chapter 2: Considerations and Changes After SM4
- Chapter 3: ACS Capabilities, Design and Operations
- Chapter 4: Detector Performance
- Chapter 5: Imaging
- Chapter 6: Polarimetry, Coronagraphy, Prism and Grism Spectroscopy
-
Chapter 7: Observing Techniques
- • 7.1 Designing an ACS Observing Proposal
- • 7.2 SBC Bright Object Protection
- • 7.3 Operating Modes
- • 7.4 Patterns and Dithering
- • 7.5 A Road Map for Optimizing Observations
- • 7.6 CCD Gain Selection
- • 7.7 ACS Apertures
- • 7.8 Specifying Orientation on the Sky
- • 7.9 Parallel Observations
- • 7.10 Pointing Stability for Moving Targets
- Chapter 8: Overheads and Orbit-Time Determination
- Chapter 9: Exposure-Time Calculations
-
Chapter 10: Imaging Reference Material
- • 10.1 Introduction
- • 10.2 Using the Information in this Chapter
-
10.3 Throughputs and Correction Tables
- • WFC F435W
- • WFC F475W
- • WFC F502N
- • WFC F550M
- • WFC F555W
- • WFC F606W
- • WFC F625W
- • WFC F658N
- • WFC F660N
- • WFC F775W
- • WFC F814W
- • WFC F850LP
- • WFC G800L
- • WFC CLEAR
- • HRC F220W
- • HRC F250W
- • HRC F330W
- • HRC F344N
- • HRC F435W
- • HRC F475W
- • HRC F502N
- • HRC F550M
- • HRC F555W
- • HRC F606W
- • HRC F625W
- • HRC F658N
- • HRC F660N
- • HRC F775W
- • HRC F814W
- • HRC F850LP
- • HRC F892N
- • HRC G800L
- • HRC PR200L
- • HRC CLEAR
- • SBC F115LP
- • SBC F122M
- • SBC F125LP
- • SBC F140LP
- • SBC F150LP
- • SBC F165LP
- • SBC PR110L
- • SBC PR130L
- • 10.4 Geometric Distortion in ACS
- • Glossary