9.4 Detector and Sky Backgrounds
WFC may be offered as shared risk in Cycle 34 and receive minimal support and calibration. See the ACS website, Call for Proposals, and OPCR webpage for the latest status.
When calculating expected signal-to-noise ratios or exposure times, the background from the sky and the background from the detector must be taken into account.
Sky background determination is crucial for a successful observation, especially with the increasing CTE losses found in the ACS/WFC. We encourage observers to simulate the sky background for their proposed observations using the ACS ETC and to compare those values with actual on-orbit sky levels observed over the lifetime of ACS using the results from ACS ISR 2022-01 and ACS ISR 2025-04.
9.4.1 Detector Backgrounds
See Table 3.1 and Table 4.1 for read noise and dark current characteristics of the detectors, including variations by amplifier and gain for the CCDs.
9.4.2 Sky Background
The sources of sky background which will affect ACS observations include:
- Earth shine (ES).
- Zodiacal light (ZL).
- Geocoronal emission (GC).
The background in counts/second/pixel for imaging observations can be computed as:
| (1) | B_{\mathrm{sky}} = \int{I_{\lambda} S_{\lambda} m_x m_y d\lambda} |
where:
- Iλ is the surface brightness of the sky background, in erg/second/cm2/Å/arcseconds2.
- Sλ is the point source sensitivity for the imaging mode.
- mx and my are the plate scales along orthogonal axes.
The image of the sky through a disperser is not uniform, since some wavelengths fall off the detector for regions of sky near the edge of the field of view (FOV). Since the ACS grism spectra are of order 200 pixels long, the regions of lower sky will be strips at the long and short wavelength edges of the FOV. The maximum width of the strips from where the signal starts to decline to the edge, where the signal is down by roughly 2×, is about half the total length of a spectrum of a point source, i.e., roughly 100 pixels in the case of a sky background with a continuum of wavelengths. In the case of the HRC, the sky for the dispersed mode did not have the low background strips, since the FOV was not masked to the detector size. These small strips of lower sky background in the SBC and the WFC are ignored in the following formulae. Furthermore in the SBC and the WFC, since the spectra do not lie along the direction of the anamorphic distortion, the plate scales of mx and my above must be replaced by the plate scales ms and mλ in the orthogonal spatial and dispersion directions, respectively. Interior to the strips, a point on the detector sees a region of sky over the full wavelength coverage of the disperser. Thus, for spectroscopic observations:
| (2) | B_{\mathrm{sky}}^{\lambda} = \int{I_{\lambda} S^{\prime}_{\lambda} m_s m_{\lambda} d\lambda} |
For a monochromatic sky emission line at λ = L like Lyman-α, which will dominate the background through the LiF prism:
| (3) | B^L_{\mathrm{sky}} = I_L S^{\prime}_{\lambda} m_s m_{\lambda}/d |
where
- IL is the monochromatic intensity of a line at wavelength L in erg/second/cm2/ arcseconds2.
The total sky background is:
| (4) | B_{\mathrm{sky}} = B^{\lambda}_{\mathrm{sky}} + B^L_{\mathrm{sky}} |
Figure 9.1 and Table 9.6 show "high" sky background intensity as a function of wavelength, identifying the separate components which contribute to the background. The "None" and "Average" values of the Earthshine contribution in the ETC correspond, respectively, to 0 and 50% of the "High" values in Figure 9.1 and Table 9.6.
"Extremely high" Earthshine corresponds to twice the "High" value. For the zodiacal sky background, the values in Figure 9.1 and Table 9.6 and the ETCs correspond to the high value of mv = 22.1 from Table 9.4, while the "low" and "average" zodiacal light is scaled to mv = 23.3 and 22.7, respectively.
Figure 9.1: High sky background intensity as a function of wavelength.
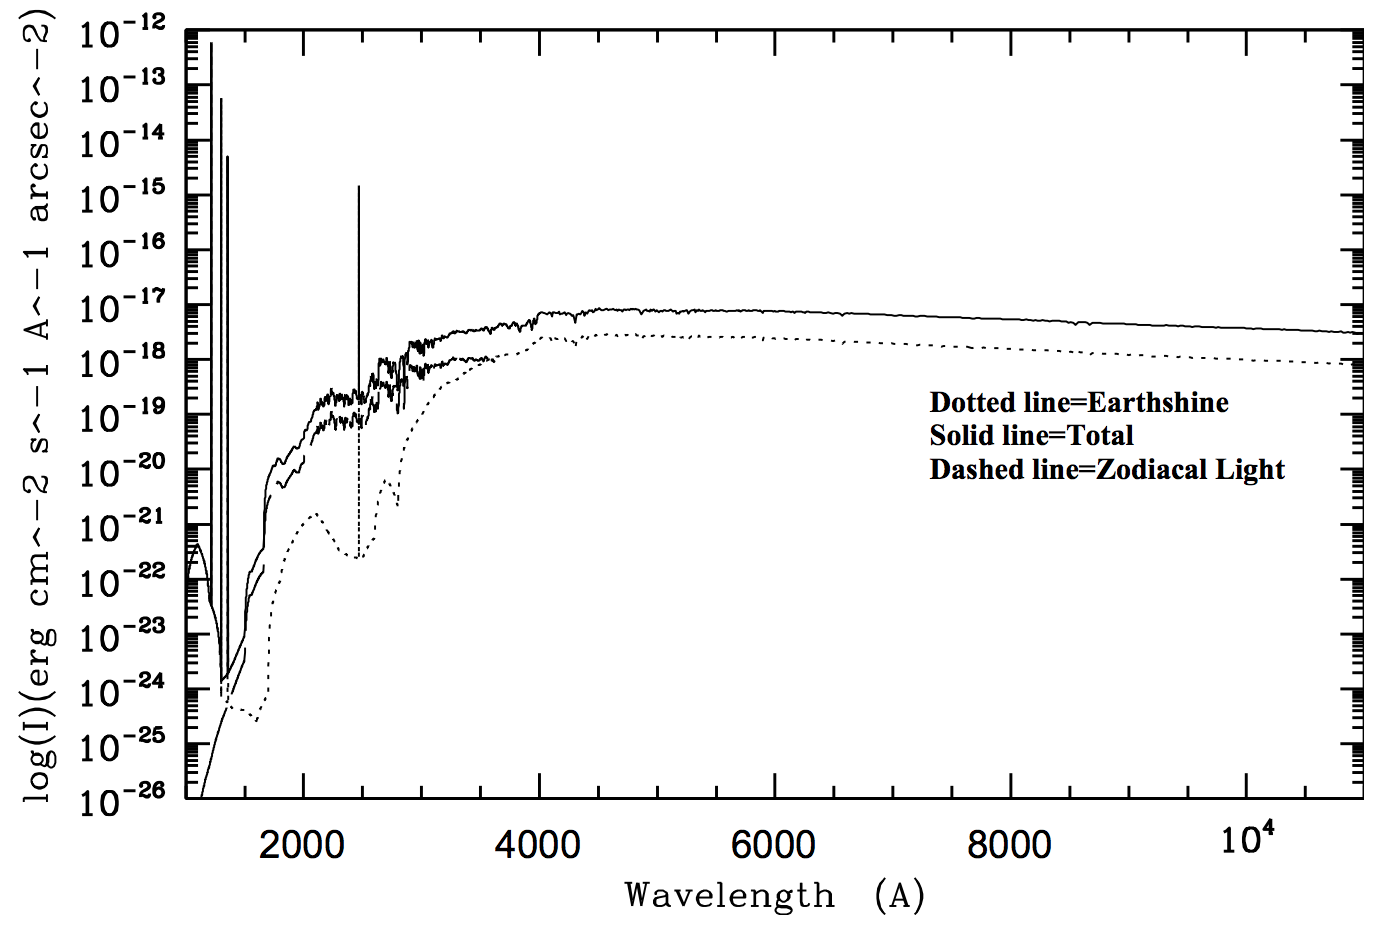
The zodiacal contribution (ZL) is at ecliptic latitude and longitude of 30° and 180°, respectively, and corresponds to mv = 22.1 per square arcseconds. The Earthshine (ES) is for a target which is 38° from the limb of the sunlit Earth. Use Figure 9.2 to estimate background contributions at other angles. The daytime geocoronal line intensities are in erg/cm2/second/arcseconds2 (see Table 9.5).
Background Variations and LOW-SKY
In the ultraviolet, the background contains bright airglow lines, which vary from day to night and as a function of HST orbital position. The airglow lines may be the dominant sky contributions in the UV both for imaging and spectroscopic observations. Away from the airglow lines, at wavelengths shortward of ~3000 Å, the background is dominated by zodiacal light, where the small area of sky that corresponds to a pixel of the high resolution HST instrumentation usually produces a signal that is much lower than the intrinsic detector background. The contribution of zodiacal light does not vary dramatically with time, and varies by only a factor of about three throughout most of the sky. Table 9.4 gives the variation of the zodiacal background as a function of ecliptic latitude and longitude. For a target near ecliptic coordinates of (50,0) or (–50,0), the zodiacal light is relatively bright at mv = 20.9, i.e., about 9 times the faintest values of mv = 23.3. Deep imaging applications must carefully consider expected sky values.
On the other hand, Earthshine varies strongly depending on the angle between the target and the bright Earth limb. The variation of the Earthshine as a function of limb angle from the sunlit Earth is shown in Figure 9.2. This figure also shows the contribution of the Moon, which is typically much smaller than the zodiacal contribution, for which the upper and lower limits are shown. For reference, the limb angle is approximately 24° when the HST is aligned toward its orbit pole (i.e., the center of the CVZ), and this limb angle corresponds to "Extremely High" Earthshine. The Earthshine contribution shown in Figure 9.1 and Table 9.6 corresponds to a limb angle of 30°, High Earthshine.
For observations taken longward of 3500 Å, the Earthshine dominates the background at small (<22°) limb angles. In fact, the background increases exponentially for limb angles <22°. The background near the bright limb can also vary by a factor of ~2 on timescales as short as two minutes, which suggests that the background from Earthshine also depends upon the reflectivity of the terrain over which HST passes during the course of an exposure. Details of the sky background as it affects ACS, as well as STIS, are discussed in STIS ISR 1998-21. The impact of Earthshine on ACS observations is discussed in ACS ISR 2003-05.
Figure 9.2: Background contributions in V magnitude per arcseconds2.
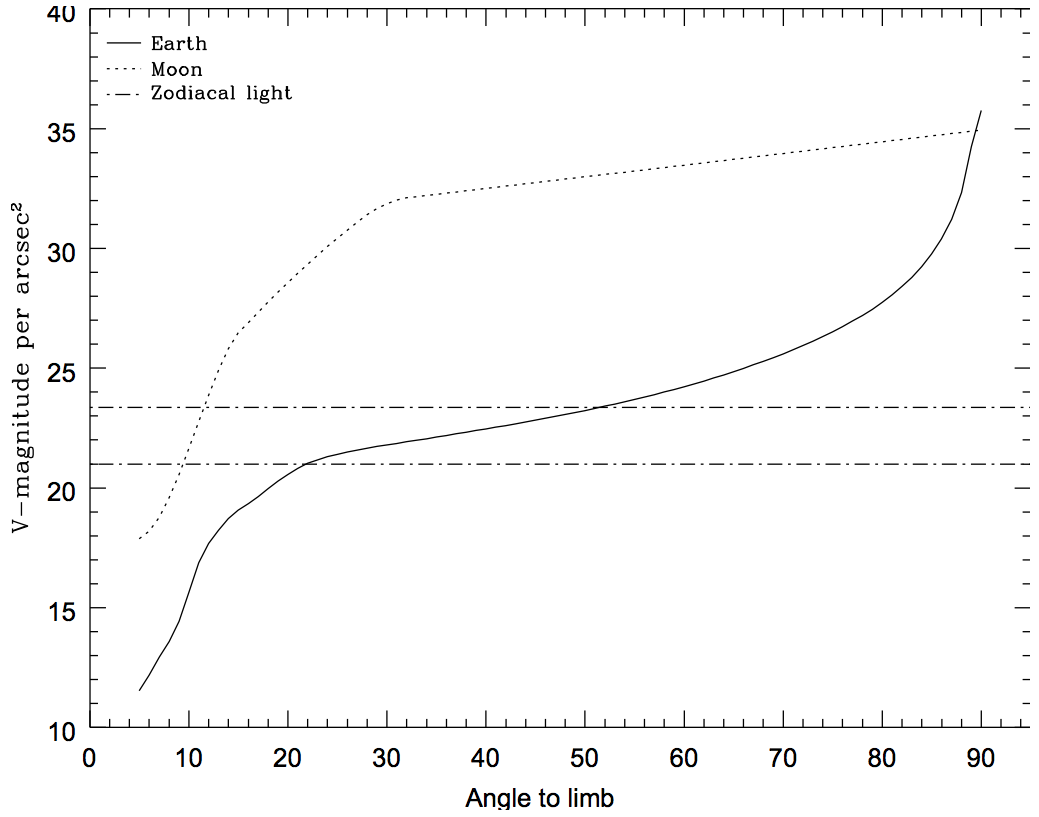
Background due to the zodiacal light, Moon, and the sunlit Earth, as a function of angle between the target and the limb of the Earth or Moon. The two zodiacal light lines show the extremes of possible values.
Table 9.4: Approximate zodiacal sky background as a function of ecliptic latitude and ecliptic longitude. (In V magnitudes per square arcseconds.)
Ecliptic longitude (degrees) | Ecliptic latitude (degrees) | |||
0 | 30 | 60 | 90 | |
180 | 22.1 | 22.7 | 23.2 | 23.3 |
145 | 22.4 | 22.9 | 23.3 | 23.3 |
110 | 22.3 | 22.9 | 23.3 | 23.3 |
50 | 20.9 | 22.2 | 22.9 | 23.3 |
Observations of the faintest objects may need the special requirement LOW-SKY in the Phase II observing program. LOW-SKY observations are scheduled during the part of the year when the zodiacal background light is no more than 30% greater than the minimum possible zodiacal light for the given sky position. LOW-SKY in the Phase II scheduling also invokes the restriction that exposures will be taken only at angles greater than 40° from the bright Earth limb to minimize Earthshine and the UV airglow lines. The LOW-SKY special requirement limits the times at which targets within 60° of the ecliptic plane will schedule, and limits visibility to about 48 minutes per orbit. The use of LOW-SKY must be requested and justified in the Phase I Proposal.
The ETC provides the user with the flexibility to separately adjust both the zodiacal (Low, Average, High) and Earthshine (None, Average, High, Extremely High) sky background components in order to determine if planning for use of LOW-SKY is advisable for a given program. However, the absolute sky levels that can be specified in the ETC may not be achievable for a given target; e.g., as shown in Table 9.4, the zodiacal background minimum for an ecliptic target is mv = 22.4, which is still brighter than both the low and average options with the ETC. By contrast, a target near the ecliptic pole would always have a zodiacal = low background in the ETC. The user is cautioned to carefully consider sky levels as the backgrounds obtained in HST observations can cover significant ranges.
Geocoronal Emission and Shadow
Background due to geocoronal emission originates mainly from hydrogen and oxygen atoms in the exosphere of the Earth. The emission is concentrated in the four lines listed in Table 9.5. The brightest line is Lyman-α at 1216 Å. The strength of the Lyman-α line varies between about 2 and ~30 kilo-Rayleighs (i.e., between 6.1 × 10⁻¹⁴ and 6.1 × 10⁻¹³ erg/second/cm2/arcseconds2 where 1 Rayleigh = 106 photons/second/cm per 4π steradian) depending on the position of HST with respect to the day-night terminator and the position of the target relative to the Earth limb. The next strongest line is the OI line at 1304 Å, which rarely exceeds 10% of Lyman-α. The typical strength of the OI 1304 Å line is about 1 kilo-Rayleighs (which corresponds to about 2.85 × 10⁻¹⁴ erg/second/cm2/arcseconds2) on the daylight side and about 75 times fainter on the night side of the HST orbit. OI 1356 Å and OI 2471 Å lines may appear in observations on the daylight side of the orbit, but these lines are ~10 times weaker than the OI 1304 Å line. The width of the lines also vary with temperature, the line widths given in Table 9.5 are representative values assuming a temperature of 2000 °K.
Analysis of the >20 years of ACS/SBC observations (ACS ISR 2025-04) has demonstrated that the background is highly variable in the filters dominated by geocoronal emission – F115LP, F122M, F125LP, and F140LP. However, the average background encountered in these filters is usually significantly lower than what had had been previously estimated by the ETC. These seems to be due to at least one of the OI lines generally being significantly fainter than predicted by models. Therefore, ETC v34.1 onwards include an empirical background model based on archival data, that incorporates all sources of background (geocoronal emission, earthshine, zodiacal light, and dark current). More details can be found on the backgrounds page of the ETC user guide.
Except for the brightest objects (e.g., planets), a filter or prism mode which does not transmit at Lyman-α should be employed. To minimize geocoronal emission the special requirement SHADOW can be requested. Exposures using this special requirement are limited to roughly 25 minutes per orbit, exclusive of the guide-star acquisition (or reacquisition), and can be scheduled only during a small percentage of the year. SHADOW reduces the contribution from the geocoronal emission lines by roughly a factor of ten while the continuum Earthshine is set to zero. SHADOW requirements must be included and justified in your Phase I proposal (see the Call for Proposals).
Observing at higher Earth limb angles also reduces backgrounds in the filters affected by geocoronal emission. This affect appears to be particularly pronounced in F125LP and F140LP, where limb angles of >50 deg typically have backgrounds 10%–20% lower than when observing at limb angles <20 deg (see ACS ISR 2025-04). The LOW-SKY special requirement imposes a minimum Earth limb angle of 40 deg. A need for the LOW-SKY special requirement must be explicitly included and justified in your Phase I proposal.
Table 9.5: Geocoronal emission lines.
Wavelength | ID | Line width (Å) | Intensity | |||
Day | Night | |||||
kilo- | erg/s/cm2/arcsec2 | kilo- | erg/s/cm2/arcsec2 | |||
1216 | Ly-α | 0.04 | ~20 | 6.1 x 10⁻¹³ | 2 | 6.1 x 10⁻¹⁴ |
1304 | OI | 0.013 | ~2 | 5.7 x 10⁻¹⁴ | 0.013 | 3.8 x 10⁻¹⁶ |
1356 | OI | 0.013 | ~0.2 | ~5 x 10–15 | ~0.001 | ~3 x 10–17 |
2471 | OI | 0.023 | <0.2 | <3 x 10–15 | <0.001 | <1.5 x 10⁻¹⁷ |
-
ACS Instrument Handbook
- • Acknowledgments
- • Change Log
- • Chapter 1: Introduction
- Chapter 2: Considerations and Changes After SM4
- Chapter 3: ACS Capabilities, Design and Operations
- Chapter 4: Detector Performance
- Chapter 5: Imaging
- Chapter 6: Polarimetry, Coronagraphy, Prism and Grism Spectroscopy
-
Chapter 7: Observing Techniques
- • 7.1 Designing an ACS Observing Proposal
- • 7.2 SBC Bright Object Protection
- • 7.3 Operating Modes
- • 7.4 Patterns and Dithering
- • 7.5 A Road Map for Optimizing Observations
- • 7.6 CCD Gain Selection
- • 7.7 ACS Apertures
- • 7.8 Specifying Orientation on the Sky
- • 7.9 Parallel Observations
- • 7.10 Pointing Stability for Moving Targets
- Chapter 8: Overheads and Orbit-Time Determination
- Chapter 9: Exposure-Time Calculations
-
Chapter 10: Imaging Reference Material
- • 10.1 Introduction
- • 10.2 Using the Information in this Chapter
-
10.3 Throughputs and Correction Tables
- • WFC F435W
- • WFC F475W
- • WFC F502N
- • WFC F550M
- • WFC F555W
- • WFC F606W
- • WFC F625W
- • WFC F658N
- • WFC F660N
- • WFC F775W
- • WFC F814W
- • WFC F850LP
- • WFC G800L
- • WFC CLEAR
- • HRC F220W
- • HRC F250W
- • HRC F330W
- • HRC F344N
- • HRC F435W
- • HRC F475W
- • HRC F502N
- • HRC F550M
- • HRC F555W
- • HRC F606W
- • HRC F625W
- • HRC F658N
- • HRC F660N
- • HRC F775W
- • HRC F814W
- • HRC F850LP
- • HRC F892N
- • HRC G800L
- • HRC PR200L
- • HRC CLEAR
- • SBC F115LP
- • SBC F122M
- • SBC F125LP
- • SBC F140LP
- • SBC F150LP
- • SBC F165LP
- • SBC PR110L
- • SBC PR130L
- • 10.4 Geometric Distortion in ACS
- • Glossary