5.6 ACS Point Spread Functions
HRC has been unavailable since January 2007. Information about the HRC is provided for archival purposes.
WFC is offered as shared risk in Cycle 33 and may receive minimal calibration. See the ACS website, Call for Proposals, and OPCR webpage for the latest status.
The ACS point spread function (PSF) has been studied in ground test measurements, and by using on-orbit data and models generated by the Tiny Tim software developed by J. Krist and R. Hook (note that the Tiny Tim software is no longer maintained or supported by STScI). As with other HST instruments, the ACS point spread function is affected by both optical aberrations and geometric distortions. Point sources imaged with WFC and HRC experience blurring due to charge diffusion into adjacent pixels, which reduces the limiting magnitudes that can be reached by WFC/HRC. The SBC PSF and the long-wavelength HRC PSF are also affected by a halo produced by the detectors themselves.
5.6.1 CCD Pixel Response Function
The sharpness of the CCD PSF is somewhat degraded by charge diffusion into adjacent pixels. The effect is usually described in terms of the pixel response function (PRF), which gives the distribution of flux from within the pixel into adjacent pixels. Charge diffusion results in ~0.5 magnitude loss in the WFC limiting magnitude at short wavelengths (the worst case). At longer wavelengths, and at all wavelengths for the HRC, the reduction in the limiting magnitude is ~0.2 magnitudes or less. Due to variations in the CCD thickness, charge diffusion is not constant over the field of view. At different wavelengths, the CCD pixel response functions can be represented by the following kernels (for the center of the field):
| (1) | K_{\mathrm{HRC}} = \left[ \begin{matrix} 0.02 & 0.07 & 0.02 \\ 0.07 & 0.64 & 0.07 \\ 0.02 & 0.07 & 0.02 \end{matrix} \right], \ \ K_{\mathrm{WFC}} = \left[ \begin{matrix} 0.04 & 0.11 & 0.04 \\ 0.11 & 0.40 & 0.11 \\ 0.04 & 0.11 & 0.04 \end{matrix} \right] |
at λ = 4000 Å,
| (2) | K_{\mathrm{HRC}} = \left[ \begin{matrix} 0.02 & 0.06 & 0.02 \\ 0.06 & 0.68 & 0.06 \\ 0.02 & 0.06 & 0.02 \end{matrix} \right], \ \ K_{\mathrm{WFC}} = \left[ \begin{matrix} 0.03 & 0.10 & 0.03 \\ 0.10 & 0.48 & 0.10 \\ 0.03 & 0.10 & 0.03 \end{matrix} \right] |
at λ = 5500 Å, and
| (3) | K_{\mathrm{HRC}} = \left[ \begin{matrix} 0.02 & 0.04 & 0.02 \\ 0.04 & 0.76 & 0.04 \\ 0.02 & 0.04 & 0.02 \end{matrix} \right], \ \ K_{\mathrm{WFC}} = \left[ \begin{matrix} 0.02 & 0.07 & 0.02 \\ 0.07 & 0.64 & 0.07 \\ 0.02 & 0.07 & 0.02 \end{matrix} \right] |
at λ = 8000 Å.
Due to optical and charge diffusion effects, the WFC and HRC PSFs vary across the detectors as explained in ACS ISR 2003-06.
5.6.2 Model PSFs
Table 5.8 and Table 5.9 give model PSFs for WFC and HRC in the central 5 × 5 pixel region in two filters. Numbers listed are the fraction of the total energy received in each pixel. The models have been generated using Tiny Tim, taking into account the HST optical aberrations and obscurations as well as the CCD pixel response function. Field-dependent geometrical distortions are included. The real PSF will also differ from the model because of the jitter in the HST pointing, HST focus variation (focus breathing), and other instrumental effects, some of which are briefly discussed below. The spatial PSF variations of the WFC and HRC detectors are fully described in ACS ISR 2004-15, ACS ISR 2006-01, ACS ISR 2018-08, and ACS ISR 2023-06.
Table 5.8: ACS Model PSFs in the central 5x5 pixel region (CCD).
WFC model PSF, filter F435W | WFC model PSF, filter F814W | |||||||||
0.00 | 0.01 | 0.01 | 0.01 | 0.00 | 0.01 | 0.01 | 0.02 | 0.01 | 0.01 | |
0.01 | 0.04 | 0.07 | 0.05 | 0.02 | 0.01 | 0.03 | 0.07 | 0.03 | 0.02 | |
0.02 | 0.08 | 0.17 | 0.08 | 0.02 | 0.02 | 0.07 | 0.18 | 0.07 | 0.02 | |
0.01 | 0.04 | 0.08 | 0.04 | 0.01 | 0.01 | 0.03 | 0.07 | 0.03 | 0.01 | |
0.00 | 0.01 | 0.02 | 0.01 | 0.00 | 0.01 | 0.02 | 0.02 | 0.01 | 0.00 | |
HRC model PSF, filter F435W | HRC model PSF, filter F814W | |||||||||
0.01 | 0.01 | 0.01 | 0.01 | 0.01 | 0.00 | 0.01 | 0.02 | 0.01 | 0.00 | |
0.02 | 0.03 | 0.06 | 0.03 | 0.01 | 0.01 | 0.04 | 0.05 | 0.04 | 0.01 | |
0.01 | 0.06 | 0.16 | 0.06 | 0.01 | 0.02 | 0.05 | 0.08 | 0.05 | 0.02 | |
0.01 | 0.03 | 0.07 | 0.03 | 0.01 | 0.01 | 0.04 | 0.05 | 0.04 | 0.01 | |
0.01 | 0.02 | 0.01 | 0.01 | 0.01 | 0.00 | 0.01 | 0.02 | 0.01 | 0.00 | |
Table 5.9: ACS Model PSFs in central 5x5 pixel region (SBC).
SBC PSF at 120 nm | SBC PSF at 160 nm | |||||||||
<0.01 | 0.01 | 0.01 | 0.01 | <0.01 | <0.01 | <0.01 | <0.01 | <0.01 | <0.01 | |
0.01 | 0.02 | 0.03 | 0.02 | 0.01 | <0.01 | 0.02 | 0.04 | 0.02 | <0.01 | |
0.01 | 0.03 | 0.15 | 0.03 | 0.01 | <0.01 | 0.04 | 0.20 | 0.04 | <0.01 | |
0.01 | 0.02 | 0.03 | 0.02 | 0.01 | <0.01 | 0.02 | 0.04 | 0.02 | <0.01 | |
<0.01 | 0.01 | 0.01 | 0.01 | <0.01 | <0.01 | <0.01 | <0.01 | <0.01 | <0.01 | |
5.6.3 Encircled Energy
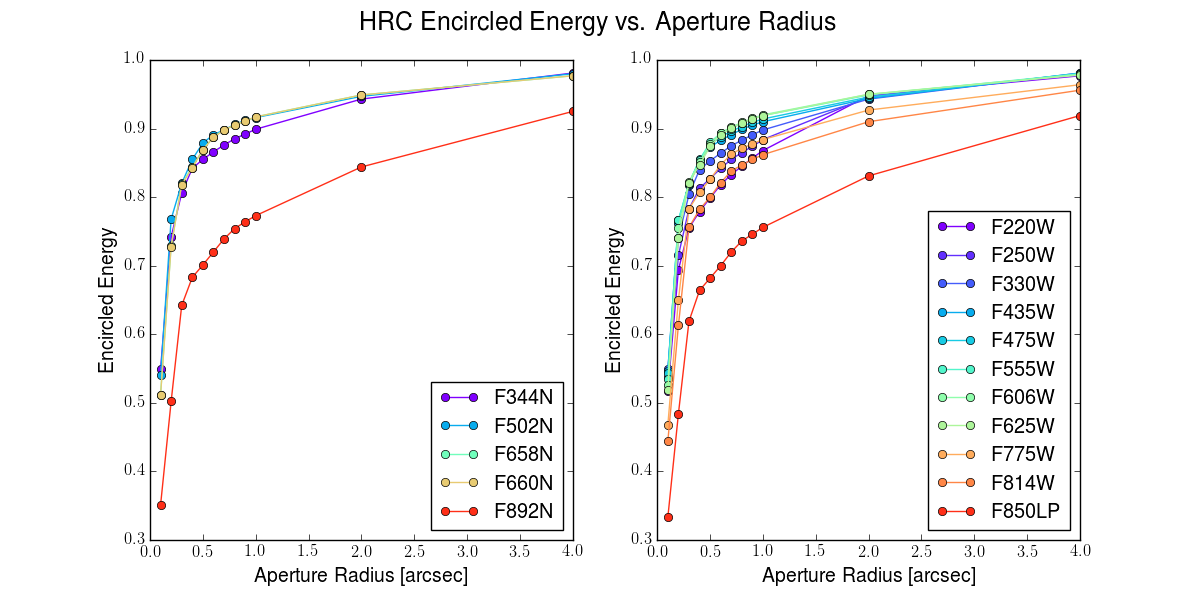
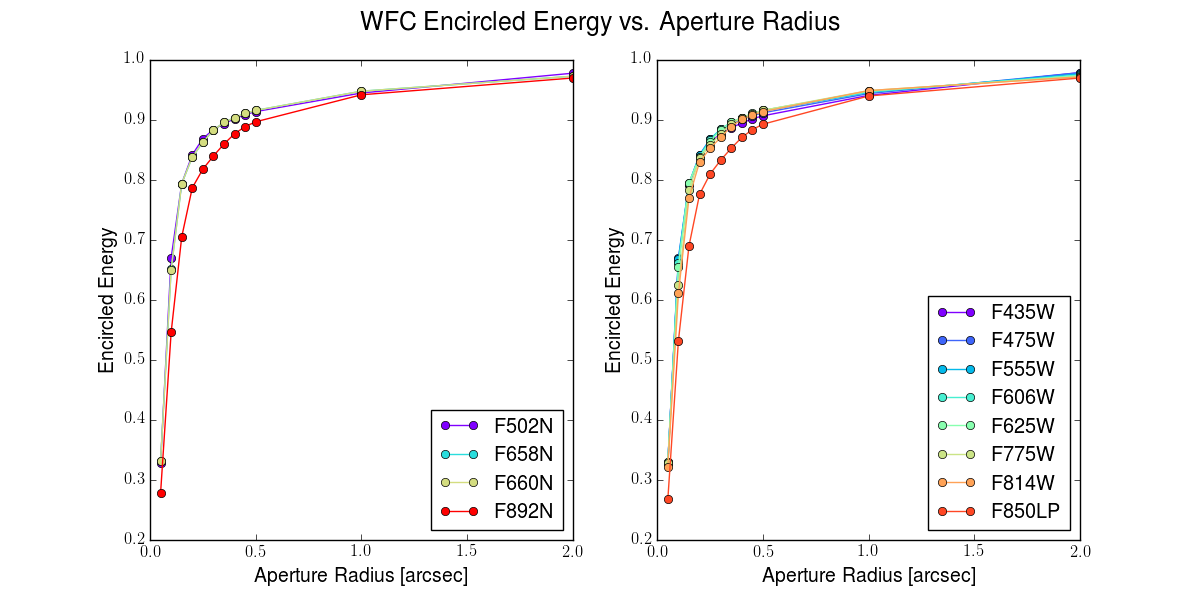
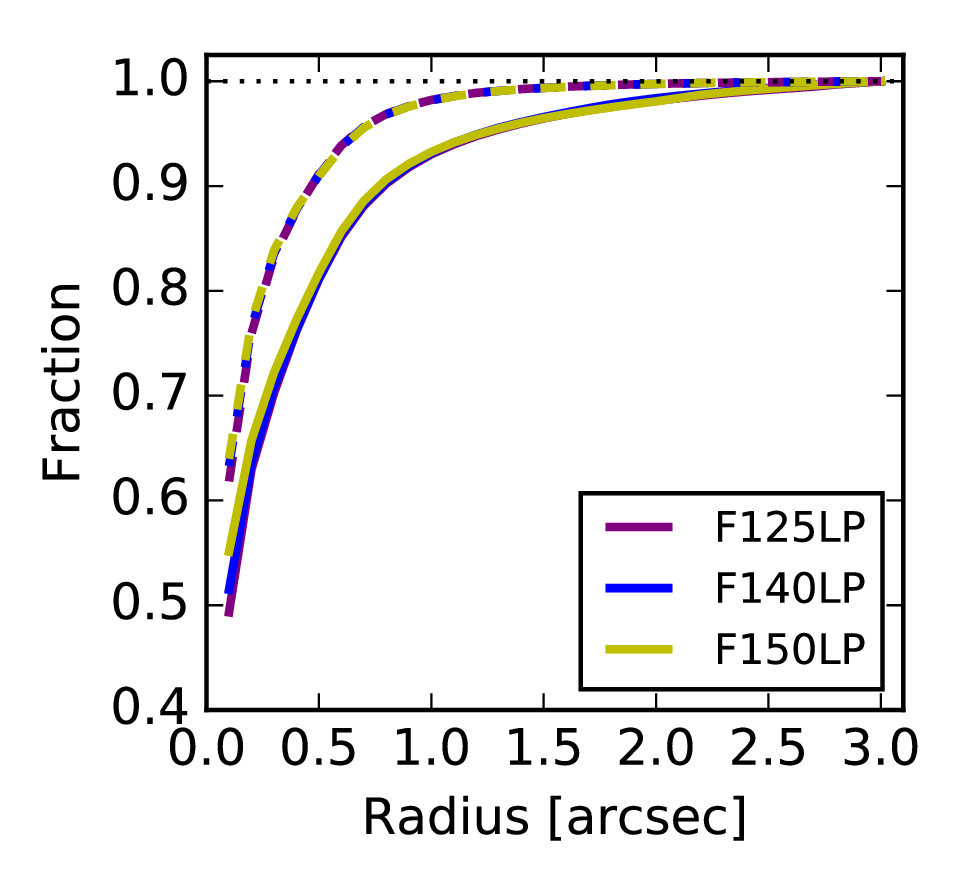
In general, the ACS/WFC encircled energy distribution has been found to be within the original instrument specifications. Figure 5.13 and Figure 5.14 show the ACS encircled energy curves derived from on-orbit images. Interactive encircled energy plots can be found on the ACS Aperture Corrections website.
Due to telescope breathing over short time scales and focus drifts over long time scales, users are encouraged to measure the encircled energy directly from their science images, rather than depending on the tabulated values, where deviations at small radii may be significant. Further details on the encircled energy calibration can be found in Bohlin 2016, AJ, 152, 60, ACS ISR 2020-08, and ACS ISR 2016-05.
5.6.4 Geometric Distortions
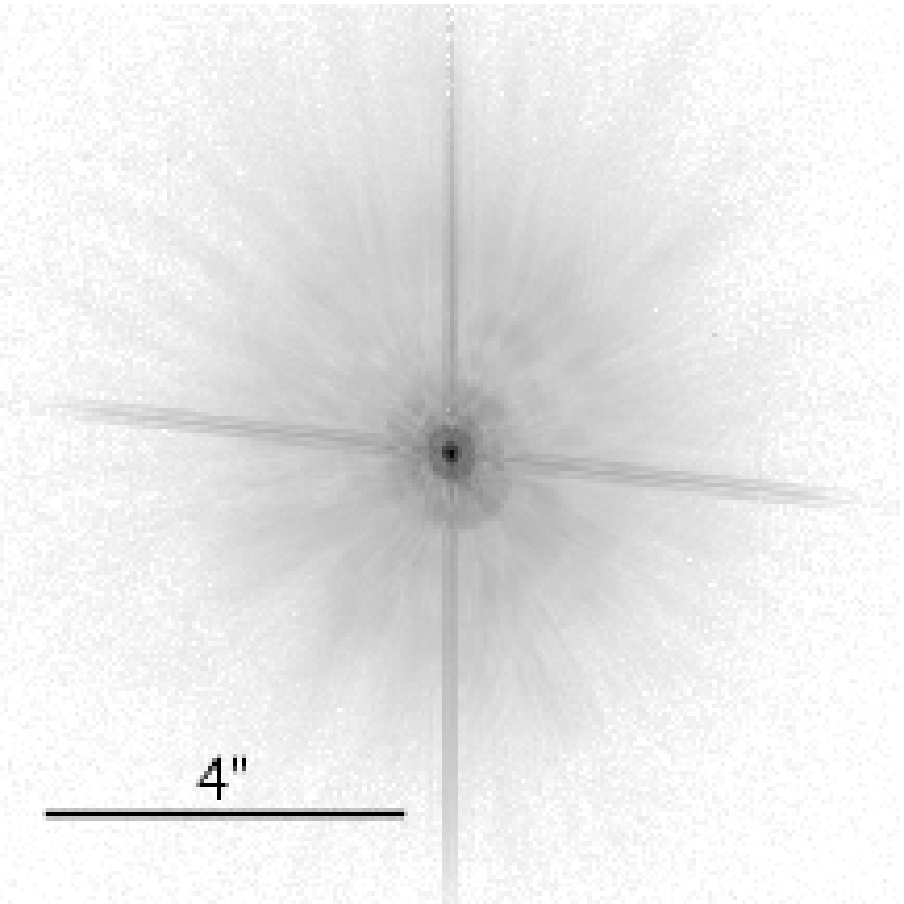
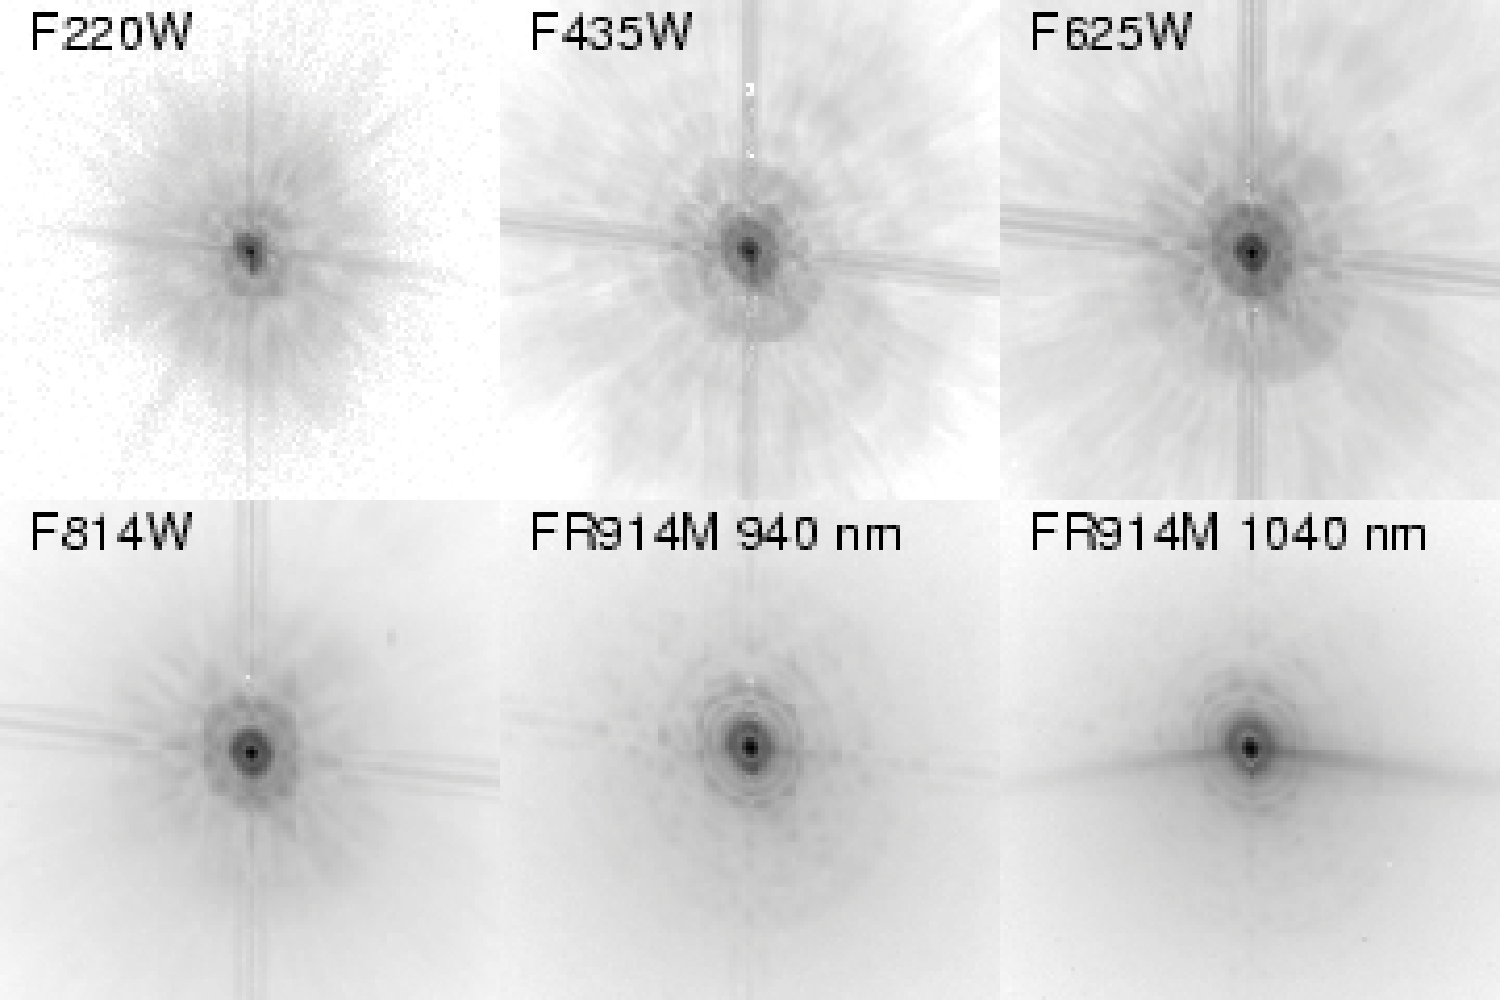
Geometric distortions produce a significant impact on the shape of the PSF in all three of the ACS channels, as can readily be seen in Figure 5.15 and Figure 5.16, which display WFC and HRC PSF images. The logarithmic stretch enhances the spider diffraction patterns, which the distortion renders non-perpendicular, and the outer Airy rings, which appear elliptical. The distortion owes primarily to the tilt of the focal surface to the chief ray at the large OTA field angles of the ACS apertures. The linear, field-independent approximation for the WFC produces a difference in plate scale of about 8% between the two diagonals of the field and, in the HRC and SBC, about a 16.5% difference in scale between orthogonal directions rotated about 20° from the aperture edges. Field-dependent distortions, measured as actual vs. predicted distances from field center, amount to about 2% peak in the WFC and about 1% in the HRC and SBC.
The distortions render the pixels, as projected on the sky, trapezoidal in shape and their area varies over the field by about 19% and 3.5% in the WFC and HRC/SBC, respectively. These variations have significant ramifications concerning appropriate techniques for flat-fielding and photometric calibration, especially when complicated by resampling in order to combine dithered image sets. Related issues are the manner in which the halation effects of the HRC and SBC detectors are removed and the treatment of spectra from the prisms and grism, which are not subject to the same distortion effects.
More details concerning geometric distortions in ACS can be found in Section 10.4. Also see ACS ISR 2002-02, ACS ISR 2004-15, ACS ISR 2007-08, ACS ISR 2008-02, ACS ISR 2015-06, ACS ISR 2018-01, and ACS ISR 2020-09. An introduction to CALACS is available in the ACS Data Handbook and details for running CALACS can be found in the ACS Jupyter Notebooks on the Analysis Tools webpage. Information about AstroDrizzle, which applies corrections for geometric distortion, is available online at the DrizzlePac website.
5.6.5 PSFs at Red Wavelengths and the UV
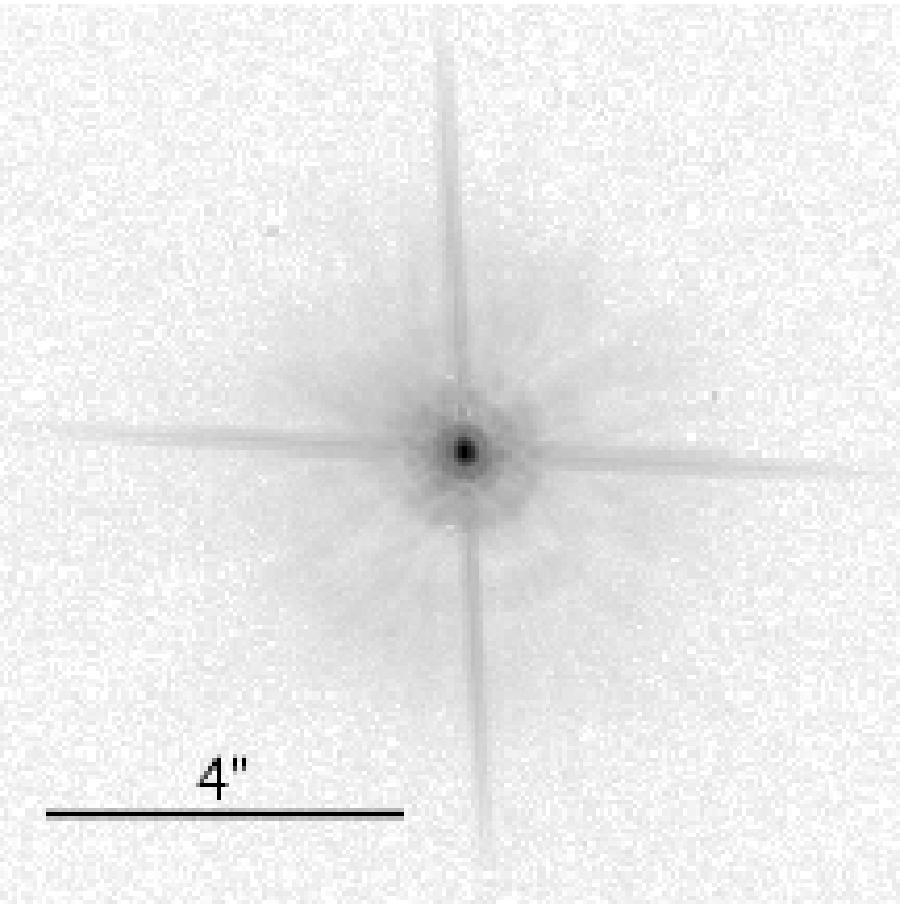
The CCDs used in the HRC and WFC suffer from a halo that is caused by very red photons passing through the device and being scattered back into the detector by the mounting substrate. This creates a large halo in HRC images beyond 7000 Å and WFC images past 9000 Å. At 8000 Å in the HRC, the halo contains about 10% of the light. At 10,000 Å, it contains about 30% and increases the surface brightness of the PSF wings by over an order of magnitude, overwhelming the PSF diffraction rings and spikes. A discussion of this may be found in Gilliland & Riess 2003. In the F850LP filter, in particular, extremely red stars show a progressive loss of flux in small to moderate sized apertures as a function of color. Additional information can be found in Sirianni et al. 2005, PASP, 117, 1049 and Bohlin 2016, AJ, 152, 60. These papers provide a detailed recipe to correct for this effect. This halo effect is only partially treated by the ETC. Observers can use pysynphot or stsynphot (see Section 9.3.2) to accurately calculate the photometry of red sources in the SDSS z-filter.
Long wavelength photons that pass through the CCD can also be scattered by the electrode structure on the back side of the device and will create two spikes that extend roughly parallel to the x-axis. These spikes are seen at wavelengths longer than 9500 Å in both the HRC and WFC (see Figure 5.17 and Figure 5.18).
The encircled energy curves presented in this handbook and incorporated into the ETC include all of the scattering effects discussed here.
5.6.6 Residual Aberrations
Residual aberration levels (RMS wavefront error in units of the wavelength of light) at the center of the field in each camera are 1/30 wave (HRC) and 1/20 wave (WFC) RMS at 5500 Å (excluding defocus). Coma and astigmatism are minimized at the field center of each camera. The ACS PSF varies far less over the field of view than those of WFPC2 and STIS. WFPC2 especially suffered from a variable obscuration pattern that significantly altered the PSF structure depending on field position. Lacking the additional obscurations present in WFPC2, ACS PSF variations are instead due to changes in aberrations, breathing, field distortion, and charge diffusion.
At the extreme corners of the WFC field, increased astigmatism slightly elongates the PSF core. The axis of elongation rotates by 90° if the system passes through focus due to breathing. This may affect ellipticity measurements of small galaxies with bright cores at the field edges. Focus variations in the WFC, which alter the amount of light in the peak, are largely due to detector surface height irregularities and amount to the equivalent of 5 microns of breathing (1/18 wave RMS, ACS ISRs 2007-12 and 2008-03). The largest focus offset is along the gap between the two CCDs. Variations in the width of the PSF core are dominated by changes in CCD charge diffusion, which is dependent on the thickness of the detector (12 to 17 microns for the WFC). The PSF FWHM in F550M, for example, can vary by 20% (0.10 to 0.13 arcseconds) over the field. More information about the dependence of the WFC PSF on OTA temperature and breathing is provided in ACS ISR 2007-12 and ACS ISR 2008-03.
The PSFs in the HRC and SBC are reasonably constant over their fields. The HRC FWHM is 0.060 to 0.073 arcseconds in F550M. More details on ACS PSF field variations are provided in ACS ISR 2003-06. The Tiny Tim PSF simulator includes field dependent aberrations and charge diffusion and may be used to estimate the impact of these variations. For the WFC PSF, the effective PSFs created from empirical data and presented in ACS ISR 2006-01, ACS ISR 2018-08, and ACS ISR 2023-06 also demonstrate field-dependent variability. ACS ISR 2017-08 provides a comparison between Tiny Tim PSFs and effective PSFs from ACS ISR 2006-01.
-
ACS Instrument Handbook
- • Acknowledgments
- • Change Log
- • Chapter 1: Introduction
- Chapter 2: Considerations and Changes After SM4
- Chapter 3: ACS Capabilities, Design and Operations
- Chapter 4: Detector Performance
- Chapter 5: Imaging
- Chapter 6: Polarimetry, Coronagraphy, Prism and Grism Spectroscopy
-
Chapter 7: Observing Techniques
- • 7.1 Designing an ACS Observing Proposal
- • 7.2 SBC Bright Object Protection
- • 7.3 Operating Modes
- • 7.4 Patterns and Dithering
- • 7.5 A Road Map for Optimizing Observations
- • 7.6 CCD Gain Selection
- • 7.7 ACS Apertures
- • 7.8 Specifying Orientation on the Sky
- • 7.9 Parallel Observations
- • 7.10 Pointing Stability for Moving Targets
- Chapter 8: Overheads and Orbit-Time Determination
- Chapter 9: Exposure-Time Calculations
-
Chapter 10: Imaging Reference Material
- • 10.1 Introduction
- • 10.2 Using the Information in this Chapter
-
10.3 Throughputs and Correction Tables
- • WFC F435W
- • WFC F475W
- • WFC F502N
- • WFC F550M
- • WFC F555W
- • WFC F606W
- • WFC F625W
- • WFC F658N
- • WFC F660N
- • WFC F775W
- • WFC F814W
- • WFC F850LP
- • WFC G800L
- • WFC CLEAR
- • HRC F220W
- • HRC F250W
- • HRC F330W
- • HRC F344N
- • HRC F435W
- • HRC F475W
- • HRC F502N
- • HRC F550M
- • HRC F555W
- • HRC F606W
- • HRC F625W
- • HRC F658N
- • HRC F660N
- • HRC F775W
- • HRC F814W
- • HRC F850LP
- • HRC F892N
- • HRC G800L
- • HRC PR200L
- • HRC CLEAR
- • SBC F115LP
- • SBC F122M
- • SBC F125LP
- • SBC F140LP
- • SBC F150LP
- • SBC F165LP
- • SBC PR110L
- • SBC PR130L
- • 10.4 Geometric Distortion in ACS
- • Glossary
