9.5 Extinction Correction
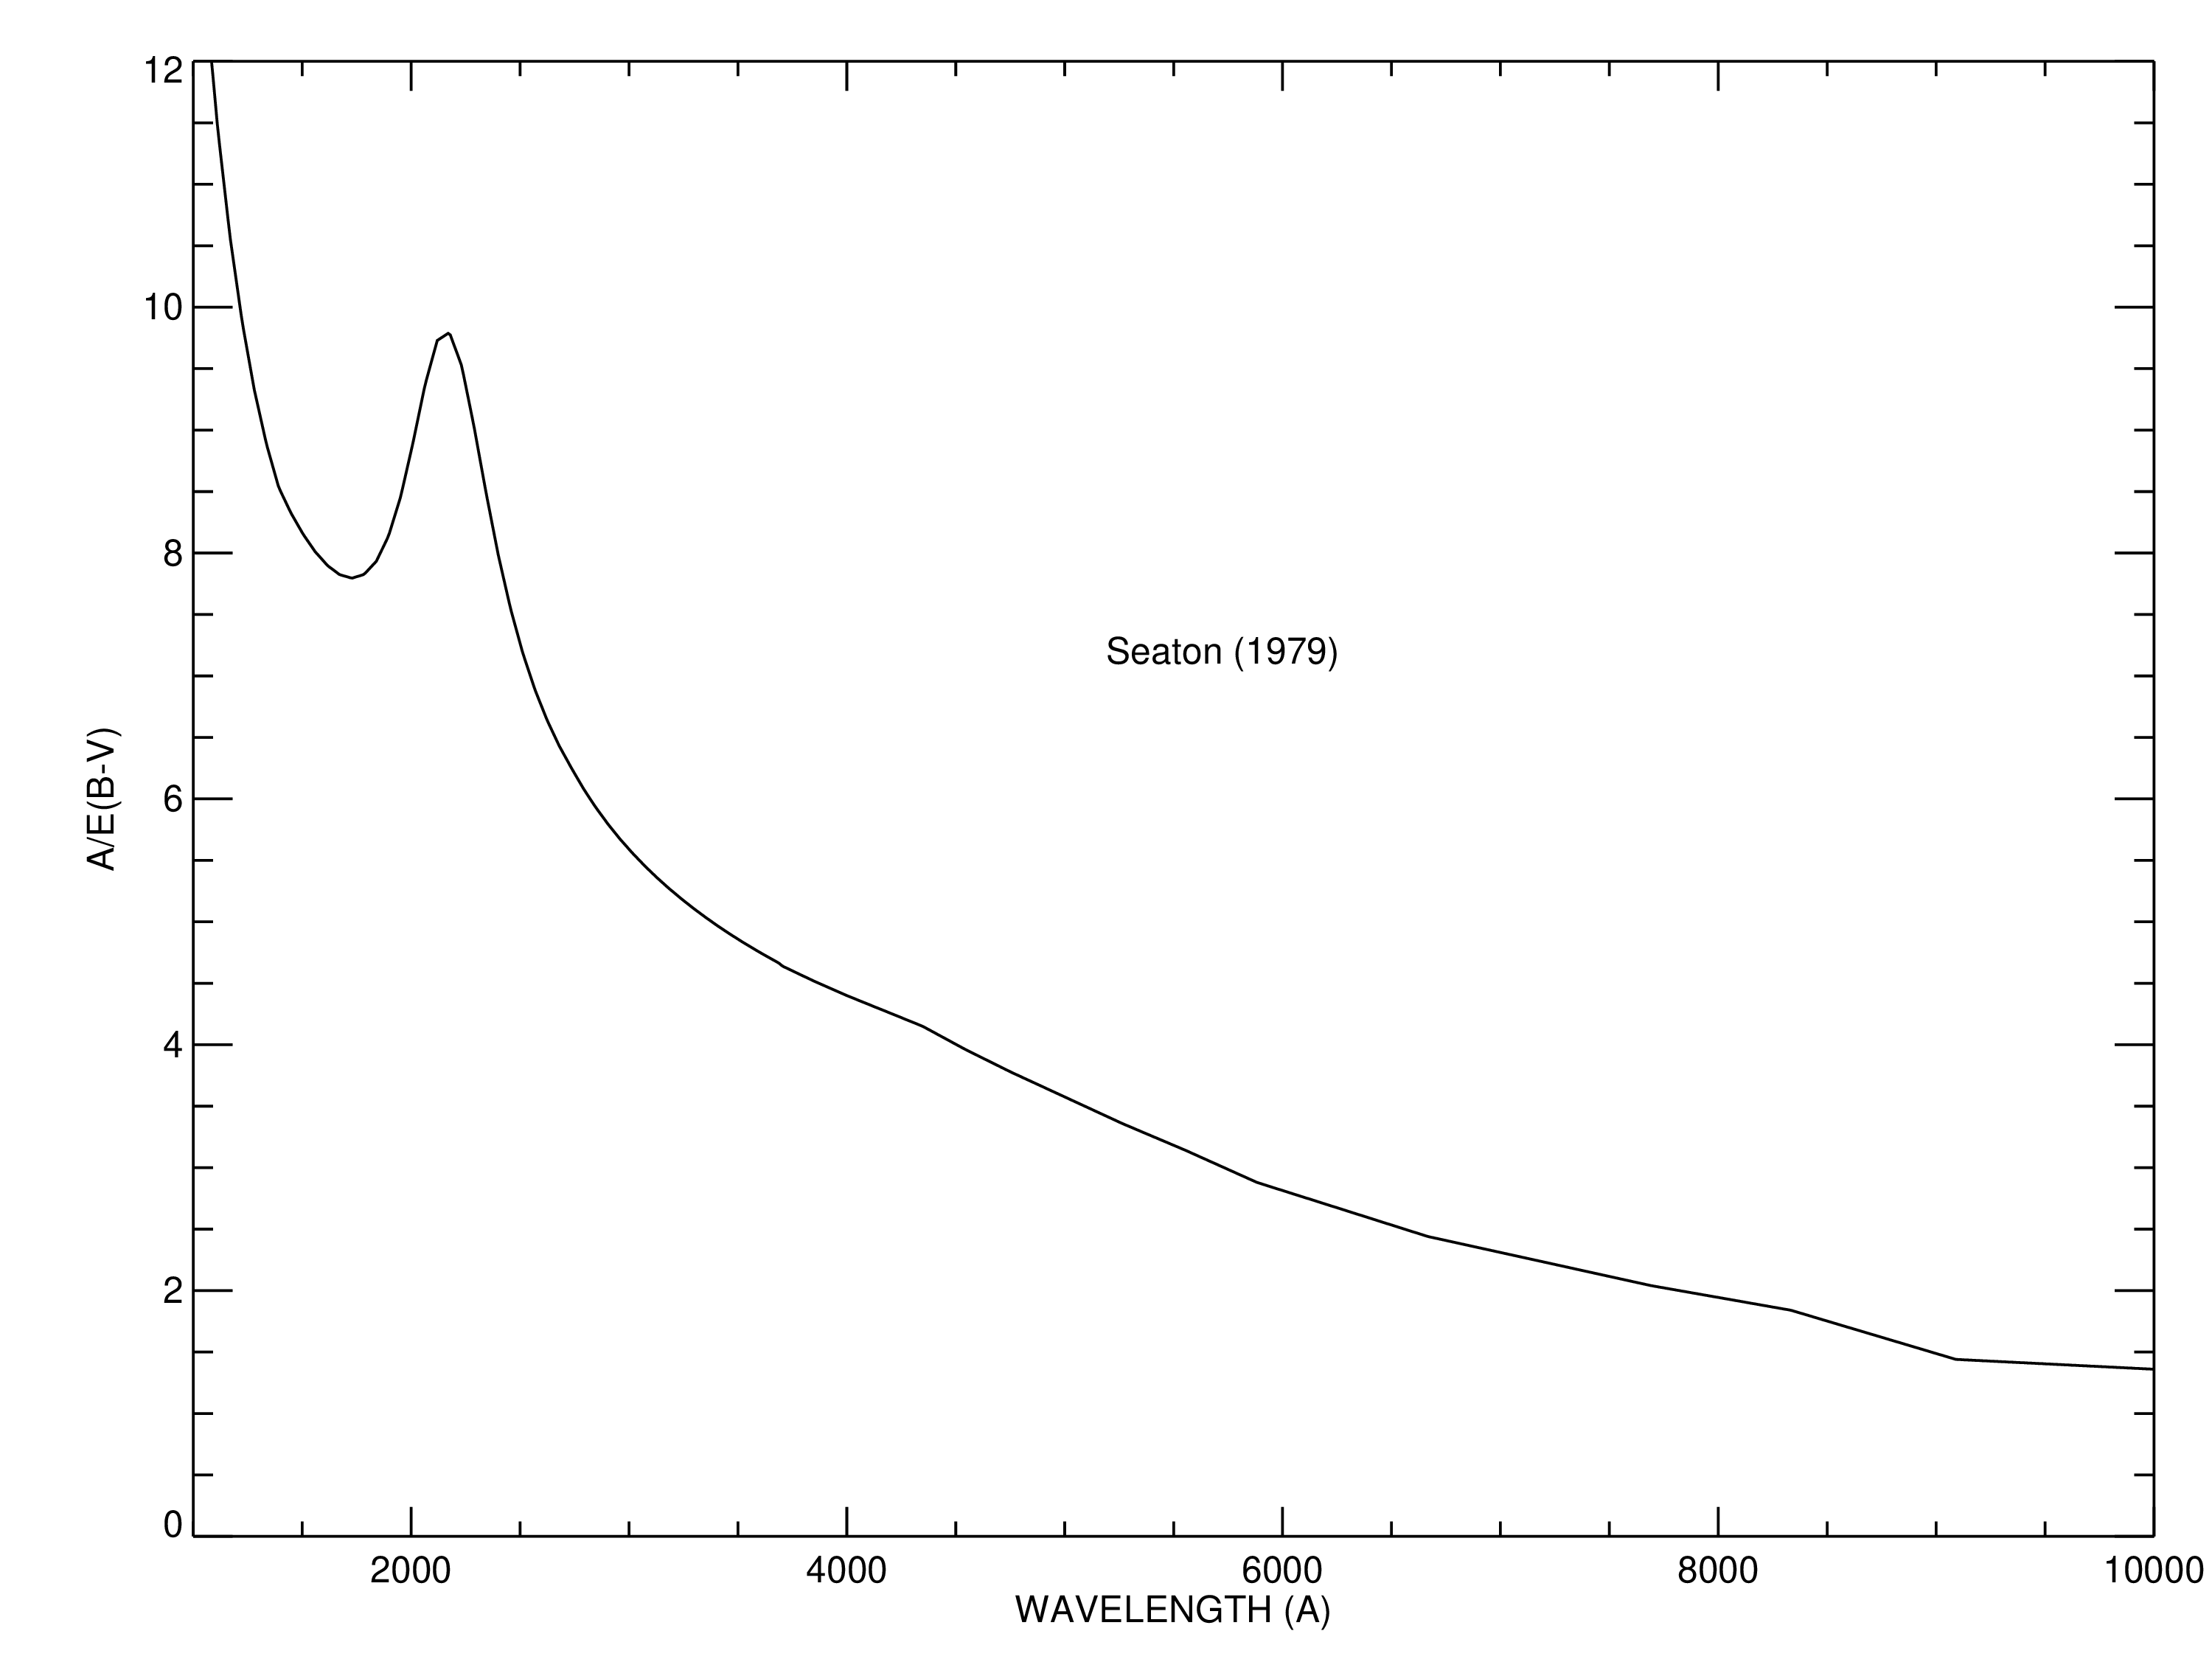
Extinction can dramatically reduce the counts expected from your source, particularly in the ultraviolet. Figure 9.3 shows the average A_V/E(B-V) values for our galaxy, taken from Seaton 1979, MNRAS, 187, 73. Large variations about the average are observed (Witt, Bohlin, & Stecher 1984, ApJ, 279, 698).
Extinction curves have a strong metallicity dependence, particularly in the UV wavelengths. Sample extinction curves can be seen in Koornneef & Code 1981, ApJ, 247, 860 (LMC); Bouchet et al. 1985, A&A, 149, 330 (SMC); and Calzetti, Kinney, & Storchi-Bergmann 1994, ApJ, 429, 582, and references therein. At lower metallicities, the 2200 Å bump, which is so prominent in the Galactic extinction curve, can significantly weaken or disappear; and A_V/E(B-V) may increase monotonically at UV wavelengths.
To take into account the effects of foreground Galactic extinction, the ETC allows users to supply a value of E(B-V) and choose from various extinction curves. Estimates of E(B-V) can be found as a function of sky position from e.g., Shlafly & Finkbeiner (2011).
Figure 9.3: Extinction versus wavelength.
-
ACS Instrument Handbook
- • Acknowledgments
- • Change Log
- • Chapter 1: Introduction
- Chapter 2: Considerations and Changes After SM4
- Chapter 3: ACS Capabilities, Design and Operations
- Chapter 4: Detector Performance
- Chapter 5: Imaging
- Chapter 6: Polarimetry, Coronagraphy, Prism and Grism Spectroscopy
-
Chapter 7: Observing Techniques
- • 7.1 Designing an ACS Observing Proposal
- • 7.2 SBC Bright Object Protection
- • 7.3 Operating Modes
- • 7.4 Patterns and Dithering
- • 7.5 A Road Map for Optimizing Observations
- • 7.6 CCD Gain Selection
- • 7.7 ACS Apertures
- • 7.8 Specifying Orientation on the Sky
- • 7.9 Parallel Observations
- • 7.10 Pointing Stability for Moving Targets
- Chapter 8: Overheads and Orbit-Time Determination
- Chapter 9: Exposure-Time Calculations
-
Chapter 10: Imaging Reference Material
- • 10.1 Introduction
- • 10.2 Using the Information in this Chapter
-
10.3 Throughputs and Correction Tables
- • WFC F435W
- • WFC F475W
- • WFC F502N
- • WFC F550M
- • WFC F555W
- • WFC F606W
- • WFC F625W
- • WFC F658N
- • WFC F660N
- • WFC F775W
- • WFC F814W
- • WFC F850LP
- • WFC G800L
- • WFC CLEAR
- • HRC F220W
- • HRC F250W
- • HRC F330W
- • HRC F344N
- • HRC F435W
- • HRC F475W
- • HRC F502N
- • HRC F550M
- • HRC F555W
- • HRC F606W
- • HRC F625W
- • HRC F658N
- • HRC F660N
- • HRC F775W
- • HRC F814W
- • HRC F850LP
- • HRC F892N
- • HRC G800L
- • HRC PR200L
- • HRC CLEAR
- • SBC F115LP
- • SBC F122M
- • SBC F125LP
- • SBC F140LP
- • SBC F150LP
- • SBC F165LP
- • SBC PR110L
- • SBC PR130L
- • 10.4 Geometric Distortion in ACS
- • Glossary
