4.2 The CCDs
HRC has been unavailable since January 2007. Information about the HRC is provided for archival purposes. Please check for updates regarding WFC on the ACS website.
WFC is offered as shared risk in Cycle 33 and may receive minimal calibration. See the ACS website, Call for Proposals, and OPCR webpage for the latest status.
4.2.1 Detector Properties
WFC Properties
The WFC detector consists of two 4096 × 2048 charge-coupled devices (CCDs) that are sensitive from the blue edge of the visual spectrum to the near-IR, called WFC1 and WFC2. These CCDs are thinned, backside-illuminated devices manufactured by Scientific Imaging Technologies (SITe), and are butted together to create an effective 4096 × 4096 pixel2 (202 × 202 arcsec2) array with a gap corresponding to approximately 50 pixels (2.5 arcsec) between the chips. The CCD camera design incorporates a warm dewar window, designed to prevent buildup of contaminants on the window that cause a loss of UV throughput. A summary of the ACS CCD performance is given in Table 3.1.
HRC
The HRC detector is a 1024 × 1024 pixel2 (29 × 26 arcsec2) CCD. It is a thinned, backside-illuminated device, manufactured by SITe. The coating uses a process developed by SITe to provide good quantum efficiency in the near-ultraviolet. The performance characteristics and specifications are given in Table 3.1.
4.2.2 CCD Spectral Response
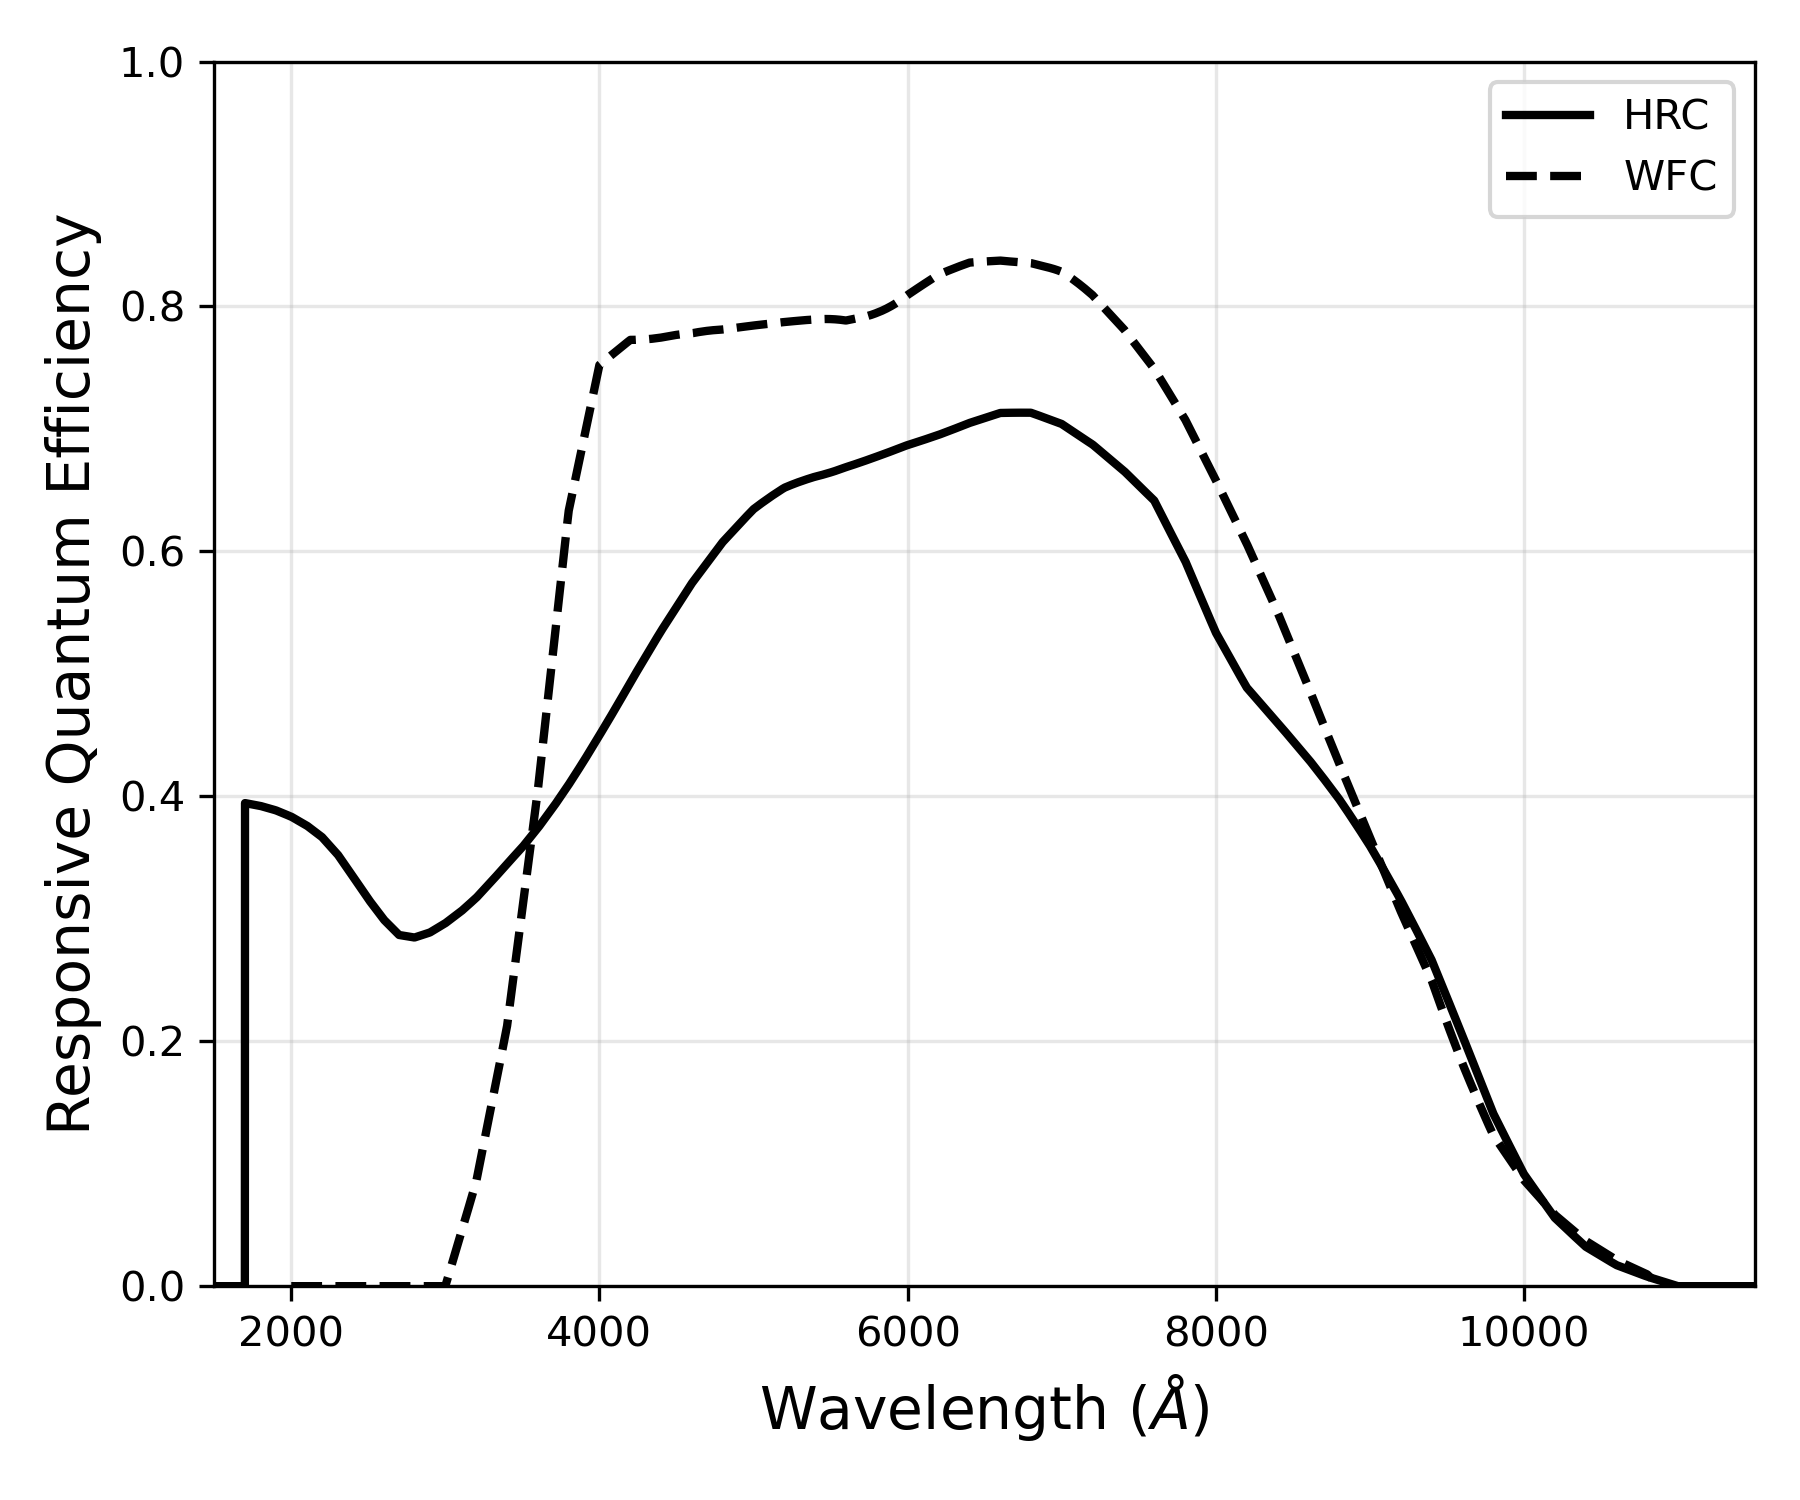
The responsive quantum efficiency (RQE) of the WFC and HRC CCDs is shown in Figure 4.1; the RQE includes corrections needed to reproduce the instrument sensitivity measured on orbit (Bohlin 2016, AJ, 152, 60, ACS ISR 2020-08). The total spectral response of the camera (see Figure 5.7) is given by the product of the RQEs shown here and the throughput of optical elements of the camera and telescope. For example, the WFC silver coated mirrors enhance the reflectivity in the near-IR but impose a cutoff below 370 nm.
Figure 4.1: Responsive quantum efficiency of the HRC CCD (solid line) and WFC CCDs (dashed line).
4.2.3 Quantum Efficiency Hysteresis
Based on current data, the ACS CCDs do not suffer from quantum efficiency hysteresis (QEH). The CCDs respond in the same way to light levels over their whole dynamic range, irrespective of the previous illumination level.
4.2.4 CCD Long-Wavelength Fringing
Like most thinned CCDs, the ACS CCDs exhibit fringing longward of ~7500 Å. The fringing is caused by interference of incident light reflected between the front and back surfaces of the CCD. The amplitude of the fringes is a strong function of wavelength and spectral bandpass. Only the F892N filter shows a fringe pattern for white light illumination. The fringe pattern is stable and can be removed to first order for continuum sources by the F892N flat field.
4.2.5 CCD Readout Format
WFC
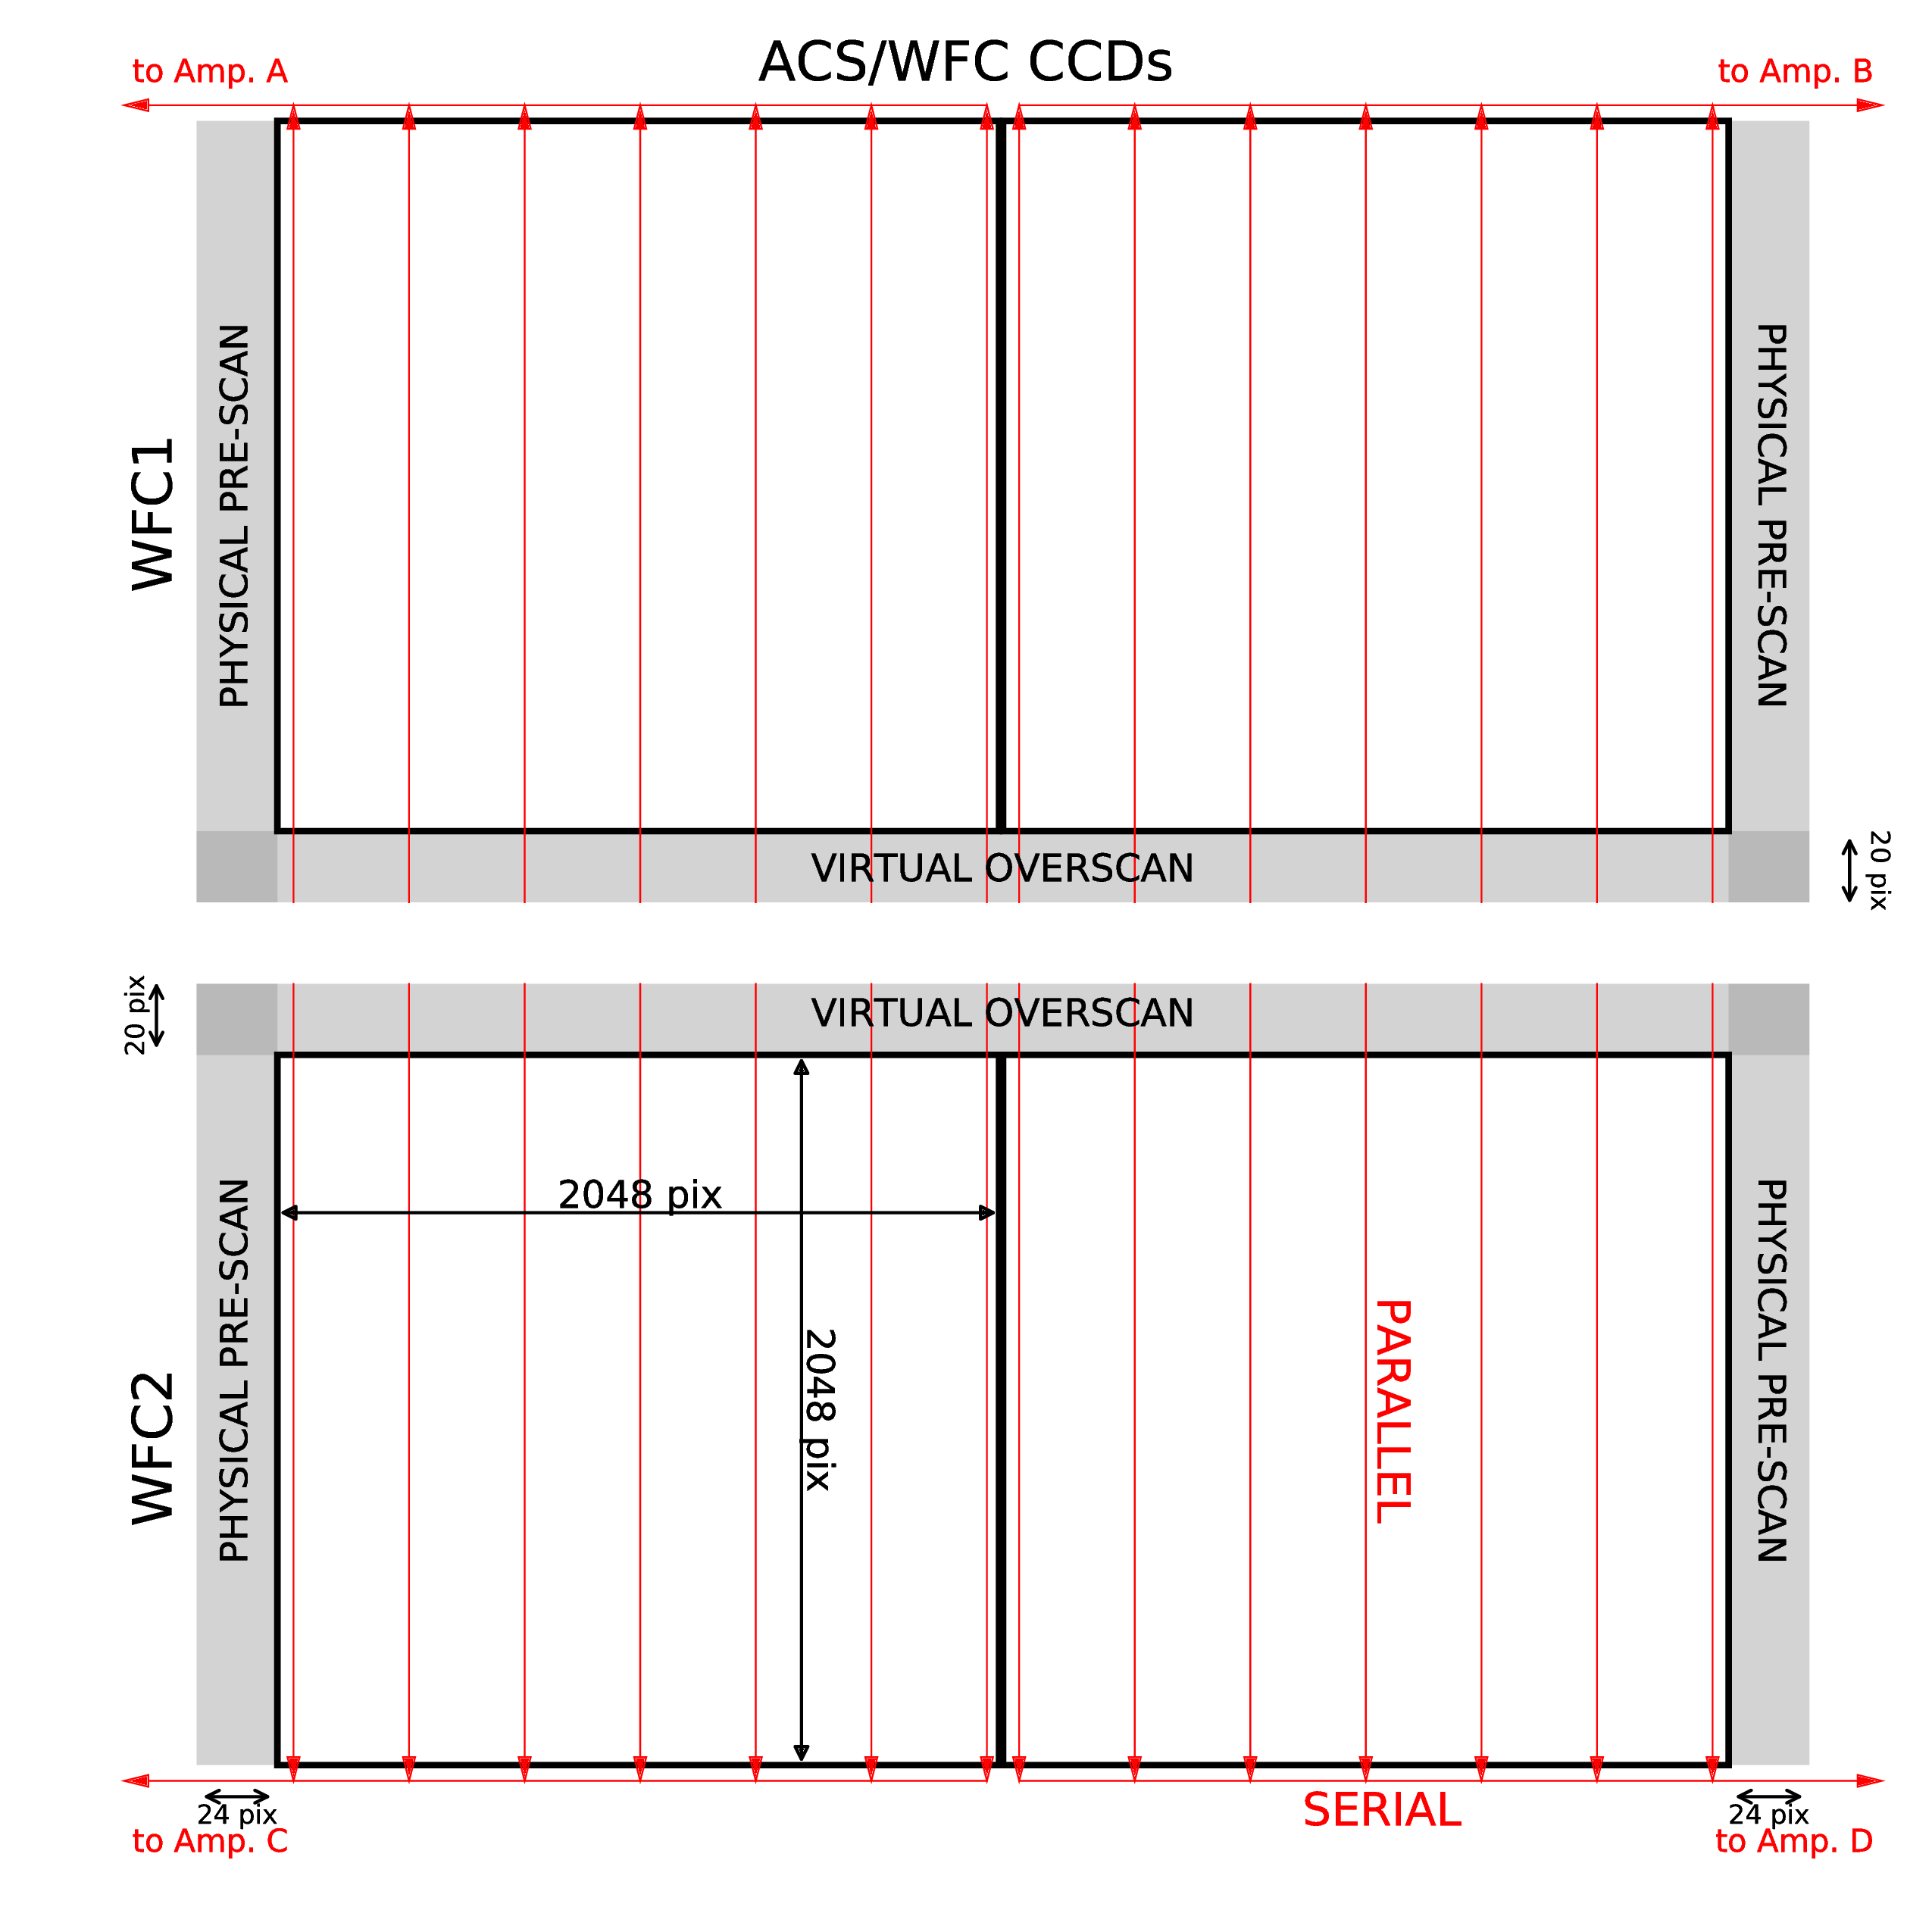
Each WFC CCD is read out as a 4144 × 2068 pixel2 array, including physical prescans and virtual overscans. Two amplifiers are used to read out each CCD. The serial register of each chip contains 24 additional, physical pixels at either end, which generate the physical prescans. The final images of each CCD consist of 24 columns of physical prescan, 4096 columns of pixel data, and another 24 columns of physical prescan. Each column consists of 2048 rows of pixel data followed by 20 rows of virtual overscan, which is achieved by reading out the serial register an additional 20 times. The orientation of the CCD is such that for the grism spectra, the dispersed images have wavelength increasing from left to right in the positive x-direction. A schematic of the WFC CCDs, including readout directions, prescans, and overscans, is provided in Figure 4.2.
HRC
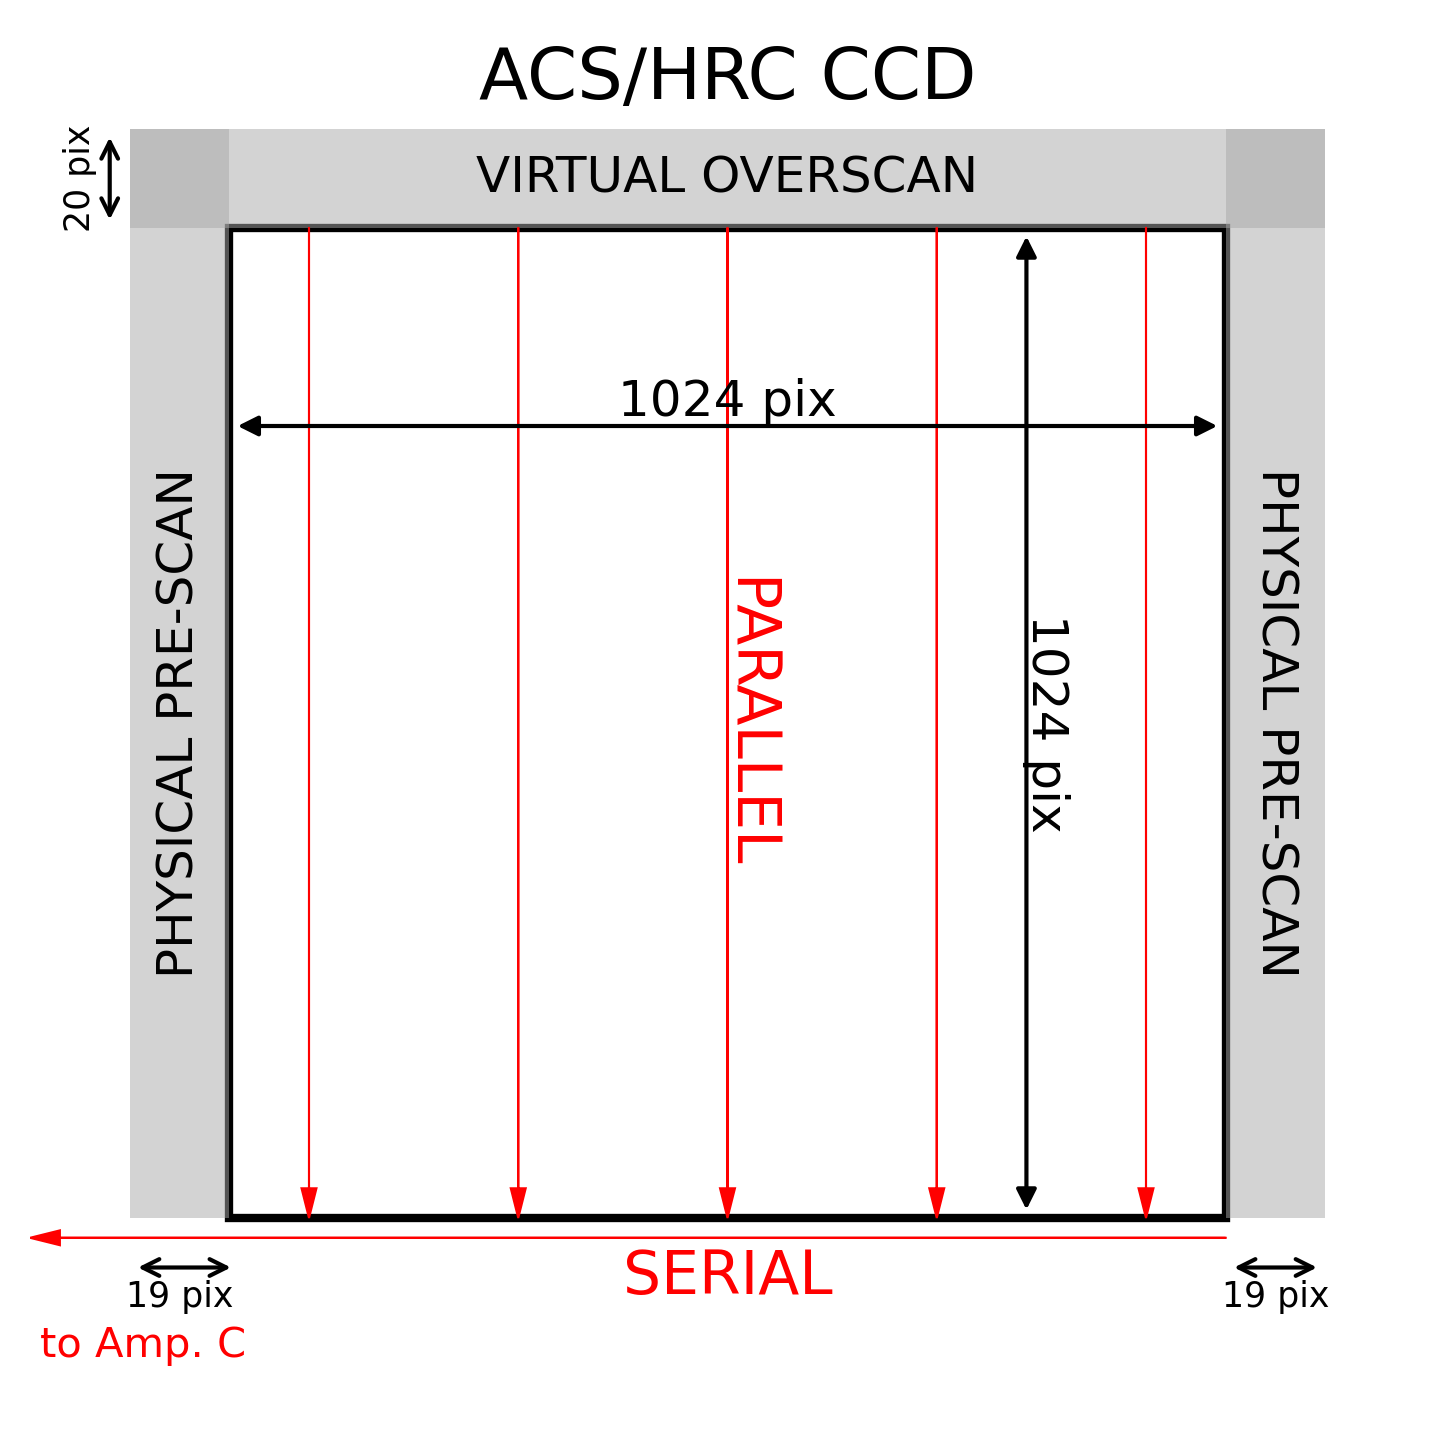
The HRC CCD was read out as a 1062 × 1044 pixel2 array, including physical and virtual overscans. There are 19 columns of physical prescan, followed by 1024 columns of pixel data, and then 19 more columns of physical prescan. Each column consists of 1024 rows of pixel data followed by 20 rows of virtual overscan. As with the WFC, the orientation of the HRC CCD was chosen so that grism images have wavelength increasing from left to right. A schematic of the HRC CCD, including prescans and overscans, is provided in Figure 4.3.
4.2.6 Analog-To-Digital Conversion
Electrons that accumulate in the CCD pixels are read out and converted to data numbers (DN) by the analog-to-digital converter (ADC). The ADC output is a 16 bit number, producing a maximum of 65,535 DN in one pixel. Before the failure of ACS in January 2007, the WFC and HRC CCDs could be operated at ADC gains of 1, 2, 4, or 8 electrons/DN. The current CCD Electronics Box (CEB-R) installed during SM4 changed the WFC's ADC operational gains to 0.5, 1.0, 1.4, and 2.0 electrons/DN. In addition, the post-SM4 A-to-D saturation limit appears to be somewhat less than 65,535 DN per pixel (ACS ISR 2020-03). Almost all gain 2.0 observations will not approach this limit, therefore the impact to most observers is negligible. Furthermore, reference files have been updated to reflect a new lower limit of 64,000 DN for A-to-D saturation, and data quality flags are appropriately marked by CALACS.
All four new gains are available to the observer but only the GAIN = 2.0 option is fully supported by the ACS Team since May 2010. Although lower ADC gains can in principle increase the dynamic range of faint source observations by reducing quantization noise, the improvement is not significant for the WFC. To mitigate undesirable features in ACS data (e.g., cross-talk), the ACS Team strongly recommends observers use only the GAIN = 2.0 setting.
Table 4.1 shows the gain and read noise values of the four WFC amplifiers measured during the orbital verification period after SM4 for each commanded gain available with the dual-slope integrator pixel sampling mode of the CEB-R. The read noise values apply to the imaging (light-sensitive) regions of the CCD quadrants and are about 0.1 electrons higher than the measured values in the corresponding prescan regions.
For archival purposes, Table 4.2 and Table 4.3 show the gain and read noise values of the four WFC amplifiers and the default HRC amplifier C when operated with Side 1 (March 2002 to June 2006) and Side 2 (June 2006 to January 2007) of the original CEB.
Table 4.1: WFC amplifier gain and read noise after installation of the CEB-R (valid after May 2009). Values apply to dual-slope integrator mode of pixel sampling.
CCD | Amp | Gain (e–/DN) | Read Noise (e–) | ||||||
0.5 | 1.0 | 1.4 | 2.0[a] | 0.5 | 1.0 | 1.4 | |||
WFC1 | A | 0.53 | 1.03 | 1.45 | 2.020 | 3.92 | 4.05 | 4.28 | 4.35 |
WFC1 | B | 0.50 | 0.96 | 1.36 | 1.886 | 3.24 | 3.36 | 3.61 | 3.75 |
WFC2 | C | 0.53 | 1.03 | 1.45 | 2.017 | 3.54 | 3.69 | 3.95 | 4.05 |
WFC2 | D | 0.53 | 1.02 | 1.45 | 2.011 | 3.31 [c] | 3.43 [c] | 3.71 [c] | 5.65 [d] |
aDefault gain.
bThe 1σ scatter in the read noise is 0.01–0.02 electrons.
c May not be valid after July 24, 2020.
d Valid after July 24, 2020.
Table 4.2: CCD gain and read noise operated under Side 1 of original CEB (March 2002 to June 2006).
CCD | Amp | Gain (e–/DN) | Read noise (e–) | ||||
1 | 2 [a] | 4 | 1 | 2 [a] | 4 | ||
WFC1 | A | 1.000 | 2.002 | 4.01 | 5.57 | 5.84 | -- |
WFC1 | B | 0.972 | 1.945 | 3.90 | 4.70 | 4.98 | -- |
WFC2 | C | 1.011 | 2.028 | 4.07 | 5.18 | 5.35 | -- |
WFC2 | D | 1.018 | 1.994 | 4.00 | 4.80 | 5.27 | -- |
HRC | C | 1.163 | 2.216 | 4.235 | 4.46 | 4.80 | 5.86 |
aDefault gain.
Table 4.3: CCD gain and read noise operated under Side 2 of original CEB (June 2006 to January 2007).
CCD | Amp | Gain (e–/DN) | Read noise (e–) | ||||
1 | 2 [a] | 4 | 1 | 2 [a] | 4 | ||
WFC1 | A | 1.000 | 2.002 | 4.01 | 5.29 | 5.62 | -- |
WFC1 | B | 0.972 | 1.945 | 3.90 | 4.45 | 4.74 | -- |
WFC2 | C | 1.011 | 2.028 | 4.07 | 5.03 | 5.34 | -- |
WFC2 | D | 1.018 | 1.994 | 4.00 | 4.55 | 4.89 | -- |
HRC | C | 1.163 | 2.216 | 4.235 | 4.36 | 4.82 | 5.44 |
aDefault gain.
4.2.7 Flat Fields
WFC
The WFC flat-field reference images are constructed from both ground-based and on-orbit data. Ground-based flats with signal-to-noise ratios of ~300 per pixel were obtained for all filters. Low-frequency refinements of the ground-based flats were made using in-flight dithered observations of a rich star field (see ACS ISRs 2002-08 and 2003-10).
These low-frequency flats (L-flats) initially showed a corner-to-corner sensitivity gradient across the CCDs of 10–18%, depending on wavelength. The L-flats were updated in July 2006 after the operating temperature of the WFC was lowered to -81 °C (see ACS ISR 2006-06). The resulting flat fields are accurate to 1% over the WFC field of view for most broad-band filters and to 2% for F850LP and the narrow-band filters. Observations of a rich star field obtained shortly after the ACS repair in May 2009 and subsequent years have been used to verify that the L-flats remain stable (ACS ISR 2020-01).Internal observations made during SMOV SM4 show that the P-flats (high frequency pixel-to-pixel flats) are also stable (ACS ISR 2011-04).
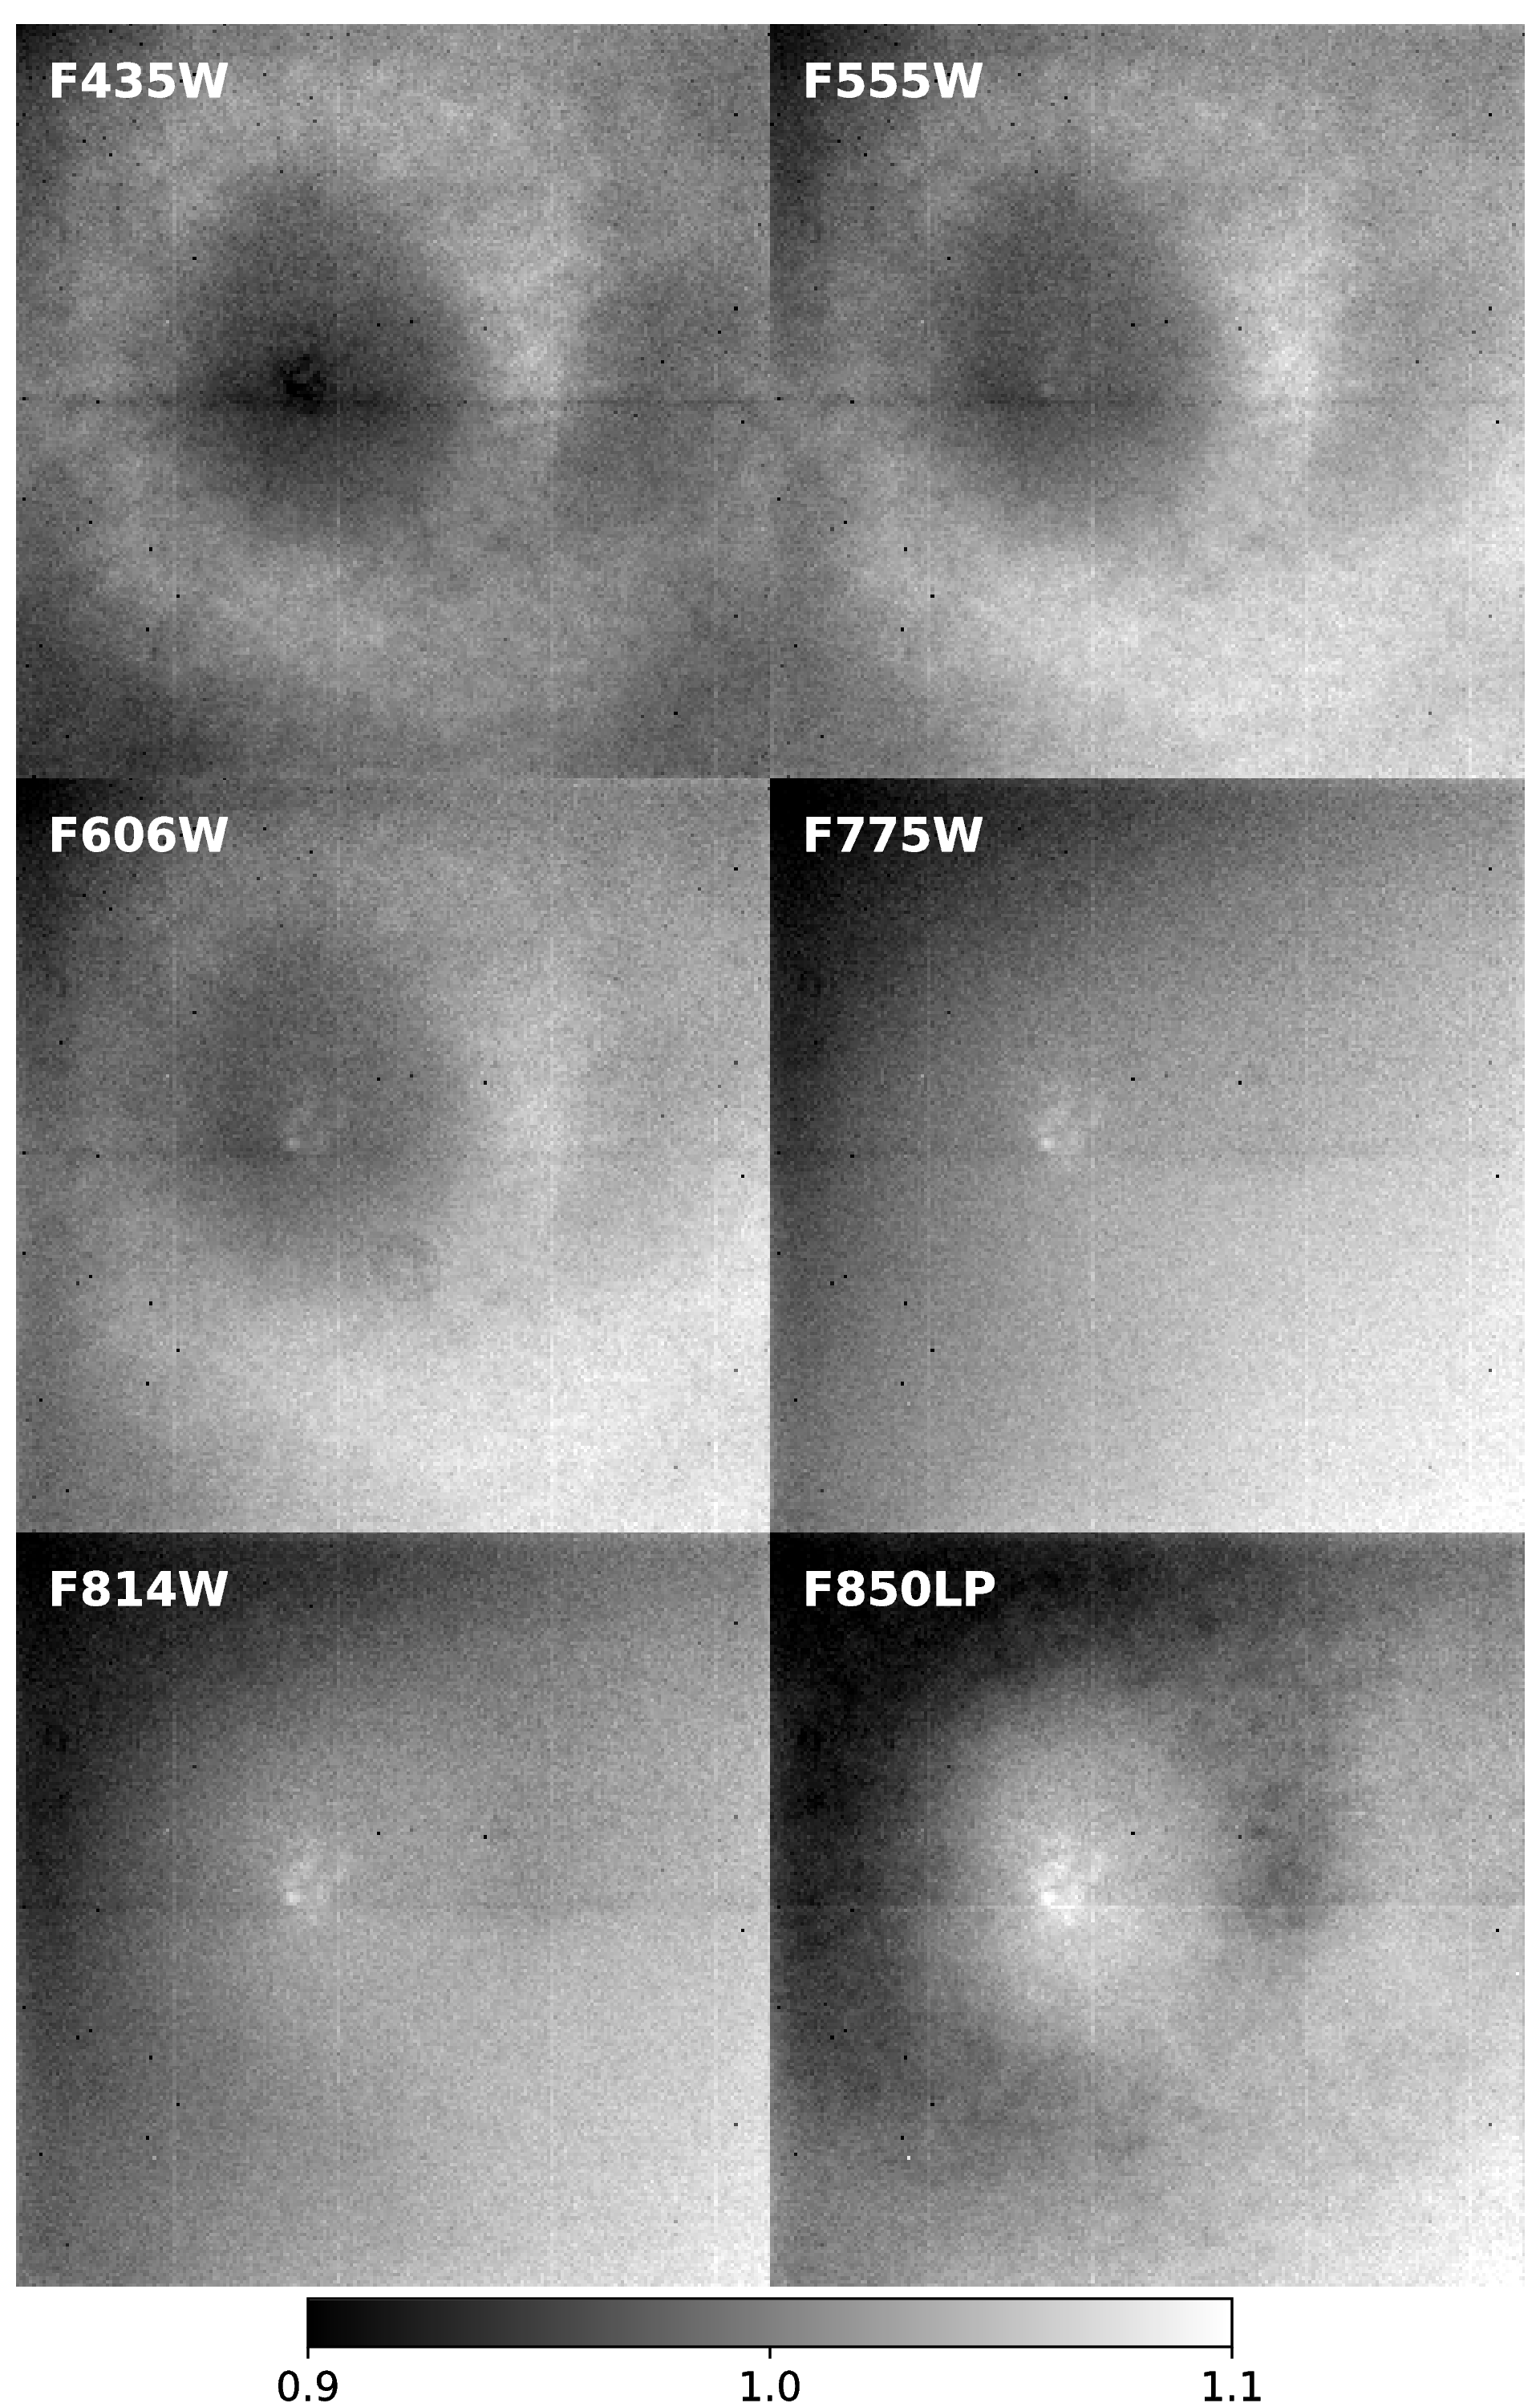
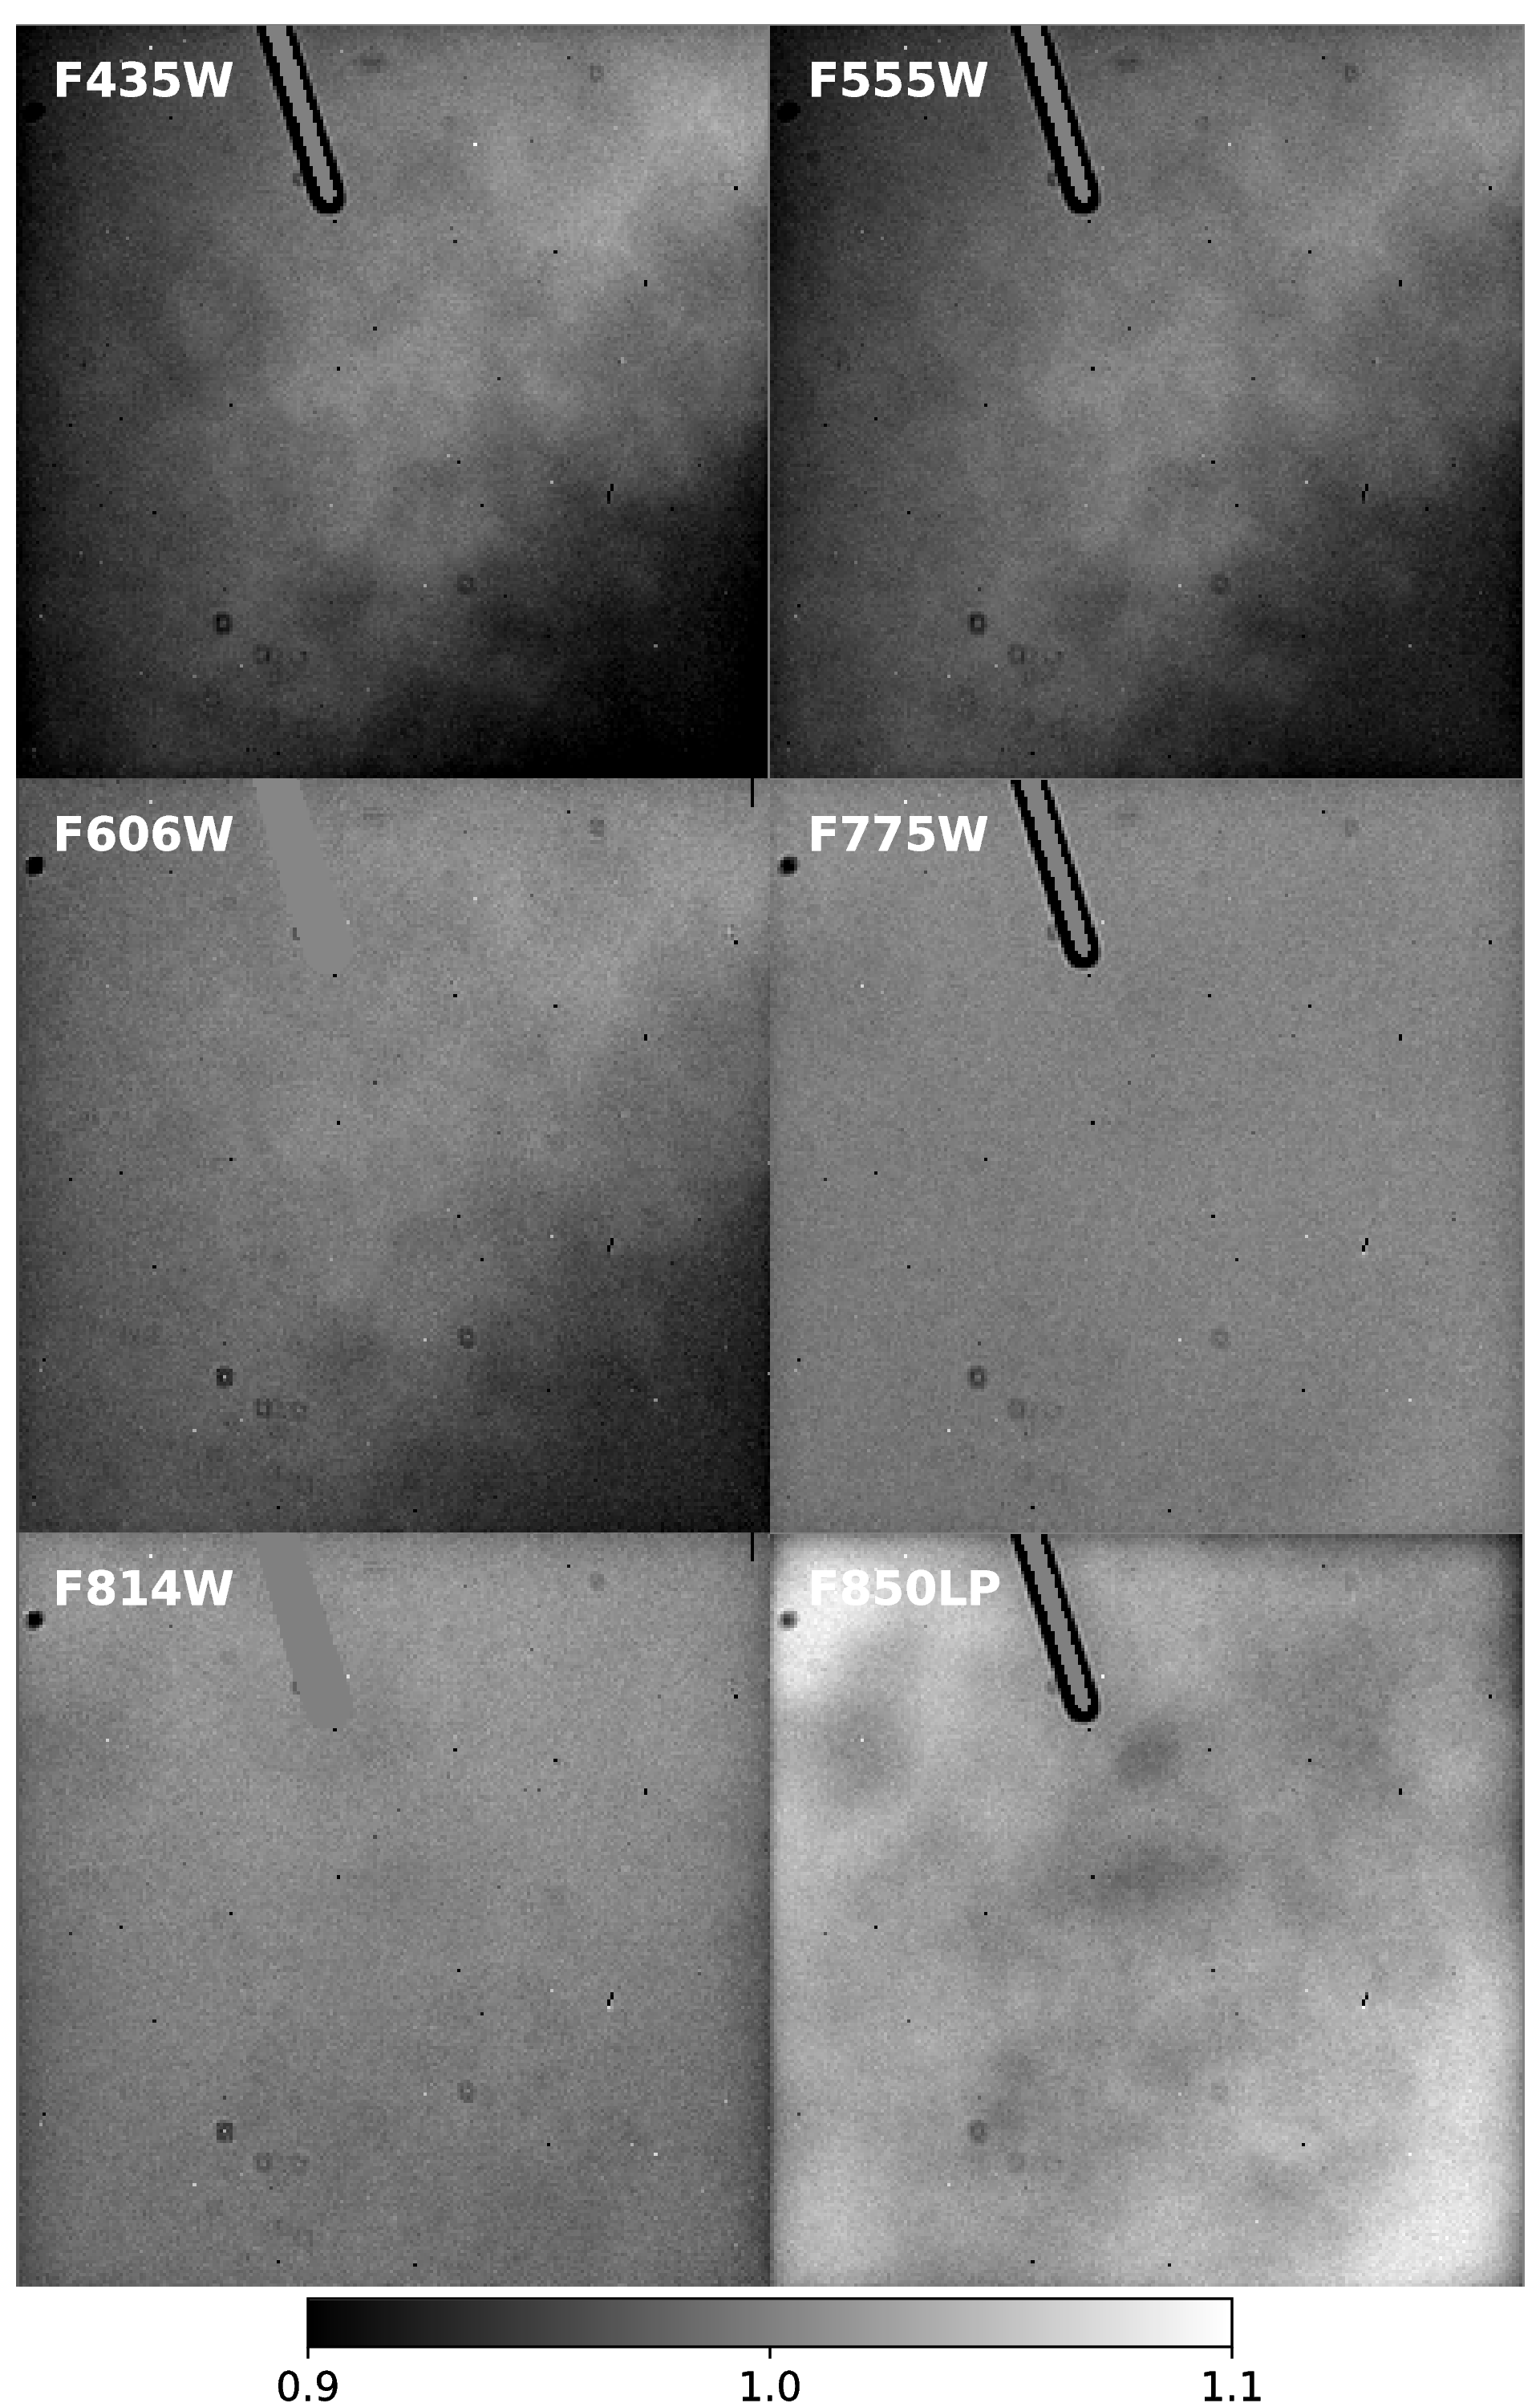
Figure 4.4 shows the corrected WFC ground flats for several broadband filters. The 50 pixel gap between the top and bottom CCDs is not shown. Because the two CCDs were cut from the same silicon wafer and underwent similar processing, their sensitivities are continuous across the gap. The central doughnut-like structure is wavelength dependent. The pixels in the central region are less sensitive than surrounding pixels in the blue F435W flat, but they are more sensitive in the red F850LP flat.
There are a few types of artifacts present in WFC flat-field images. Dust motes are the shadows of dust particles located on the CCD windows. Dust motes consist of a characteristic dark ring approximately 30 pixels across. Flat-field correction mitigates their effects to <<1%. "Freckles" appear as small black dots a few pixels across. They are sparsely distributed in WFC images and stable over the history of the instrument. More information about freckles and dust motes can be found in ACS ISR 2001-11.
In May 2017, three new artifacts (dubbed "flecks") appeared in WFC calibration data. Two of the flecks are larger in size than the freckles, spanning 10–20 pixels. A careful analysis reveals that the flecks are particulates that have fallen onto the surface of the CCD, implying they originated inside the CCD housing. While this narrows down the potential sources of the particulates, the exact source could not be identified. For each fleck, pixels with less than 50% transmissivity have been listed in an updated bad pixel table (BPIXTAB) for use with data taken after May 5th, 2017. This information propagates to the data quality (DQ) extension of science data and allows the pixels affected by flecks to be identified (DQ flag 4) and appropriately processed during image drizzling. For more details, please refer to ACS ISR 2018-03.
See ACS ISRs 2001-11, 2002-01, 2002-04, 2002-08, 2003-10, 2003-11, 2005-02, 2005-09, 2006-06, 2007-01, 2015-07, and 2020-01 for more information about the WFC flat fields.
HRC
The HRC ground flats were refined using in-flight dithered observations of a rich star field designed to track low-frequency sensitivity variations. These L-flats revealed a corner-to-corner sensitivity gradient across the CCD of 6-12%, depending on wavelength. NUV flats were constructed from in-flight images of the bright Earth (see ACS ISR 2003-02) and include both the pixel-to-pixel and low-frequency structure of the detector response.
The HRC flat fields have a signal-to-noise of ~300 per pixel and support photometry to ~1% over the full HRC field of view. Figure 4.5 shows the corrected HRC ground flats derived for six broadband optical filters. The doughnut-like structure in the WFC flats is not seen in the HRC flats. For further discussion of HRC flat fields, see ACS ISRs 2001-11 and 2002-04.
-
ACS Instrument Handbook
- • Acknowledgments
- • Change Log
- • Chapter 1: Introduction
- Chapter 2: Considerations and Changes After SM4
- Chapter 3: ACS Capabilities, Design and Operations
- Chapter 4: Detector Performance
- Chapter 5: Imaging
- Chapter 6: Polarimetry, Coronagraphy, Prism and Grism Spectroscopy
-
Chapter 7: Observing Techniques
- • 7.1 Designing an ACS Observing Proposal
- • 7.2 SBC Bright Object Protection
- • 7.3 Operating Modes
- • 7.4 Patterns and Dithering
- • 7.5 A Road Map for Optimizing Observations
- • 7.6 CCD Gain Selection
- • 7.7 ACS Apertures
- • 7.8 Specifying Orientation on the Sky
- • 7.9 Parallel Observations
- • 7.10 Pointing Stability for Moving Targets
- Chapter 8: Overheads and Orbit-Time Determination
- Chapter 9: Exposure-Time Calculations
-
Chapter 10: Imaging Reference Material
- • 10.1 Introduction
- • 10.2 Using the Information in this Chapter
-
10.3 Throughputs and Correction Tables
- • WFC F435W
- • WFC F475W
- • WFC F502N
- • WFC F550M
- • WFC F555W
- • WFC F606W
- • WFC F625W
- • WFC F658N
- • WFC F660N
- • WFC F775W
- • WFC F814W
- • WFC F850LP
- • WFC G800L
- • WFC CLEAR
- • HRC F220W
- • HRC F250W
- • HRC F330W
- • HRC F344N
- • HRC F435W
- • HRC F475W
- • HRC F502N
- • HRC F550M
- • HRC F555W
- • HRC F606W
- • HRC F625W
- • HRC F658N
- • HRC F660N
- • HRC F775W
- • HRC F814W
- • HRC F850LP
- • HRC F892N
- • HRC G800L
- • HRC PR200L
- • HRC CLEAR
- • SBC F115LP
- • SBC F122M
- • SBC F125LP
- • SBC F140LP
- • SBC F150LP
- • SBC F165LP
- • SBC PR110L
- • SBC PR130L
- • 10.4 Geometric Distortion in ACS
- • Glossary
