10.2 IR Scanned Data
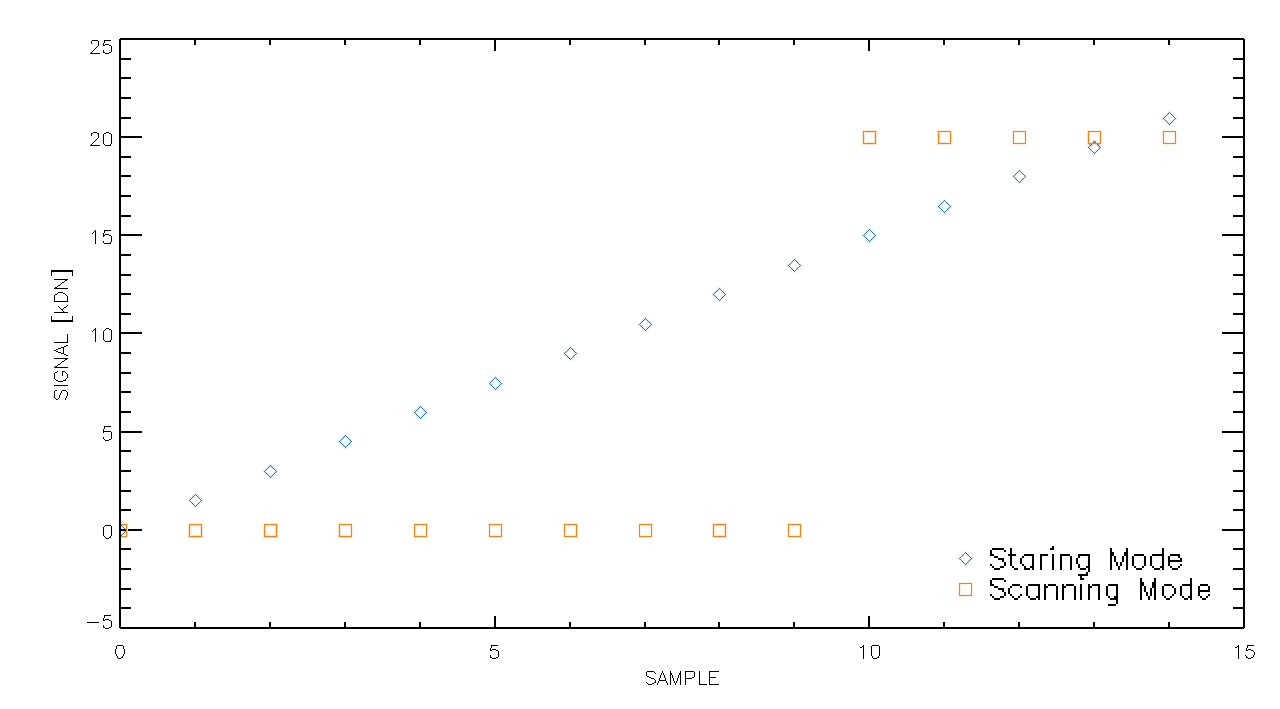
The nominal calibration and cosmic-ray cleaning of IR observations by calwf3 produces _flt.fits files containing average count rate information for each pixel. The count rate is derived by fitting a straight line to the up-the-ramp slope of accumulating charge within a pixel. This method, however, is inappropriate for spatially scanned data where the charge accumulation in any given pixel crossed by a source occurs within a very short period of time and thus appears as a step rather than a ramp (see Figure 10.1).
UNITCORR and FLATCORR switches, the ima file will report the average count (or electron) rate up to a given read or the total accumulated counts (or electrons) up to that read. Given that WFC3/IR sampling sequences may have unevenly spaced readouts, converting from one to the other requires using the values of the readout timings (recorded in the ima image as either the PIXVALUE keyword of the TIME extension of each imset, or as the SAMPTIME keyword of the SCI extension of the same imset). This conversion also requires manually calculating differences of the Nth readout and the (N-1)th readout to form a set of difference images which can be subsequently analyzed with custom procedures. For the SPARS sample sequences specifically, the time interval between the 0th readout and the 1st readout is much shorter than the intervals between subsequent readouts; hence for SPARS data, the first interval can be discarded in subsequent analysis if desired for consistency. For example, with a GRISM512 subarray and SPARS10 readout, the first interval is 0.85 seconds, whereas subsequent intervals are 7.92 seconds (see WFC3 ISR 2006-06 or Phase II Proposal Instructions). Please note that, depending on the usage, specialized treatment of data and/or customization of analysis techniques may be required (e.g., see Riess et al 2018a, Riess at al 2018b).Starting with calwf3 version 3.3 in early 2016, the _flt.fits files for scanned data are constructed without the up-the-ramp fit by setting CRCORR to OMIT. The result is a calibrated science data file (flt.fits) consisting of the first-minus-last science extension from the ima file (where the individual reads are stored in reverse time order), a more reasonable representation of the image than the up-the-ramp fit. Observers with calibrated scan data predating 2016 may re-retrieve their files from the MAST archive to obtain the improved flt.fits files. Since CRCORR is set to OMIT, these calibrated files may contain cosmic rays requiring removal via traditional routines e.g., stacking of dithered images, Laplacian cosmic ray identification (e.g., L.A.Cosmic; van Dokkum 2001), and Astrodrizzle.
We note that meta data related to spatial scans can be found in the _spt.fits files; please see Table 10.1 for an example block of keywords associated with spatial scans. Additionally, with calwf3 version 3.3 and later, all the UVIS and IR scan-related keywords formerly accessible only via the engineering file headers (_spt.fits), are now also present in the calibrated science data headers (e.g., _flt.fits).
Table 10.1: Spatial Scan Keywords in the _flt.fits files
Keywords | Description |
|---|---|
SCAN_TYP= 'C’ | C:bostrophidon; D:C with dwell; N:N/A |
SCAN_WID=0.000000000000E+00 | scan width (arcsec) |
ANG_SIDE=9.000000000000E+01 | angle between sides of parallelogram (deg) |
DWELL_LN=0 | dwell pts/line for scan pointing (1-99,0 if NA) |
DWELL_TM=0.000000000000E+00 | wait time (duration) at each dwell point (sec) |
SCAN_ANG=2.248278045654E+02 | position angle of scan line (deg) |
SCAN_RAT=5.000000074506E-02 | commanded rate of the line scan (arcsec/sec) |
NO_LINES= 1 | number of lines per scan (1-99,0 if NA) |
SCAN_LEN=2.969249963760E+00 | scan length (arcsec) |
SCAN_COR='V' | scan coordinate frame of ref: celestial,vehicle |
10.2.1 IR Scanned Spectra
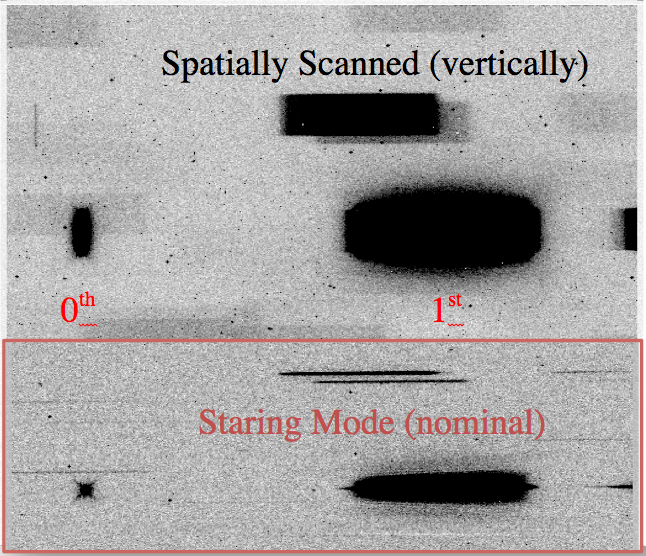
MAST provides the user with calibrated images taken in scanned mode. However the analysis of spatially scanned WFC3/IR spectroscopy (see Figure 10.2 for an example) involves ad-hoc post-processing steps that are left to the users. Some guidelines for the analysis of spatially-scanned IR spectroscopy can be found in WFC3 ISR 2012-08, WFC3 ISR 2019-12 & WFC3 ISR 2019-13. Additionally, papers exist in the literature that illustrate custom data reduction procedures for the analysis of scanned data, e.g. Zieba & Kreidberg (2022) and references therein for exoplanet transits observed with spatial scanning. The WFC3 team does not endorse any specific paper; the interested reader should search the literature for such examples and use their own judgement in adopting the reduction strategy best suited for their purposes.
As a final note, observers should be aware that spatially scanned spectra have been found to exhibit sensitivity losses of ~0.06-0.12%/year (WFC3 ISR 2024-01).
10.2.2 IR Scanned Photometry
An example workflow to do photometry using IR scanned observations can be found in WFC3 ISR 2021-05. This work uses total counts from the calibrated MULTIACCUM ima files as input and performs aperture photometry of stellar scans to study time-dependent sensitivity of the IR channel. However, as mentioned before, the details of the workflow depend on the usage of the data and several examples of customized analysis techniques can be found in the literature. Furthermore, the IR scanned photometry exhibits similar repeatability issues as seen in the staring mode described in Section 7.11.
As is the case for scanned spectra, observers should be aware that sensitivity losses for spatially scanned IR photometry have been shown to be ~0.06-0.16%/year (WFC3 ISR 2024-01).
-
WFC3 Data Handbook
- • Acknowledgments
- • What's New in This Revision
- Preface
- Chapter 1: WFC3 Instruments
- Chapter 2: WFC3 Data Structure
- Chapter 3: WFC3 Data Calibration
- Chapter 4: WFC3 Images: Distortion Correction and AstroDrizzle
- Chapter 5: WFC3 UVIS Sources of Error
- Chapter 6: WFC3 UVIS Charge Transfer Efficiency - CTE
-
Chapter 7: WFC3 IR Sources of Error
- • 7.1 WFC3 IR Error Source Overview
- • 7.2 Gain
- • 7.3 WFC3 IR Bias Correction
- • 7.4 WFC3 Dark Current and Banding
- • 7.5 Blobs
- • 7.6 Detector Nonlinearity Issues
- • 7.7 Count Rate Non-Linearity
- • 7.8 IR Flat Fields
- • 7.9 Pixel Defects and Bad Imaging Regions
- • 7.10 Time-Variable Background
- • 7.11 IR Photometry Errors
- • 7.12 References
- Chapter 8: Persistence in WFC3 IR
- Chapter 9: WFC3 Data Analysis
- Chapter 10: WFC3 Spatial Scan Data

