4.1 WFC3 Geometric Distortion
WFC3 images exhibit significant geometric distortion, similar to that seen in ACS images. The required folding of the light paths in both channels to fit them within the instrument's optical-bench envelope results in substantial tilts of the focal surfaces with respect to the chief rays. The WFC3 UVIS detector is tilted at ~21 degrees producing a rhomboidal elongation of ~7%. The IR detector has a ~24 degree tilt about its x-axis, creating a rectangular elongation of ~10%. The orientations of the WFC3 detector edges for both detectors are at approximately 45 degrees with respect to the V2 and V3 coordinate axes of the telescope. Figure 2.2 of the WFC3 Instrument Handbook shows the WFC3 apertures in the telescope's V2, V3 reference frame.
The first on-orbit measurements of the geometric distortion for the WFC3 detectors were made in 2009 during SMOV (Servicing Mission Observatory Verification). The standard astrometric fields in the vicinity of globular cluster 47 Tuc (NGC 104) and the Large Magellanic Cloud (LMC) were observed with multiple offsets (proposal 11444 for UVIS with F606W and 11445 for IR with F160W). The derived WFC3 geometric distortion is computed as a fourth-order polynomial model and is accurate to a precision level of better than 0.05 pixel in both UVIS and IR or about 2 and 5 mas, respectively (WFC3 ISR 2009-33 and WFC3 ISR 2009-34).
In Cycles 17-21 (2009-2014) the globular cluster Omega Centauri was observed through all UVIS filters and five IR filters. These observations were used to derive the high-order geometric distortion coefficients as a function of filter (Table B.1) on both channels. The unique polynomial coefficients of the geometric distortion are stored in the Instrument Distortion Coefficient Tables (IDCTABs) that are used to correct for distortion in MAST drizzled data products. The name of the IDC table used during calibration is stored in the primary header keyword IDCTAB in the WFC3 science image header. These reference files are also necessary for users who wish to reprocess their data with the DrizzlePac/AstroDrizzle software.
For the UVIS CCDs, in addition to large-scale geometric distortion, there is a micro-distortion in the form of fine-scale systematics in the residuals from the best-fit polynomial solutions. These systematic residuals typically extend ~0.15 pixel and vary in amplitude depending on the location within a CCD chip. Such residuals cannot be removed by a polynomial model. These fine-scale and low-amplitude distortions are the result of the photo-lithographic mask pattern used during the chip manufacture which imprints a large 6x2 grid onto each chip. The correction for the lithographic pattern imprint is implemented in DrizzlePac/AstroDrizzle as a 2-D bi-linear interpolation (D2IMFILE, Detector to Image distortion correction reference file) which is applied prior to the large-scale distortion (polynomial model) correction (IDCTAB) (WFC3 ISR 2013-14). The look-up table is accessed by AstroDrizzle in the pipeline using the filename specified in the D2IMFILE keyword in the primary image header. AstroDrizzle attaches new fits extensions to the calibrated image of type 'D2IMARR' (four extensions total, two for each chip in each X and Y axis). See Table 2.5 for details on these additional image header extensions.
In addition to the pixel-grid irregularities there are fine-scale non-polynomial filter-dependent distortions that have been calibrated for a subset of 36 UVIS filters (WFC3 ISR 2014-12 and WFC3 ISR 2018-10). These filter-dependent distortion solution tables are specified in the NPOLFILE keyword in the primary image header and attached to the image as FITS extensions (four extensions, two for each CCD chip and each X and Y axis), WFC3 ISR 2014-12. Each element of the 64 × 32 table is bi-linearly interpolated pixel-by-pixel in UVIS images by AstroDrizzle.
4.1.1 The UVIS Channel
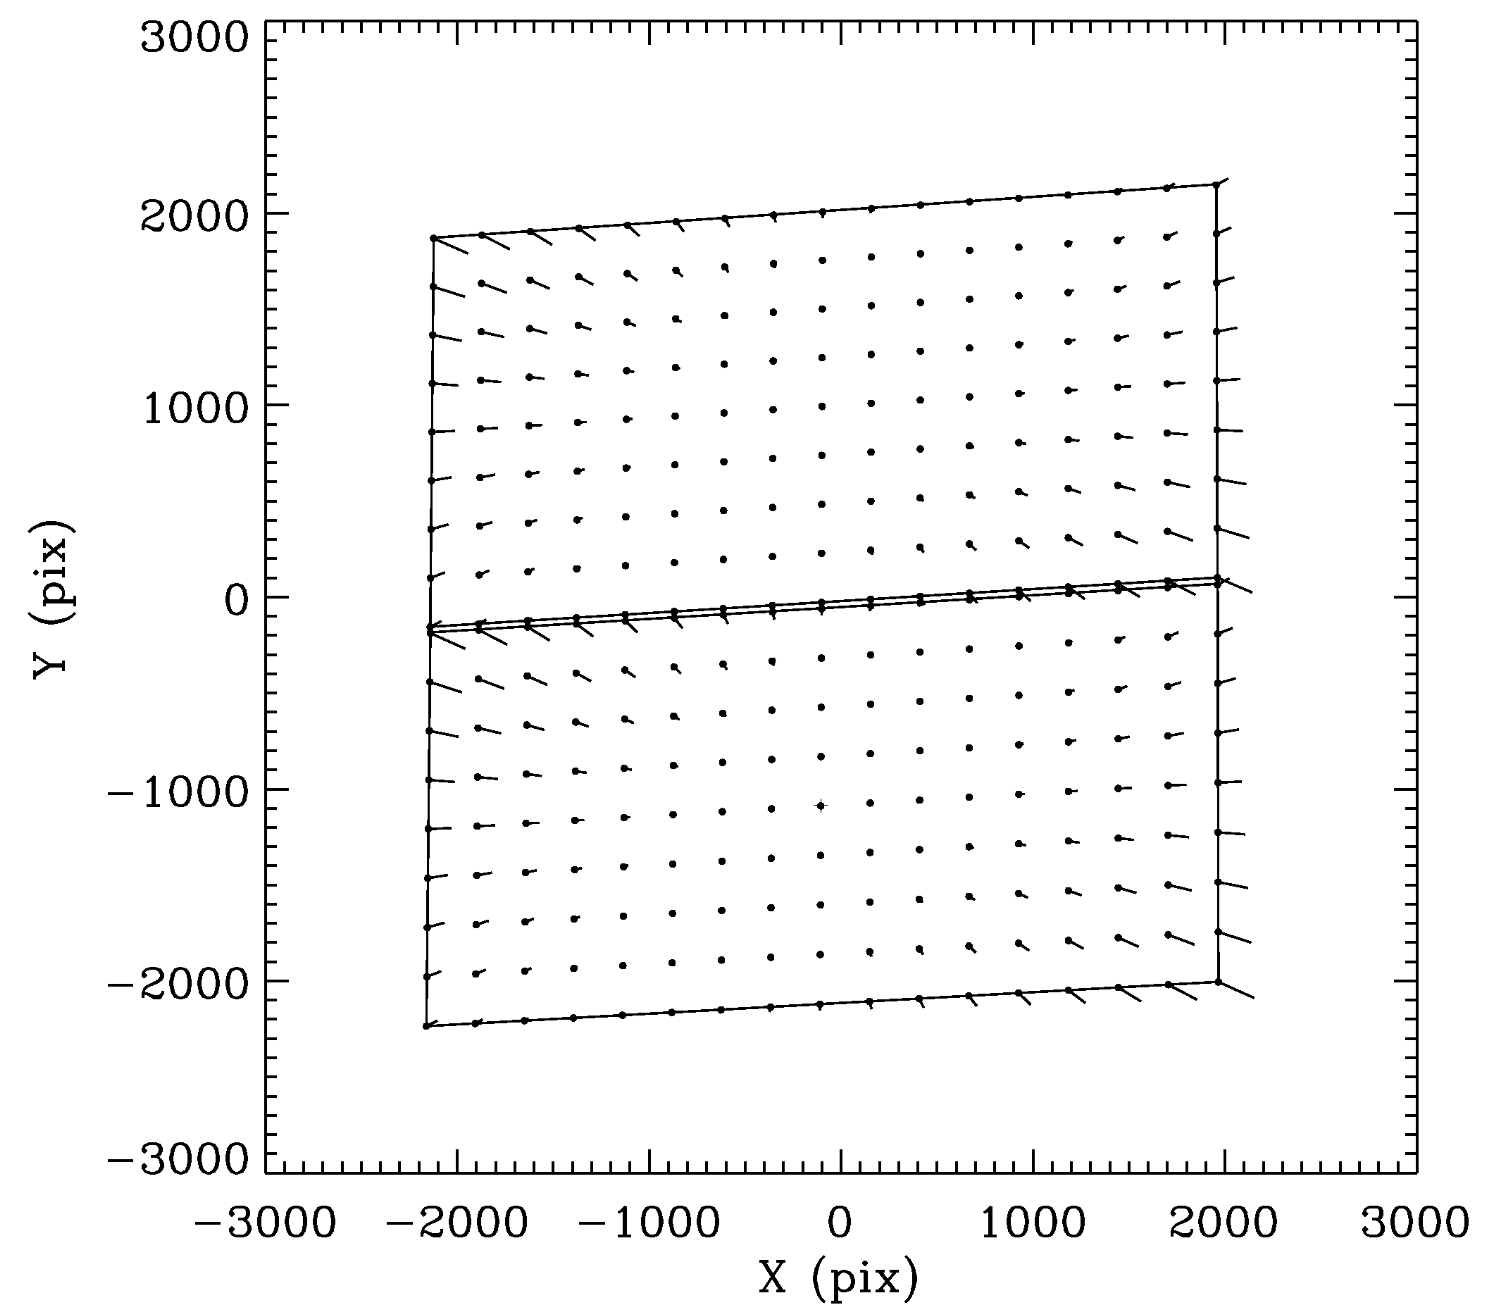
Figure 4.1 illustrates the shape of the UVIS channel field of view as projected onto the sky. As noted above, its rhomboidal shape is due primarily to the tilt of the CCD around its detector diagonal with respect to the chief ray. The angle between the x- and y-axes is ~86.1 degrees. The field diagonals are tilted slightly from the V2- and V3-axes (see Figure 1.2). By design, there is a ~1.2" gap between the two CCD chips. The dots in the diagram indicate where points in the image would be located without non-linear distortion, and the vectors, scaled up by a factor of 10, indicate the actual locations of the points on the sky, including the non-linear distortion components. The corner displacements are about 140 pixels, corresponding to 5.5". The principal effect is the diagonal variation of scale. At the center of UVIS1 (CCD CHIP1, top), the scale in the x-direction is 0.0396"/pixel, and 0.0393"/pixel in the y-direction. For UVIS2 (CCD CHIP2, bottom), these scales are 0.0398''/pixel, and 0.0398"/pixel, respectively. UVIS1 forms a slightly distorted rectangle 162"×81" in size, while UVIS2 subtends 163"×82". In the presence of distortion, it is not possible to flat field the image in such a way as to preserve both surface brightness and flux. The convention that has been adopted in the pipeline preserves surface brightness, therefore a pixel area map correction is necessary if the goal is to measure accurate fluxes via point-source photometry (see Section 9.1.11 and WFC3 ISR 2010-08).
4.1.2 The IR Channel
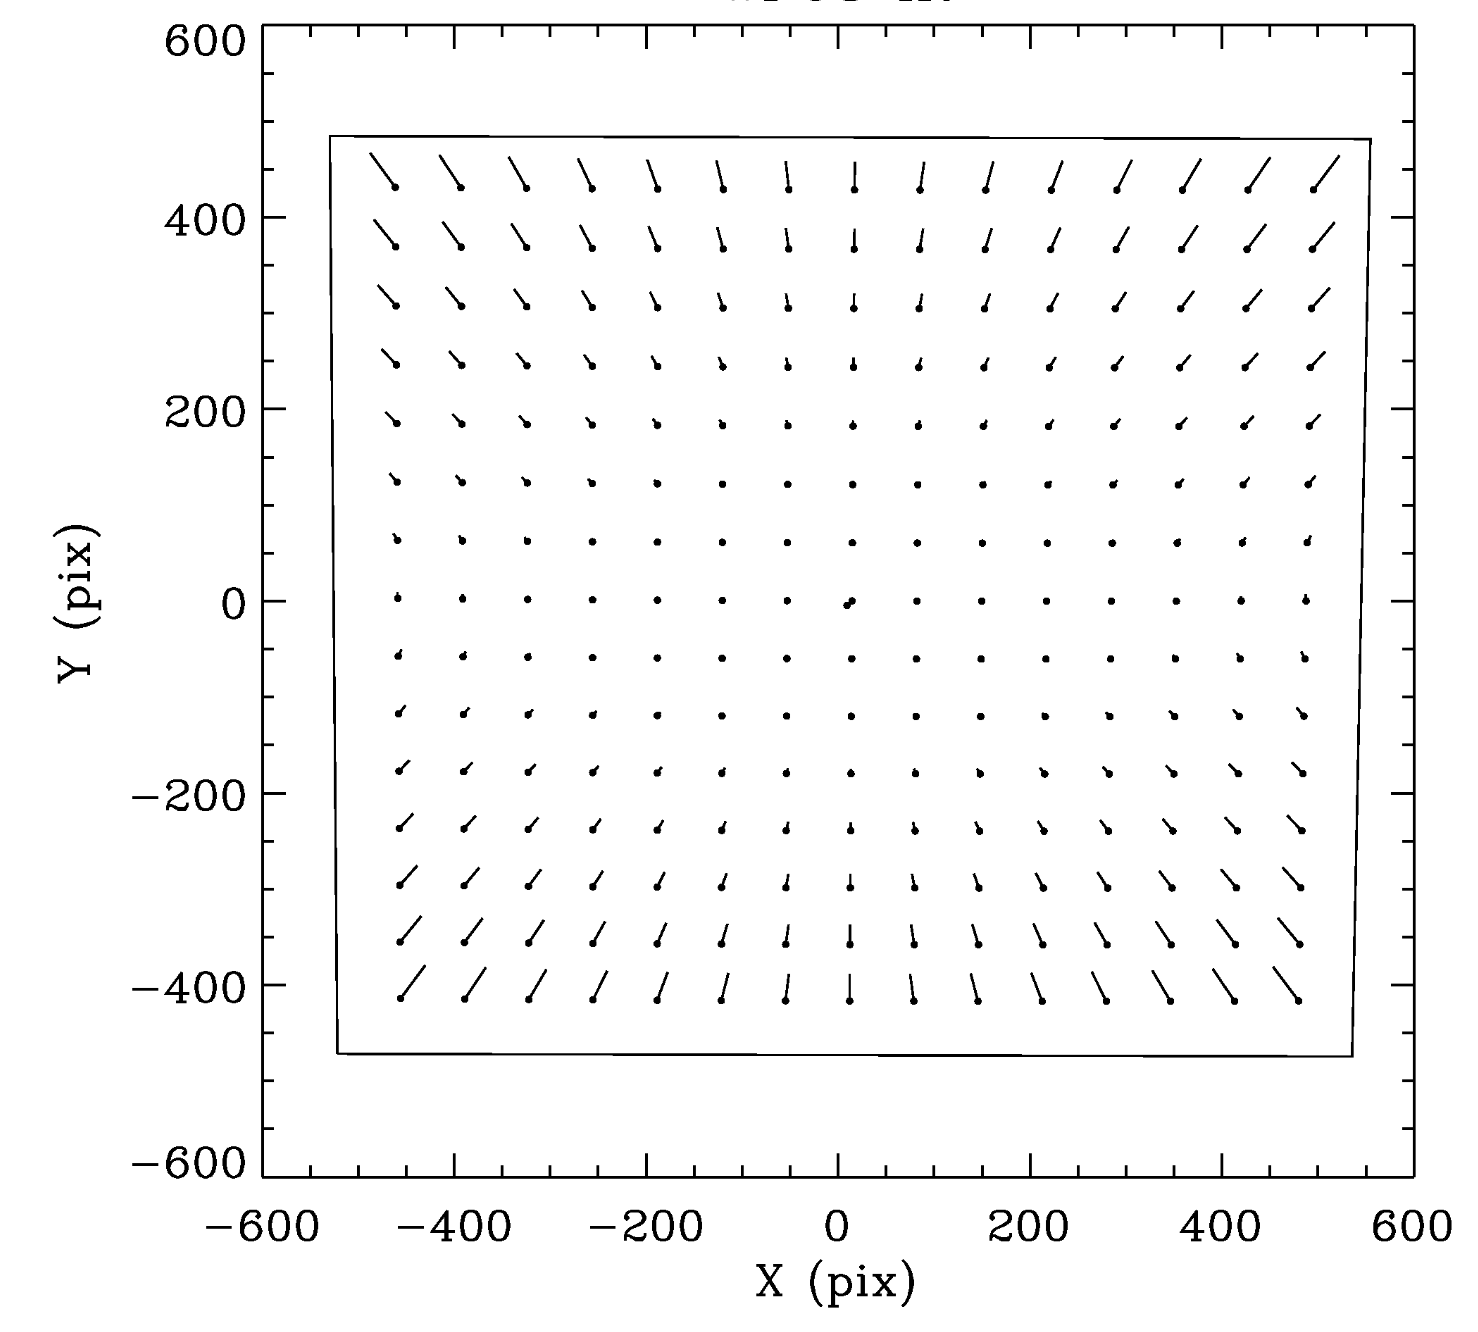
The IR detector field of view is nominally concentric with the UVIS field, but it subtends a smaller area on the sky, 138"×123". The detector tilt is about the x-axis, so the projected aperture shape is nearly a rectangle, with the angle between the x- and y-axes on the sky nearly 90 degrees as shown by the outline in Figure 4.2. At field center, the x- and y-scales are 0.135 and 0.121''/pixel, respectively. A vector plot of the deviation from linearity is also shown in Figure 4.2, where the deviations have been magnified by a factor of 10 for illustrative purposes. The largest deviation is ~10 pixels, corresponding to about 1.4".
-
WFC3 Data Handbook
- • Acknowledgments
- • What's New in This Revision
- Preface
- Chapter 1: WFC3 Instruments
- Chapter 2: WFC3 Data Structure
- Chapter 3: WFC3 Data Calibration
- Chapter 4: WFC3 Images: Distortion Correction and AstroDrizzle
- Chapter 5: WFC3 UVIS Sources of Error
- Chapter 6: WFC3 UVIS Charge Transfer Efficiency - CTE
-
Chapter 7: WFC3 IR Sources of Error
- • 7.1 WFC3 IR Error Source Overview
- • 7.2 Gain
- • 7.3 WFC3 IR Bias Correction
- • 7.4 WFC3 Dark Current and Banding
- • 7.5 Blobs
- • 7.6 Detector Nonlinearity Issues
- • 7.7 Count Rate Non-Linearity
- • 7.8 IR Flat Fields
- • 7.9 Pixel Defects and Bad Imaging Regions
- • 7.10 Time-Variable Background
- • 7.11 IR Photometry Errors
- • 7.12 References
- Chapter 8: Persistence in WFC3 IR
- Chapter 9: WFC3 Data Analysis
- Chapter 10: WFC3 Spatial Scan Data

