7.11 IR Photometry Errors
The estimated errors for the inverse sensitivity (zeropoints) of the WFC3 IR channel computed from observations of the white dwarf standards plus a G-type star are ~1% (statistical) and 1-2% absolute (systematic, uncertainties in the models used as absolute standards, WFC3 ISR 2020-10). The signal to noise ratio (SNR), per observation, for the standard stars is such that the formal Poisson error is ~0.2% for the wide band filters. However, Poisson noise is not the limiting factor at SNR > 100 due to poorer than expected repeatability (WFC3 ISR 2020-10). Data taken using different observation configurations (apertures, sample sequences and numbers, staring versus scan mode) can show differences in photometry. For example, 1 sigma relative photometric repeatability values have been measured at +/- 1.5% when using the staring mode (WFC3 ISR 2019-07) and 0.65% when using the scanning mode (WFC3 ISR 2021-05).
A new calibration for the WFC3/IR inverse sensitivities (zeropoints) was released in 2020 (WFC3 ISR 2020-10). The zeropoint changes (0.5-2%, depending on filter) were due to updated HST CALSPEC models and an increase in the Vega reference flux (Bohlin et al. 2020) as well as new IR flatfields (Section 7.8). For optimum results as well as consistency with WFC3/UVIS and ACS, the new 2020 WFC3/IR zeropoints should be used; data retrieved from MAST after Oct 2020 will have the most current photometric calibration incorporated into the science image header keywords.
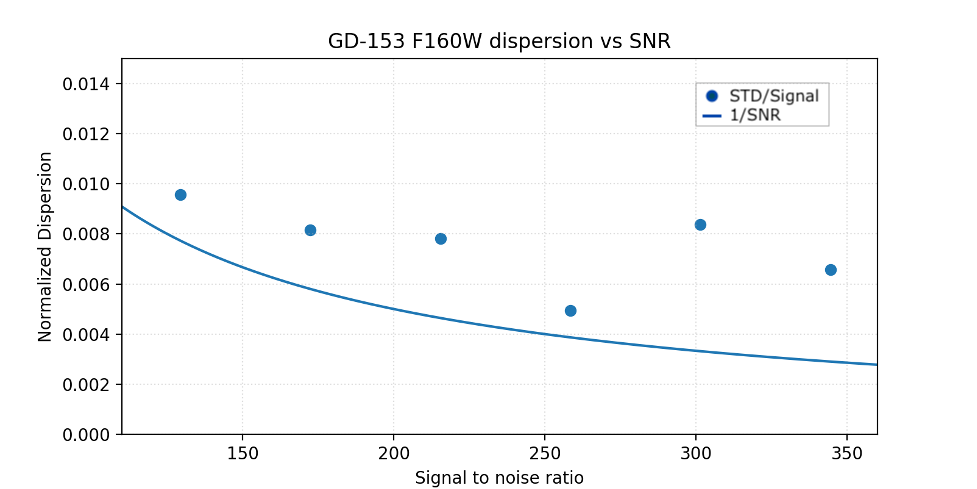
The IR photometric repeatability is occasionally worse than the expected nominal calibration/Poisson error. Some scatter in measurements within a visit can be due to self-persistence of bright sources releasing charge into pixels used in subsequent exposures (WFC3 ISR 2019-07, WFC3 ISR 2016-11). Self-persistence causes sources to appear brighter by about 2% on average when many saturating stars have been exposed onto the array (individual stars may be even brighter). Sufficient dithering (~10-pixel steps) can mitigate persistence effects, bringing average repeatability for many stars down to ~0.5% (WFC3 ISR 2019-07). On the other hand, high-precision photometry from spatial scans suggests that dithering over a larger area on the detector may cause observations of the same source to have a higher level of scatter (WFC3 ISR 2021-05). Some of the dependence of repeatability on the extent of dithers may be due to limitations in the flat field accuracy although visit-to-visit comparisons of scan photometry of the same sources at the same positions also show offsets (Figure 7.14), implying other causes as yet not understood. As evident from Figure 7.14, the overall photometric repeatability, a combined effect of the intra-visit scatter and the inter-visit offsets, typically surpasses the Poisson error in the high Signal-to-Noise regime.
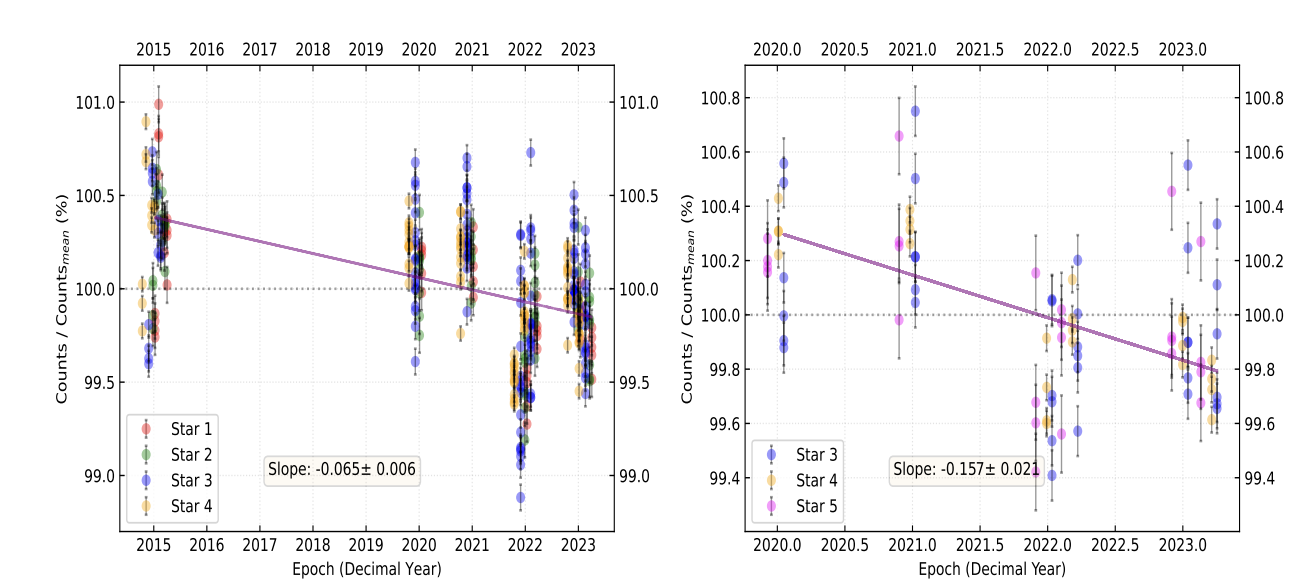
Monitoring of staring mode images of individual standard stars (2009-2024) does not show a discernible time-dependence although data are noisy with short-term 1-sigma repeatability of +/- 1.5% (WFC3 ISR 2019-07). However, analyses of grism observations of spectrophotometric standard stars and scan and staring mode observations of cluster stars show low levels of sensitivity declines ranging from ~ 0.06%/yr to ~ 0.12%/yr (WFC3 ISR 2022-07, WFC3 ISR 2024-01, WFC3 ISR 2024-06). For more discussion on the IR detector sensitivity changes please see Section 9.1.6.
For users who need precise photometry, a complete error analysis should include Poisson noise of the science target as well as the additional sources of photometric error of flat fields, spatial repeatability (~1% peak to peak), temporal repeatability (2% peak to peak), readout noise, uncertainty in the encircled energy (approximately 0.5% at the infinite aperture), uncertainty in the gain (Section 7.2), and processing errors (e.g. sky subtraction, dark subtraction, correction for persistence).
-
WFC3 Data Handbook
- • Acknowledgments
- • What's New in This Revision
- Preface
- Chapter 1: WFC3 Instruments
- Chapter 2: WFC3 Data Structure
- Chapter 3: WFC3 Data Calibration
- Chapter 4: WFC3 Images: Distortion Correction and AstroDrizzle
- Chapter 5: WFC3 UVIS Sources of Error
- Chapter 6: WFC3 UVIS Charge Transfer Efficiency - CTE
-
Chapter 7: WFC3 IR Sources of Error
- • 7.1 WFC3 IR Error Source Overview
- • 7.2 Gain
- • 7.3 WFC3 IR Bias Correction
- • 7.4 WFC3 Dark Current and Banding
- • 7.5 Blobs
- • 7.6 Detector Nonlinearity Issues
- • 7.7 Count Rate Non-Linearity
- • 7.8 IR Flat Fields
- • 7.9 Pixel Defects and Bad Imaging Regions
- • 7.10 Time-Variable Background
- • 7.11 IR Photometry Errors
- • 7.12 References
- Chapter 8: Persistence in WFC3 IR
- Chapter 9: WFC3 Data Analysis
- Chapter 10: WFC3 Spatial Scan Data

