6.4 The Pixel-Based Model
The previous section made reference to the pixel-based model of CTE losses. The WFC3/UVIS model is based on the empirical model for ACS/WFC that was constructed by Anderson & Bedin (2010), which itself was inspired by the model in Massey et al. (2010).
The pixel-based model has two sets of parameters. The first set describes the number and distribution of electron-grabbing traps, and the second set describes the release of trapped charge.
The basic readout model assumes that each column of pixels contains a number of charge traps distributed evenly among its pixels from row j=1 to j=2051. Charge packets for pixels at the top of the chip (far from the serial register) will encounter all of the traps in the column. Those in the middle pixels, at row j~1024, will see half of the traps, and those at j~200 will experience a tenth of them. According to the model, each trap will grab and hold a particular electron in a charge packet (i.e., the first electron, the second, the hundredth, the ten-thousand-third, etc.).
The model also has a release profile for each trap. With most traps, there is a 20% chance the electron will be released into the first upstream pixel, a 10% chance it will be released into the second upstream pixel, etc. For WFC3/UVIS, essentially all trapped electrons are released after 60 transfers. In addition, the traps that grab the first few electrons in a pixel appear to have a much steeper release profile wherein all the charge is released after only 6 transfers (see Figure 5 in WFC3 ISR 2021-09).
The model simulates the readout process by going up through each column, pixel by pixel, from row j=1 (close to the serial register) to j=2051 (at the top of the detector) and determining (1) which electrons will be trapped during the journey down the detector and (2) when these trapped electrons will be released. Even though in reality this is a stochastic process, the model must treat it deterministically. The end result of the readout process is that the observed distribution of pixel values gets blurred in the upstream direction relative to the original distribution, leading to the characteristic CTE trails seen behind sources in CTE-affected UVIS images.
In order to determine optimal parameters for the pixel-based model, we examined the blurring experienced by warm pixels (WPs) in a variety of dark exposures taken in December 2020 with both short (30s) and long (900s) exposure times, and with various post-flash background levels (from zero up to 100 electrons). With this strategy, the WP intensity from the long exposures (where they did not suffer much loss) can be scaled down, in order to estimate the true intensity of the WPs in the short exposures where their fractional losses will be greater and more dependent on the background. This procedure enabled us to directly examine the losses as a function of background.
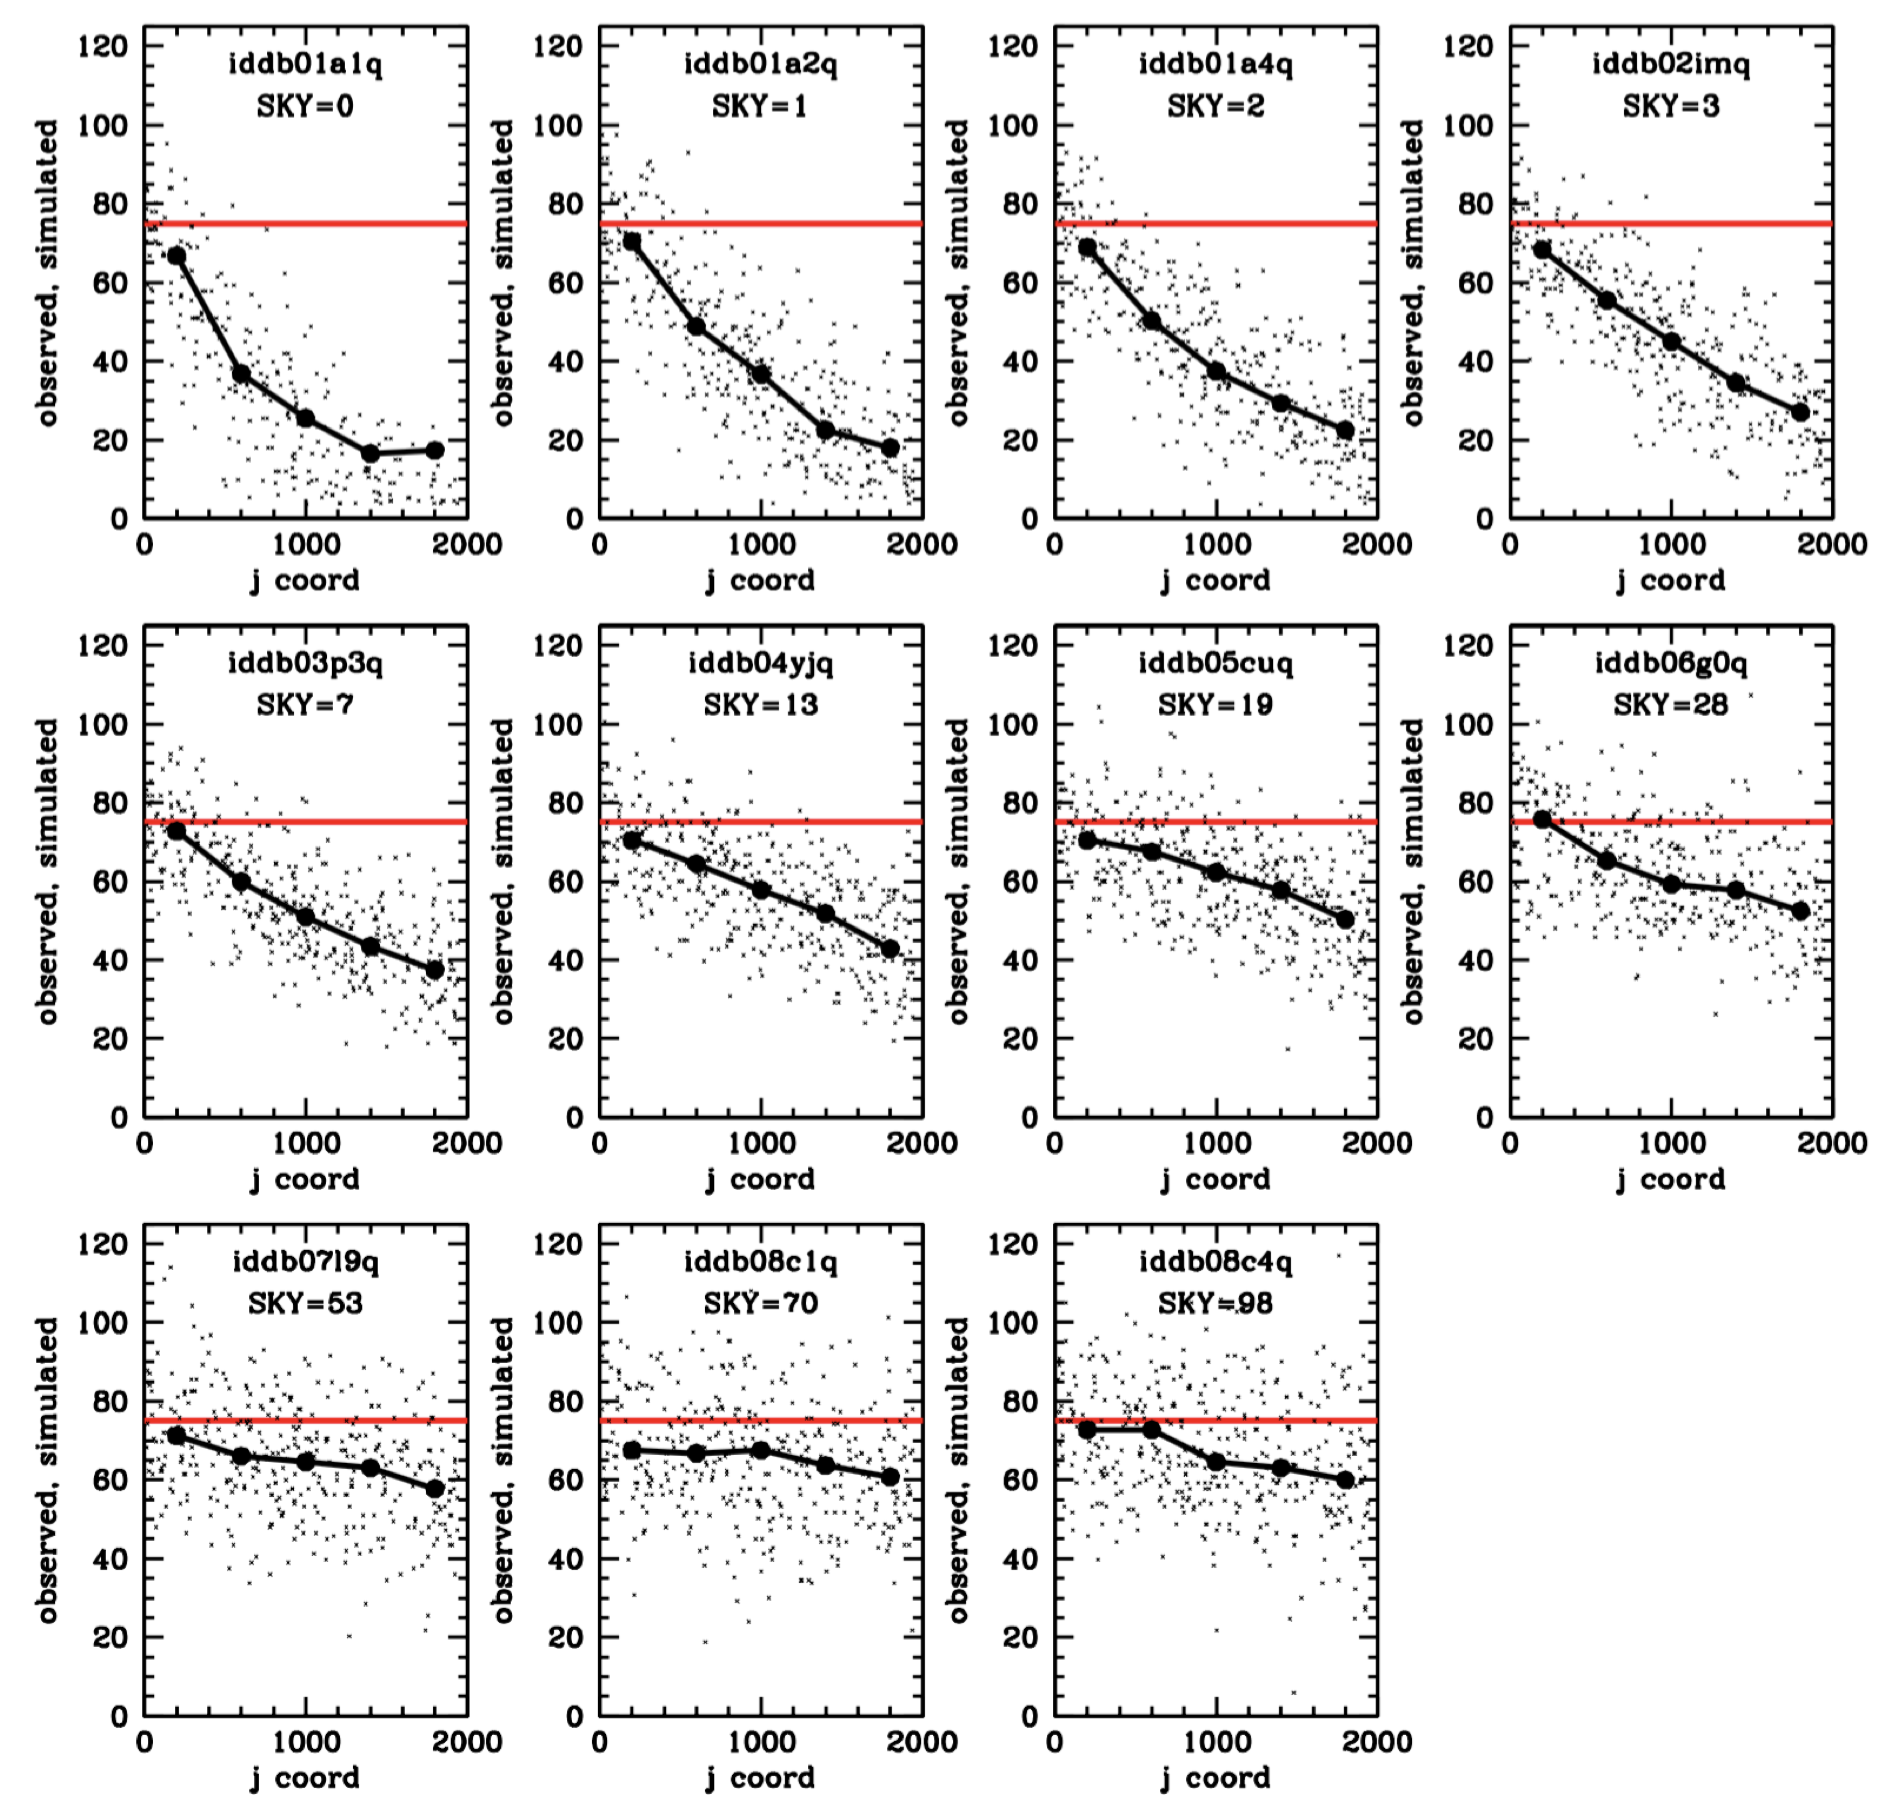
Figure 6.3 tracks a WP that started with 75 electrons and shows how many of these electrons remain in the original pixel packet as a function of how many parallel shifts it experiences. The different panels correspond to different post-flash background levels showing losses are more than 50% for any background below about 19 electrons for a source transferred down the entire detector.
Figure 6.3: The observed number of electrons that survive to readout for a 75 electron warm pixel as a function of the number of parallel shifts to the amplifier. Each panel shows a different background. The red line shows the starting value from the warm pixel. Taken from Figure 3 of WFC3/ISR 2021-09.
Plots such as Figure 6.3 allow us to pin down the CTE losses as a function of background level, and thus as a function of packet size. The right panel in Figure 6.2 shows the number of traps experienced by the marginal electron. A faint source will experience pathological losses on any background where this is greater than 1.
The curves in Figure 6.2 can be used in a forward model to simulate how an initial pixel distribution would be blurred by the readout process. In order to use the model on science images, this procedure must be inverted, i.e. we must determine what original image – when pushed through the readout algorithm – generates the observed image. This is formally a non-linear deconvolution process.
There are several challenges to a pixel-based reconstruction. One challenge is that the observed images represent not just the charge that arrived at the readout, but they represent this charge plus a contribution from the readnoise (3.1-3.2 electrons for UVIS) along with any noise associated with the charge-trapping and -releasing, which is a random process (in other words, a noisy process). The other challenge is that the model assumes an even distribution of traps throughout the detector, even though in actuality this distribution is stochastic: each column will naturally have a slightly different number of traps and even the distribution of traps within each column will surely not be perfectly uniform.
The issue of readnoise introduces a serious complication. An empty image will be read out to have a variance of about 3.2 electrons in each pixel due to readnoise. If the original image on the detector had a pixel-to-pixel variation of 3.2 electrons on a low background, then the charge-transfer process would blur the image out so much that the image that reached the amplifier would have a variance of less than 0.5 electron (see Figure 12 in WFC3/ISR 2021-09). The CTE reconstruction algorithm determines what the original image would have to be in order to be read out as the observed image. If we include readnoise in this observed target image, then the original image would have to start with an extremely large amount of pixel-to-pixel variation (a sigma of more than 10 electrons) for it to end up with 3.2 electrons of pixel-to-pixel variation after the blurring readout process. In other words, we would have to add a factor of five more noise to arrive at the image that was read out which would not produce a useful reconstruction.
To mitigate this "readnoise amplification" issue, we take the observed image (with readnoise) and determine the smoothest possible image that is consistent with the image, modulo readnoise and noise from the charge-transfer process. We choose the smoothest possible image, since the smoother the image, the less the readout algorithm will end up redistributing charge. While this may not represent the true counts that arrived at the readout register, it should provide the most conservative possible CTE correction. The pixel-based reconstruction algorithm then operates on this "smooth" image, and the redistribution of flux is applied to the observed image (with readnoise).
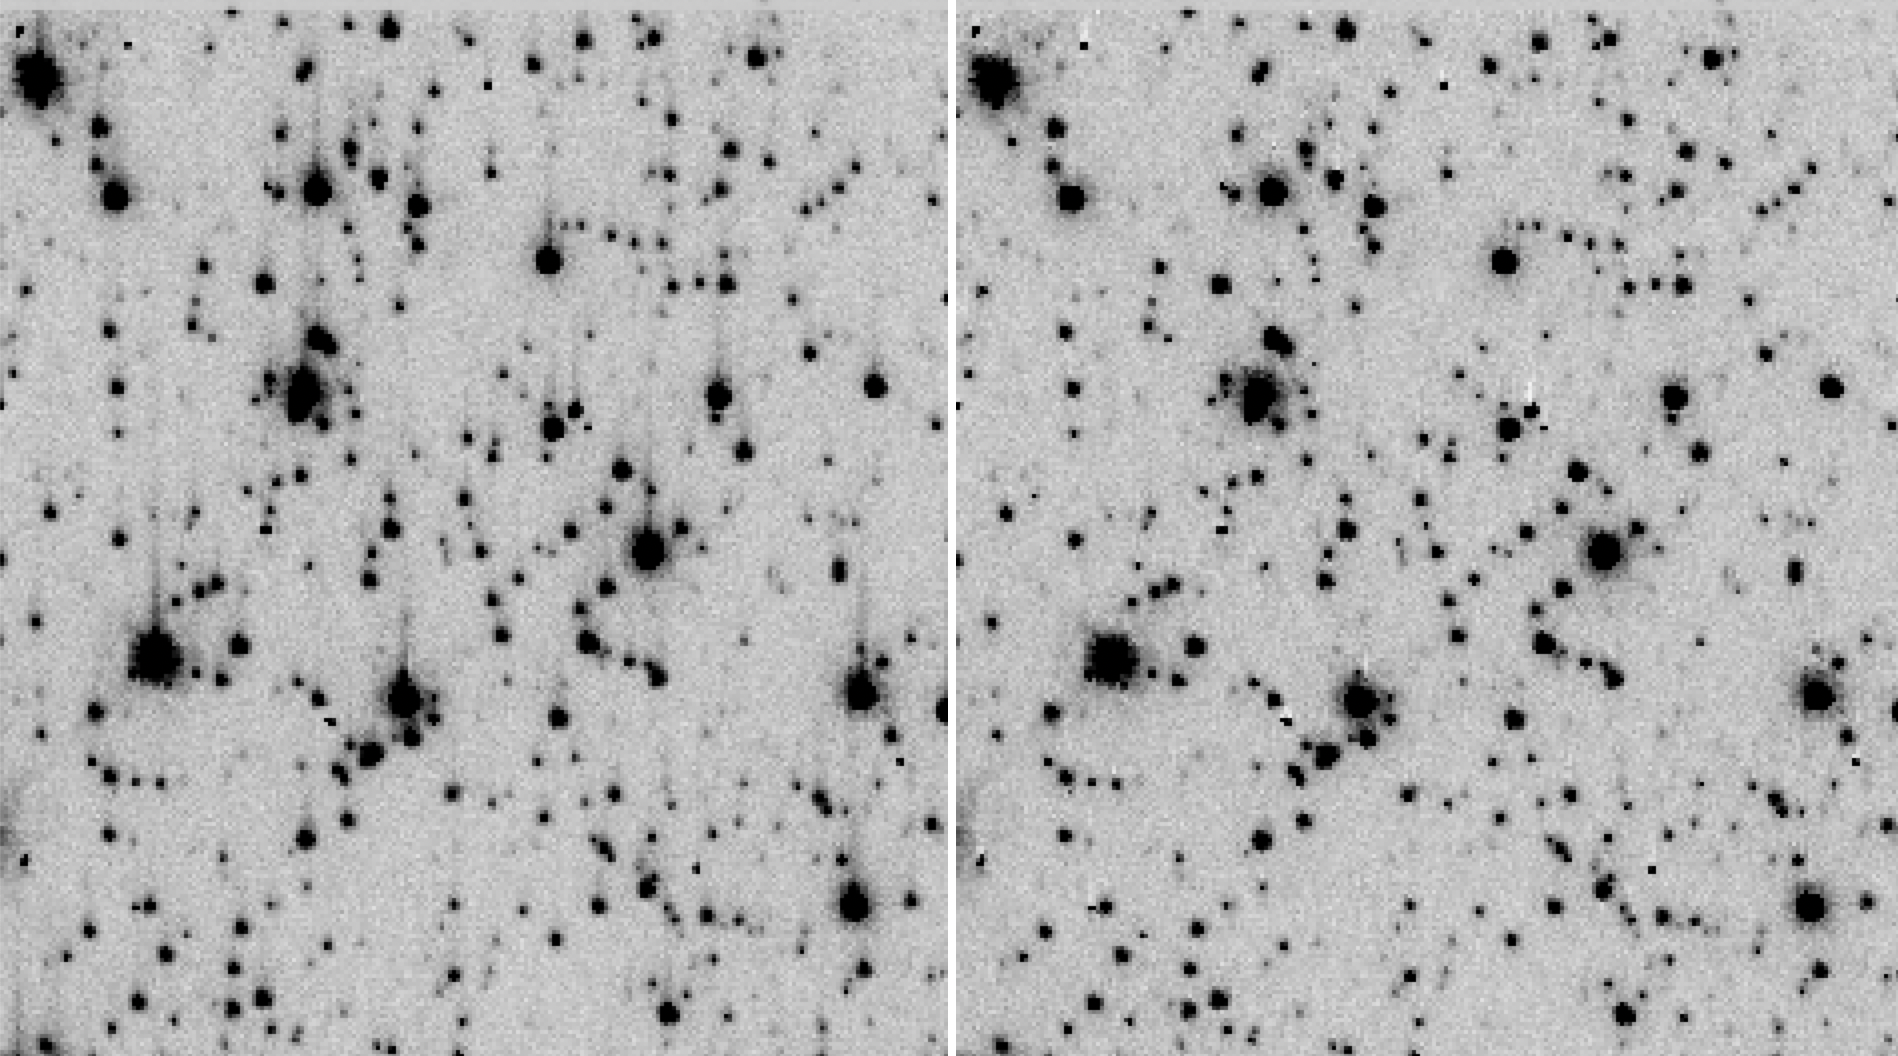
Figure 6.4 shows an example of a star field that has considerable CTE losses. The images show the uncorrected _flt image on the left and the pipeline CTE-corrected _flc image on the right, a 4-s exposure (iehr02lkq) taken at the center of globular cluster Omega Centauri. The portion of the image shown is near the top of the chip, furthest from the amplifier where CTE losses are greatest. The image background here is 15 electrons/pixel (5 electrons natural and 10 electrons post-flash). The CTE trails are obvious in the image on the left. The pixel-based algorithm does a reasonable job removing the trails and restoring flux into the sources. The few instances of over-subtracted trails (which appear as white pixels in this inverted stretch) come from cosmic rays that struck the detector during readout. The electrons from these CRs did not undergo the 2000 parallel transfers that the other electrons in the pixels did.
Before 2016, the pixel-based CTE correction was a standalone FORTRAN program available for download. Since then, however, the pixel-based CTE correction has been incorporated into the automated calibration pipeline for all UVIS full-frame images (calwf3 version 3.3 and later) and most1 UVIS subarray images (calwf3 version 3.4 and later). Invoking the pixel-based CTE correction within the calwf3 pipeline is controlled via an image header calibration switch (PCTECORR), and associated calibration table (PCTETAB) and CTE-corrected reference files (e.g. DRKCFILE). calwf3 will, by default, produce two sets of products: the standard non-CTE-corrected files (e.g. *_flt.fits and *_drz.fits), as well as the CTE-corrected results (*_flc.fits, *_drc.fits). Observers can use the *_flc.fits and *_drc.fits data products in the same way as *_flt.fits and *_drz.fits files.
In general, the pixel-based correction is accurate to about 25%. However, in low-signal/low-background situations where CTE losses can become greater than 25%, the reconstruction procedure can have difficulties as it uses the surviving charge distribution as a "scaffold" upon which to reconstruct the lost charge. When the surviving charge no longer resembles the original charge distribution, reconstruction becomes impossible. Until 2015, images with backgrounds of 12 electrons/pixel or greater experienced CTE losses less than 25%, but now in 2024, image backgrounds of 20 electrons/pixel keep CTE losses for faint source to less than ~23% (WFC3 ISR 2024-04). In the future, higher image background are likely to be required to continue to keep the CTE losses under 25%, where the pixel-based correction works best.
One other feature of pixel-based reconstruction worth mentioning is that when the background is low and CTE losses are large, there are two undesired consequences: the correction algorithm cannot reconstruct the scene and it amplifies noise. To avoid this, the pipeline algorithm is designed to suppress noise amplification, and as a result, little reconstruction is attempted for sources with fluxes near the background level (see Section 5 of WFC3 ISR 2021-09 for more details). Given the limitations of reconstruction at low signal and background levels, we have made available some empirical corrections that do not suffer from noise amplification in WFC3 ISR 2021-13.
Another way to extract CTE corrected fluxes post-observation is to use the software routine, hst1pass. hst1pass performs PSF-fitting photometry to measure stellar (or point-source) fluxes and positions and the user can specify output parameters to include CTE-corrected fluxes. For more information on hst1pass, including guidance on how to download and run this routine, please see WFC3 ISR 2022-05.
The latest information on the status of CTE and how to mitigate its effect is is always available on the WFC3 CTE webpage.
The WFC3 CTE web page is at: http://www.stsci.edu/hst/instrumentation/wfc3/performance/cte
1For observers with subarrays that do not contain overscan columns (UVIS2-M1K1C-SUB and UVIS2-M512C-SUB) – these are not supported by the calwf3 CTE correction – there is a workaround available that uses the standalone FORTRAN CTE-correction code (STAN 18).
-
WFC3 Data Handbook
- • Acknowledgments
- • What's New in This Revision
- Preface
- Chapter 1: WFC3 Instruments
- Chapter 2: WFC3 Data Structure
- Chapter 3: WFC3 Data Calibration
- Chapter 4: WFC3 Images: Distortion Correction and AstroDrizzle
- Chapter 5: WFC3 UVIS Sources of Error
- Chapter 6: WFC3 UVIS Charge Transfer Efficiency - CTE
-
Chapter 7: WFC3 IR Sources of Error
- • 7.1 WFC3 IR Error Source Overview
- • 7.2 Gain
- • 7.3 WFC3 IR Bias Correction
- • 7.4 WFC3 Dark Current and Banding
- • 7.5 Blobs
- • 7.6 Detector Nonlinearity Issues
- • 7.7 Count Rate Non-Linearity
- • 7.8 IR Flat Fields
- • 7.9 Pixel Defects and Bad Imaging Regions
- • 7.10 Time-Variable Background
- • 7.11 IR Photometry Errors
- • 7.12 References
- Chapter 8: Persistence in WFC3 IR
- Chapter 9: WFC3 Data Analysis
- Chapter 10: WFC3 Spatial Scan Data

