6.3 The Nature Of CTE Losses
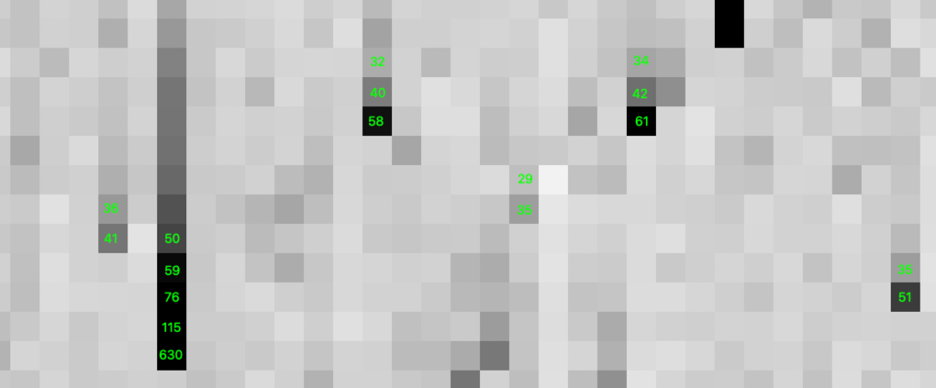
CTE losses arise during the readout process, as the charge packet for each pixel is transferred pixel-by-pixel down the detector, in parallel, to the serial register. As the packet moves through the silicon of the detector, it often encounters imperfections (traps) in the lattice that have been generated by radiation damage. These traps can temporarily detain individual electrons, and once an electron is trapped, it becomes separated from its original charge packet. This trapped electron is often released some time later during the readout and finds itself in an upstream pixel. For this reason, CTE takes charge away from downstream pixels and deposits it into upstream pixels. Visually, the effect results in “trails” of charge that extend out from sources in the direction opposite the readout amplifier (See Figure 6.1).
Electrons are confined within pixels by the electrostatic potential wells created by the electrodes. Charge packets that have more electrons tend to occupy a physically larger volume within the pixel than smaller charge packets, on account of their self-repulsion pushing back against the pixel's potential well. The larger volume occupied by larger charge packets provides a larger cross-section to traps as the packets are shuffled through the silicon lattice. For the WFC3/UVIS model we discuss below in Section 6.4, a cloud with 10 electrons, for example, will see about 3 times more traps than a cloud with only 1 electron. Thus, even though losses increase in an absolute sense when a cloud has more electrons, the per-electron losses decrease with increasing packet size.
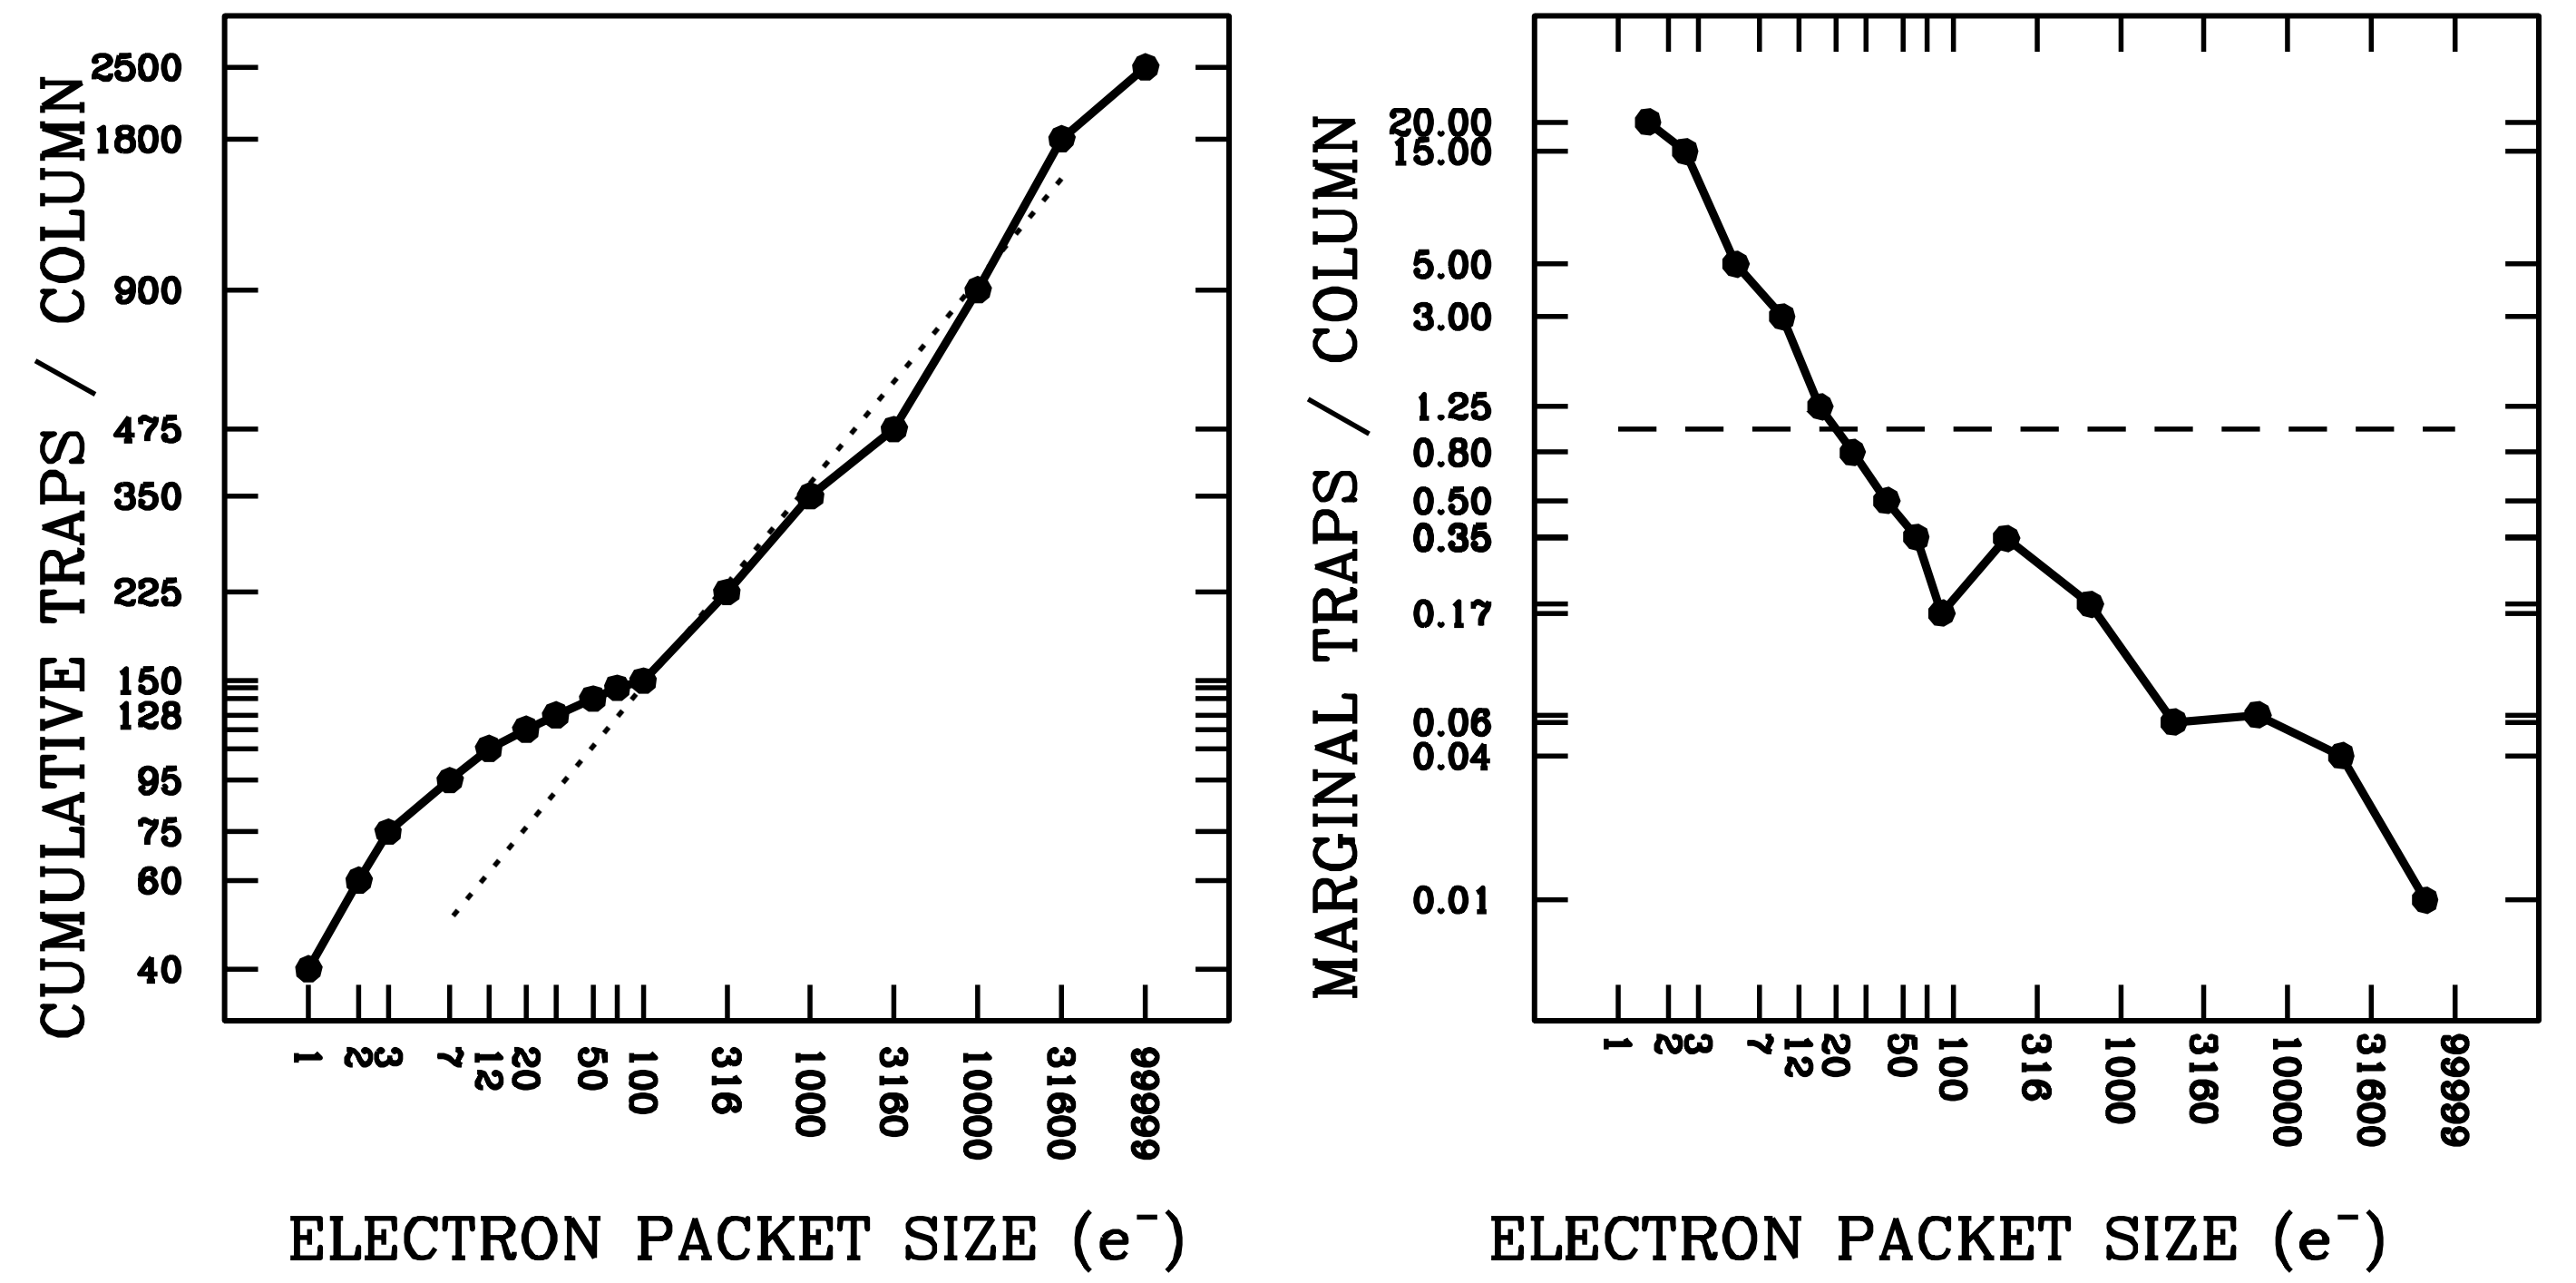
Figure 6.2: Effect of Electron Traps
Left: The dark line shows the cumulative number of traps in each column as a function of the size of the electron packet. The dotted line shows the extrapolation of the power law from the bright end; Right: The derivative of the cumulative curve on the left, showing the marginal number of traps seen by the Nth electron in a packet. The dashed line denotes where there is one trap per marginal electron.
Figure 6.2 shows the current model for charge traps (WFC3 ISR 2021-09 , see also Section 6.4). The model was based on the analysis of the blurring experienced by hot and warm pixels in dark exposures taken in late 2020. On the left, we show the cumulative number of traps as a function of packet size. When there is no background, a charge packet that contains just one electron and is located far from the readout amplifier will encounter 40 traps on its ~2000-pixel journey to the serial register. Clearly, such an electron is unlikely to survive the journey. A charge packet with ten electrons will encounter 100 traps and is also not likely to be detected.
A packet with 100 electrons will encounter 150 traps. Of course, an isolated packet that starts with 100 electrons will not maintain that size all the way down, so in practice it will see fewer than 150 traps during the latter part of its journey. Packets with 1000 electrons on zero background will lose about 300 electrons, so over 70% will survive to the register. Packets with 10,000 electrons on an image with no background will lose only about 6% of their electrons.
In the right panel of Figure 6.2 we show the marginal number of traps, i.e. the number of traps that would be seen by the Nth electron in a charge packet. The first electron will encounter almost 40 traps on its path to the readout register, and thus, have a very small chance of making the journey with its original pixel. The second electron will see 20 traps, the third 15, and the tenth about 2, and so on.
Note that these curves cannot directly predict the original number of electrons from the observed number, since as a charge packet gets shuffled down the detector, it loses electrons and therefore its electron-loss-rate changes in a non-linear way. In addition, downstream packets can “prefill” traps, such that upstream packets can be shuffled down the chip with fewer losses. CTE losses can also cause asymmetries in source shapes which is why a forward-modeling approach is required to reconstruct the pixel distribution.
The fact that the marginal losses drop sharply as a function of charge packet size means that if we have a small level of background in an image, many of the traps will be kept filled by the background and will not therefore affect the science photons above the background.
The curve shows that in an image with a background of zero, a marginal electron will see 20 traps, but if the background is 10, it will likely see less than two traps. If the background is around 20, in fact, a marginal science electron has about a 50% chance of making it to the readout register (as of late 2020).
Finally, we note that the delta-function charge packets that we have been considering in our study of warm pixels in dark exposures are of course not representative science sources. Even unresolved objects on UVIS have a point-spread-function shape (PSF) where the central pixel receives about 20% of the star's light and the immediately adjacent pixels each receive about 10% of the light. As a consequence, the outer pixels of sources will fill some traps that the sources' inner pixels then will not have to encounter. This can increase the overall transfer efficiency of real-world sources over the warm pixel delta functions in the darks.
-
WFC3 Data Handbook
- • Acknowledgments
- • What's New in This Revision
- Preface
- Chapter 1: WFC3 Instruments
- Chapter 2: WFC3 Data Structure
- Chapter 3: WFC3 Data Calibration
- Chapter 4: WFC3 Images: Distortion Correction and AstroDrizzle
- Chapter 5: WFC3 UVIS Sources of Error
- Chapter 6: WFC3 UVIS Charge Transfer Efficiency - CTE
-
Chapter 7: WFC3 IR Sources of Error
- • 7.1 WFC3 IR Error Source Overview
- • 7.2 Gain
- • 7.3 WFC3 IR Bias Correction
- • 7.4 WFC3 Dark Current and Banding
- • 7.5 Blobs
- • 7.6 Detector Nonlinearity Issues
- • 7.7 Count Rate Non-Linearity
- • 7.8 IR Flat Fields
- • 7.9 Pixel Defects and Bad Imaging Regions
- • 7.10 Time-Variable Background
- • 7.11 IR Photometry Errors
- • 7.12 References
- Chapter 8: Persistence in WFC3 IR
- Chapter 9: WFC3 Data Analysis
- Chapter 10: WFC3 Spatial Scan Data

