2.2 WFC3 File Structure
All WFC3 science data products are two-dimensional images that are stored in Multi-Extension FITS files. All images taken during an exposure are bundled in a single FITS file, with each image stored in a separate FITS image extension (see Section 2.2 of the Introduction to the HST Data Handbooks). The WFC3 file structure differs for UVIS and IR data, as explained in the following sections.
2.2.1 UVIS Channel File Structure
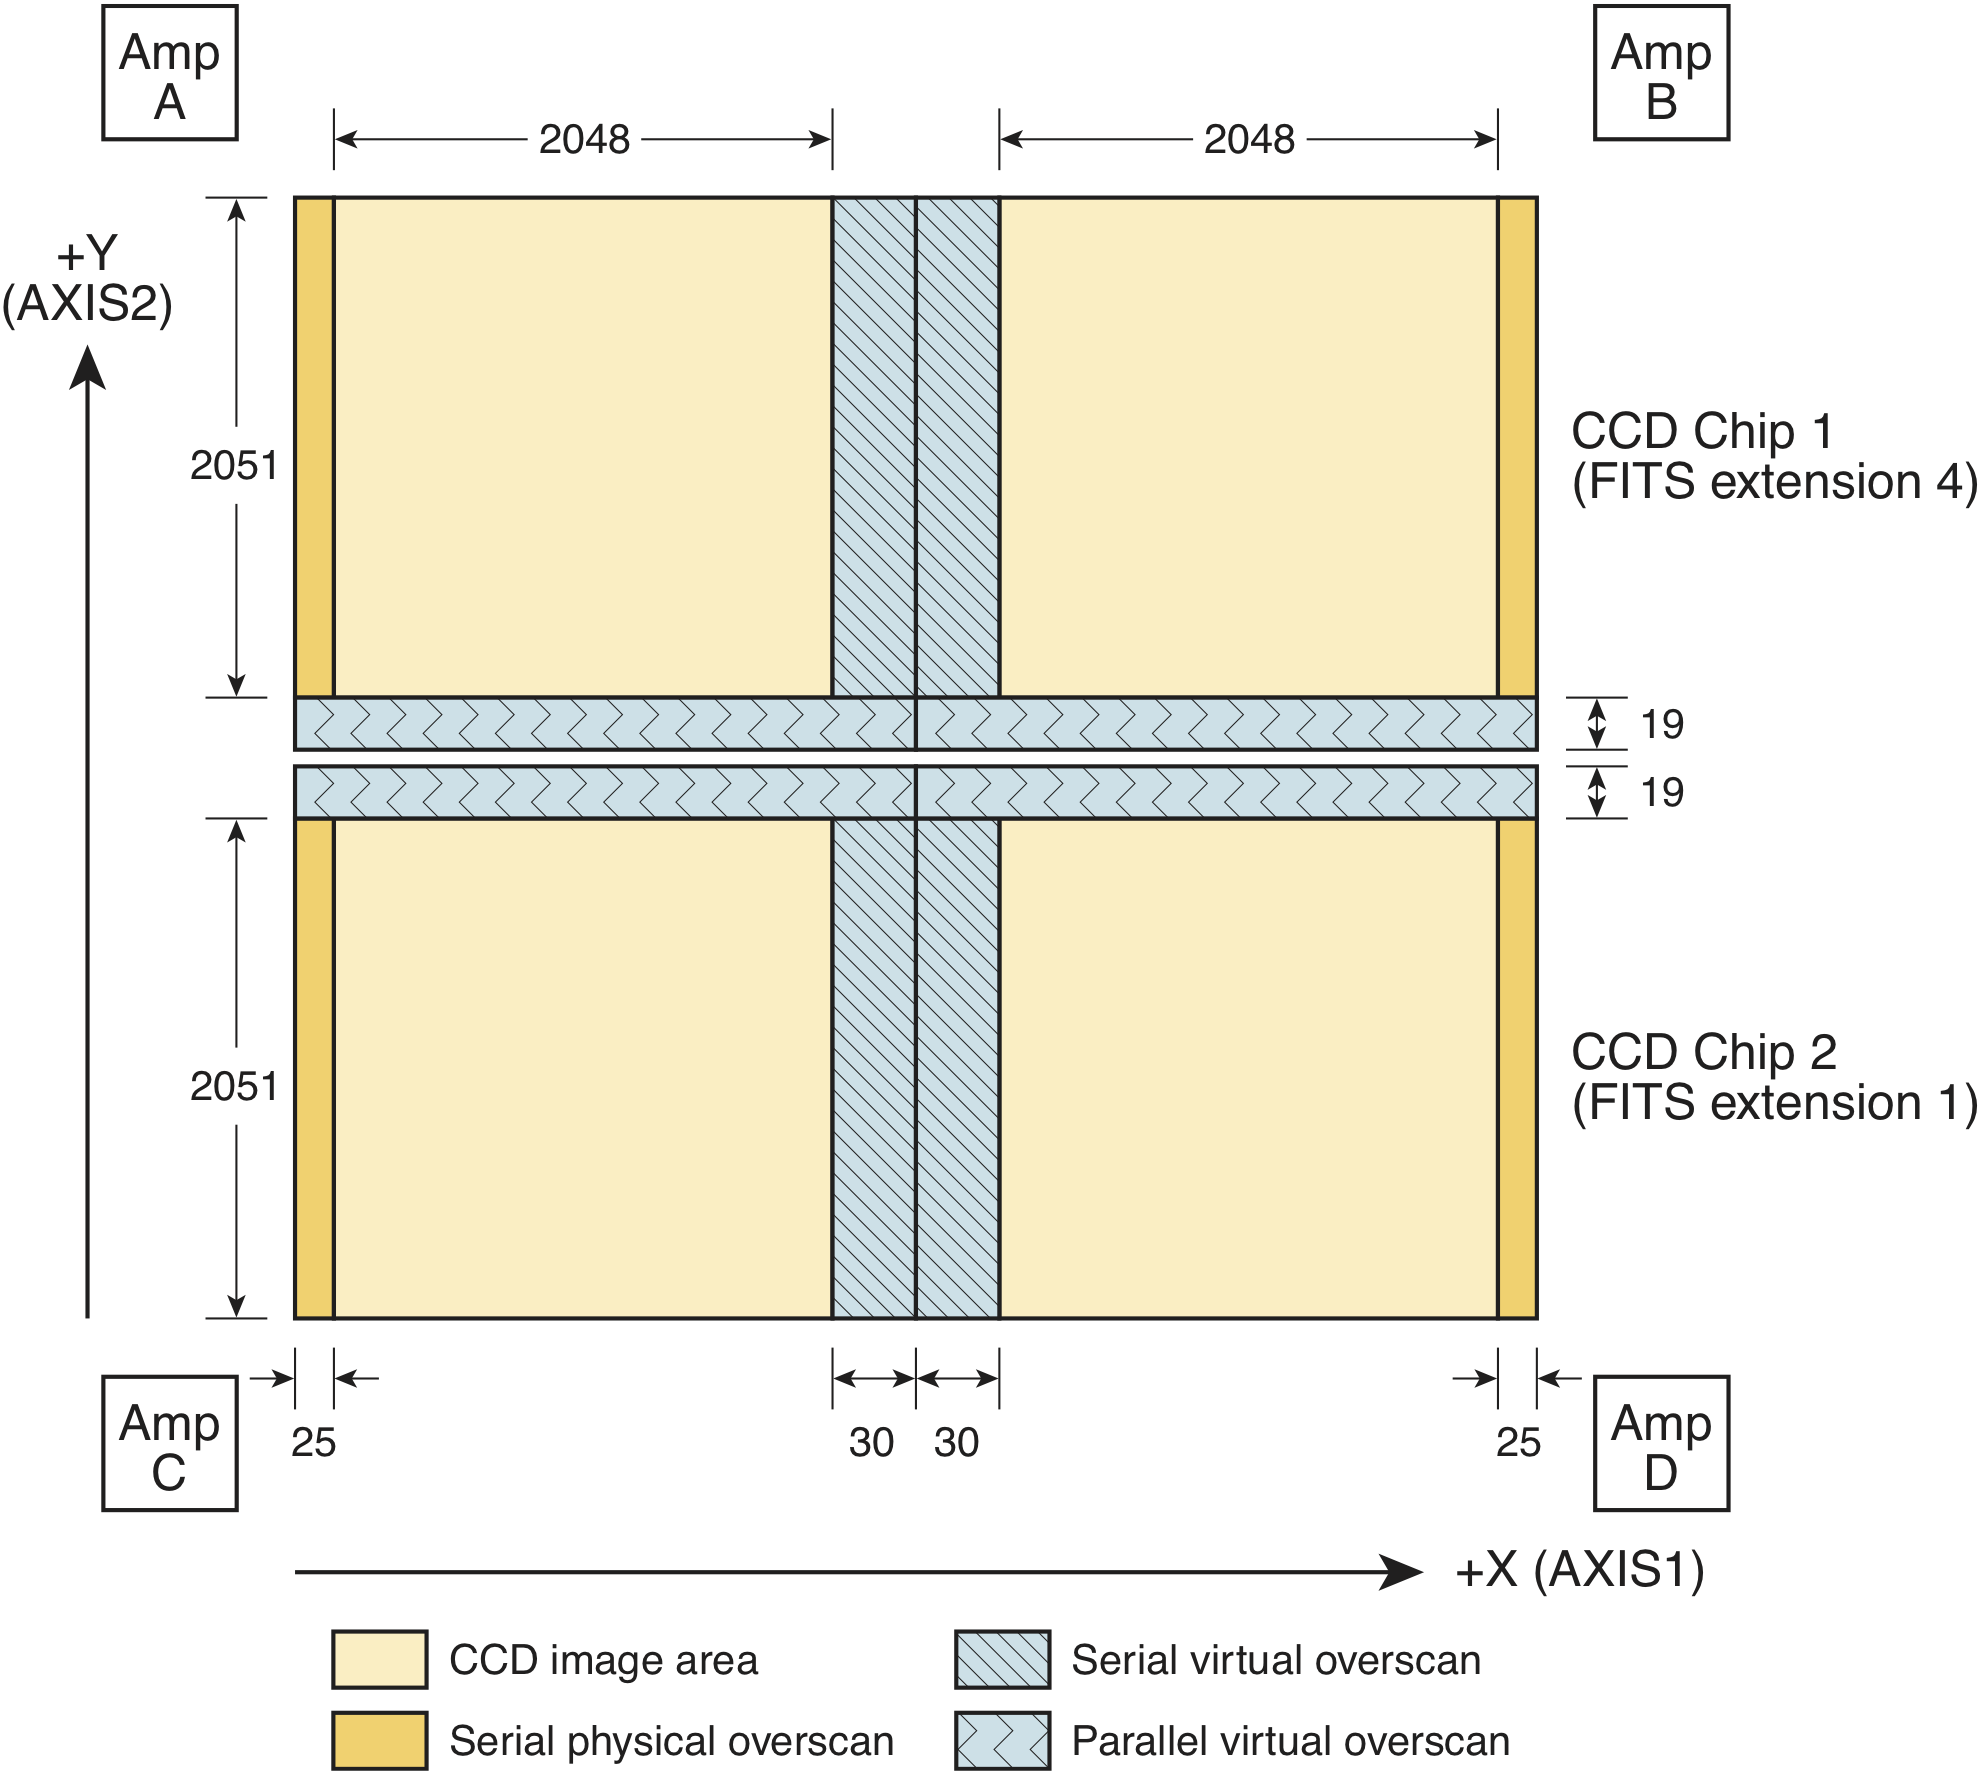
The WFC3 UVIS detector is similar in structure to the ACS WFC detector, with two chips butted together to form a complete detector array (there is a 1.2 arcsec gap between the two detectors). As shown in Figure 2.1, each chip has 4096 × 2051 imaging pixels, with 19 rows and 30 columns of virtual overscan at the long and short inside edges respectively, and 25 columns of physical overscan on each side. As a result, full-frame raw images have a total of 4206 × 4140 pixels, and after overscan subtraction in the calibration process, calibrated images have a total of 4096 × 4102 pixels.
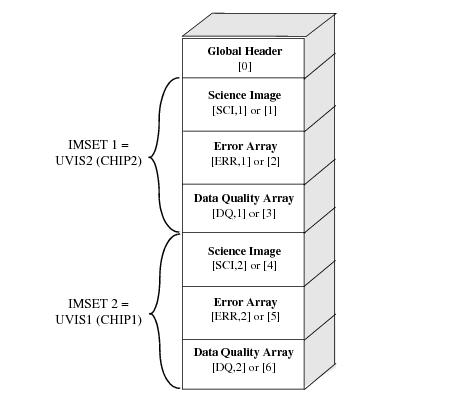
The UVIS detector operates only in ACCUM mode to produce time-integrated images. The data read from the two chips are stored in separate image sets, or "imsets" (see Section 2.2 of the Introduction to the HST Data Handbooks) within a single FITS file. Each imset contains three data arrays that are stored in three separate images extensions:
- the science image (SCI)
- the error array (ERR)
- the data quality array (DQ)
When the user retrieves their data from the archive, the system delivers calibrated data which are processed by both calwf3 and AstroDrizzle. The AstroDrizzle step updates the header astrometric information, and adds 9 additional extensions to the final _flt or _flc files. In addition, with the release in Dec 2019 of improved astrometric corrections for WFC3, additional "headerlet" extensions, which encapsulate WCS information, will be appended to the _flt or _flc files. Thus, the FITS file corresponding to a single full-frame calibrated UVIS exposure has a minimum of 16 extensions and potentially more depending on the available astrometric solutions (as summarized in Table 2.5.)
The zeroth extension is the global or primary header unit, and the science, error, and data quality arrays are in extensions 1-6. As seen in Figure 2.1 CHIP1 (UVIS1) is above CHIP2 (UVIS2) in y-pixel coordinates, but it is stored in imset 2 in the FITS file, shown graphically in Figure 2.2. Thus, the chip-extension notation is counter-intuitive. To display the science image for UVIS1, the user must specify the second science extension "file.fits[sci,2]" or "file.fits[4]". Similarly, the data quality and error arrays for UVIS1 are specified as "file.fits[dq,2]" or "file.fits[5]" and "file.fits[err,2]" or "file.fits[6]", respectively.
The extensions 7-14 contain information about the geometric distortion. Extensions 7 to 10 are tabular data stored as imsets [D2IMARR] with one extension per each CCD chip’s access. These imsets are filter-independent corrections for the CCD pixel-grid irregularities, an artifact of the manufacturing process imprinted on the detector itself. The lithographic-mask pattern correction is bi-linearly interpolated and used for pixel-by-pixel correction prior to correction for geometric distortion via the IDCTAB.
The extensions from 11 to 14 contain tabular data stored as imsets [WCSDVARR] with one extension per each CCD chip axis. These tabular data, which describe the fine-scale filter-dependent non-polynomial distortion corrections, are bi-linearly interpolated and used for pixel-by-pixel correction after correction for geometric distortion via the IDCTAB.
The 15th FITS extension, called [WCSCORR], contains a history of WCS changes, if the data were reprocessed with a new distortion correction reference file.
The 16th (and beyond) FITS extension, called [HDRLET], contains astrometric alignment information, one solution per headerlet.
2.2.2 IR Channel File Structure
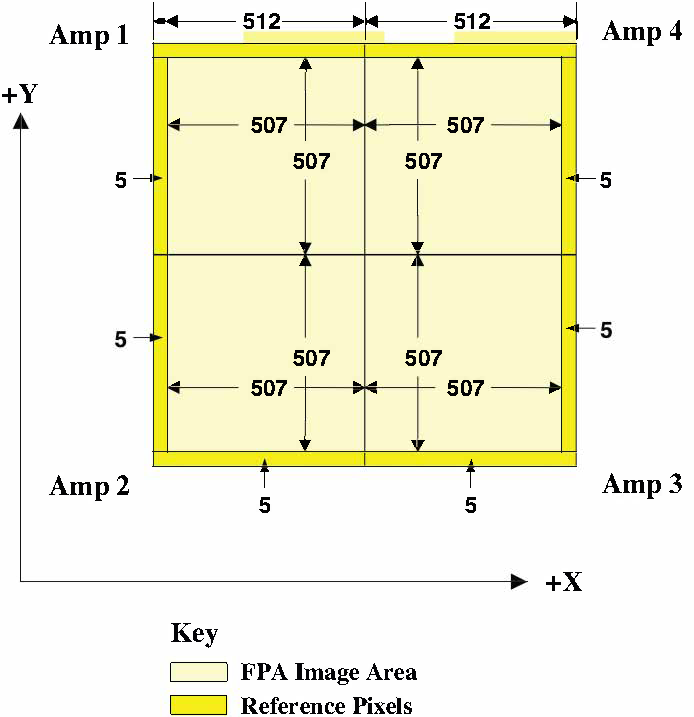
The WFC3 IR channel uses a single 1024 × 1024 pixel detector. Reference (bias) pixels occupy the 5 rows and columns on each side of the detector, thus yielding bias-trimmed images with dimensions of 1014 × 1014 pixels, as shown in Figure 2.3.
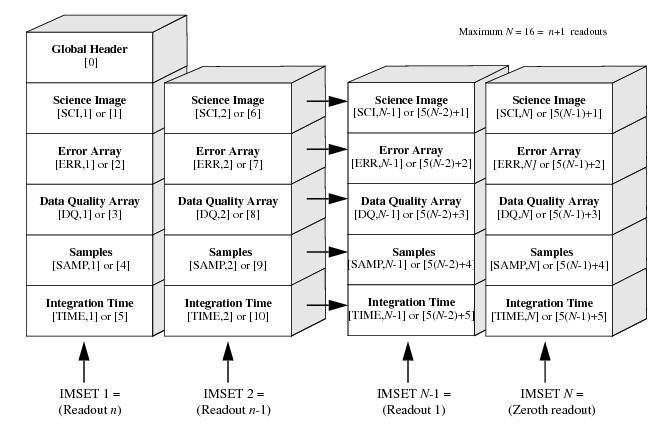
Like NICMOS, the IR channel operates only in MULTIACCUM mode, which starts an exposure by resetting all the detector pixels to their bias levels and recording those levels in an initial "zeroth" readout. This is then followed by n non-destructive readouts (n can be up to 15 and is set by the observer as parameter NSAMP in the Phase II proposal); the data associated with each readout are stored in a separate imset in the FITS file. The final FITS file will have n+1 imsets (one for each n plus one for the zeroth read).
For IR data, each imset consists of five data arrays:
- the science image (SCI),
- the error array (ERR),
- the data quality array (DQ),
the number of samples array (SAMP), and
- the integration time array (TIME).
An IR IMA (_ima.fits) FITS file will therefore contain: the primary header unit and N imsets, which all together form a single IR exposure. An IR FLT (_flt.fits) FITS file, on the other hand, contains only a single imset after the CRCORR ramp fitting step.
The primary header keyword NSAMP records the total number of readouts worth of data contained in the file. Note that the value of NSAMP keyword is increased by 1 relative to proposal parameter NSAMP because the keyword counts the zeroth read.
The order of the IR imsets in the FITS file is in reverse time order. The first imset in the file contains the result of the longest integration time (the last readout of the MULTIACCUM series), the second imset contains the next-to-last readout and so on. The zeroth readout is stored last in the imset. This file organization has the advantage of placing the final readout first in the file, where it is easiest to access. This organization is shown graphically in Figure 2.4
IMSET | SAMPNUM | SAMPTIME |
SCI, 16 | 0 | 0 |
SCI, 15 | 1 | 2.933 |
SCI, 14 | 2 | 102.933 |
SCI, 13 | 3 | 202.933 |
SCI, 12 | 4 | 302.933 |
SCI, 11 | 5 | 402.934 |
SCI, 10 | 6 | 502.934 |
SCI, 9 | 7 | 602.934 |
SCI, 8 | 8 | 702.935 |
SCI, 7 | 9 | 802.935 |
SCI, 6 | 10 | 902.935 |
SCI, 5 | 11 | 1002.936 |
SCI, 4 | 12 | 1102.936 |
SCI, 3 | 13 | 1202.936 |
SCI, 2 | 14 | 1302.936 |
SCI, 1 | 15 | 1402.937 |
2.2.3 Contents of Individual Arrays
The following sections explain the contents and origin of each of the individual arrays for WFC3 data products.
Science Image (SCI)
This image contains the data from the focal plane array (FPA) detectors. In raw data files, the science array is an integer (16-bit) image in units of data numbers, or DN. In calibrated data files, it is a floating-point value image in physical units of electrons (UVIS) or electrons per second (IR).
Error Array (ERR)
This is a floating-point image that contains an estimate of the statistical uncertainty associated with each corresponding science image pixel. It is expressed as a real number of signal units or signal rates (as appropriate for the units of the science image). The values for this array are calculated during calibration with the calwf3 task, combining detector read noise, Poisson noise in the detected signal, and uncertainties from applied calibration reference data.
Data Quality Array (DQ)
This array contains 16 independent flags indicating various status and problem conditions associated with each corresponding pixel in the science image. Each flag has a true (set) or false (unset) state and is encoded as a bit in a 16-bit integer word. Users are advised that this word should not be interpreted as a simple integer, but must be converted to base-2 and each bit interpreted as a flag. Table 2.7 lists the WFC3 data quality flags.
In raw data files, the ERR and DQ arrays will usually have the value of zero for all pixels, unless, for the DQ array, errors are detected in the down linked data. In order to reduce data volume, if no errors exist, both ERR and DQ extensions will contain null data arrays with PIXVALUE equal to zero.
Table 2.7: WFC3 Data Quality flags
| FLAG Value | Bit Setting | Data Quality Condition | |
|---|---|---|---|
UVIS | IR | ||
0 | 0000 0000 0000 0000 | OK | OK |
1 | 0000 0000 0000 0001 | Reed Solomon decoding error | Reed Solomon decoding error |
2 | 0000 0000 0000 0010 | Data replaced by fill value | Data replaced by fill value |
4 | 0000 0000 0000 0100 | Bad detector pixel | Bad detector pixel |
8 | 0000 0000 0000 1000 | (unused) | Deviant zero read (bias) value |
16 | 0000 0000 0001 0000 | Stable hot pixel | Stable hot pixel |
32 | 0000 0000 0010 0000 | Unstable pixel ** | Unstable pixel |
64 | 0000 0000 0100 0000 | (Obsolete: Warm pixel) | (Obsolete: Warm pixel) |
128 | 0000 0000 1000 0000 | Bad pixel in bias | Bad reference pixel |
256 | 0000 0001 0000 0000 | Full well saturation | Full well saturation |
512 | 0000 0010 0000 0000 | Bad or uncertain flat value | Bad or uncertain flat value, including "blobs" |
1024 | 0000 0100 0000 0000 | Charge trap and sink pixels | (unused) |
2048 | 0000 1000 0000 0000 | A to D saturation | Signal in zero read |
4096 | 0001 0000 0000 0000 | Cosmic ray detected by AstroDrizzle | Cosmic ray detected by AstroDrizzle |
8192 | 0010 0000 0000 0000 | Cosmic ray detected by calwf3 during CR-SPLIT or RPT-OBS combination | Cosmic ray detected during calwf3 up the ramp fitting (flagged in _ima only) |
16384 | 0100 0000 0000 0000 | Pixel affected by ghost/crosstalk (not used) | Pixel affected by ghost/crosstalk (not used) |
** Unstable hot pixel DQ flags (32) are available for observations after Nov 8, 2012, and are based on post-flashed dark reference files. For prior dates, both stable and unstable hot pixels are assigned a DQ flag value (16). See WFC3 ISR 2018-15 for details.
Number of Samples Array (SAMP)
This array is present only for IR data. It is a 16-bit integer array and contains the number of samples used to derive the corresponding pixel values in the science image. For raw and intermediate data files, the sample values are set to the number of readouts that contributed to the science image. For calibrated files, the SAMP array contains the total number of valid samples used to compute the final science image pixel value, obtained by combining the data from all the readouts and rejecting cosmic ray hits and saturated pixels. Similarly, when multiple exposures (i.e., REPEAT-OBS) are combined to produce a single image, the SAMP array contains the total number of samples retained at each pixel for all the exposures.
Integration Time Array (TIME)
This array is present only for IR data. This is a floating-point array that contains the effective integration time associated with each corresponding science image pixel value. For raw and intermediate data files, the time value is the total integration time of data that contributed to the science image. For calibrated datasets, the TIME array contains the combined exposure time of the valid readouts or exposures that were used to compute the final science image pixel value, after rejection of cosmic rays and saturated pixels from the intermediate data.
In raw and intermediate data files, the SAMP and TIME arrays will each have the same value for all pixels. In order to reduce data volume, these image extensions contain null arrays, and the value of the number of samples and integration time is stored in the header keyword PIXVALUE in the SAMP and TIME extensions, respectively.
-
WFC3 Data Handbook
- • Acknowledgments
- • What's New in This Revision
- Preface
- Chapter 1: WFC3 Instruments
- Chapter 2: WFC3 Data Structure
- Chapter 3: WFC3 Data Calibration
- Chapter 4: WFC3 Images: Distortion Correction and AstroDrizzle
- Chapter 5: WFC3 UVIS Sources of Error
- Chapter 6: WFC3 UVIS Charge Transfer Efficiency - CTE
-
Chapter 7: WFC3 IR Sources of Error
- • 7.1 WFC3 IR Error Source Overview
- • 7.2 Gain
- • 7.3 WFC3 IR Bias Correction
- • 7.4 WFC3 Dark Current and Banding
- • 7.5 Blobs
- • 7.6 Detector Nonlinearity Issues
- • 7.7 Count Rate Non-Linearity
- • 7.8 IR Flat Fields
- • 7.9 Pixel Defects and Bad Imaging Regions
- • 7.10 Time-Variable Background
- • 7.11 IR Photometry Errors
- • 7.12 References
- Chapter 8: Persistence in WFC3 IR
- Chapter 9: WFC3 Data Analysis
- Chapter 10: WFC3 Spatial Scan Data


