5.3 Dark Current and Hot Pixels
5.3.1 Dark Current
Superdark reference files are generated on a daily basis, with typically between 10 - 18 individual dark images (acquired over 4-5 days) contributing to each superdark. The individual darks are recalibrated with the appropriate superbias and post-flash files (see Section 3.2.8 for more information on post-flash) using the most recent calwf3 software version, stacked to remove cosmic rays, and converted from DN to e-/sec. Any pixels with values > 54 e-/hr are considered hot; their values are left unchanged in the science extension and flagged with a value of 16 in the DQ extension, which is propagated into the final science image DQ extensions. In this way, observers can decide whether to ignore hot pixels or to allow the dark subtraction to stand (for instructions on how to control which bit masks are used during drizzling, please consult the HST DrizzlePac Handbook). Because the mean dark current in the WFC3 CCDs is low (~11 e-/hr/pixel in early-2024) it is very difficult to achieve a useful signal-to-noise for pixels that have normal levels of dark current with data from only 10-18 individual dark frames. Subtracting these uncertain values from science images during calwf3 processing would introduce noise into the calibrated images. Therefore, all cold pixels in the SCI extensions of superdark reference images are set to an anneal-cycle-averaged value. In other words, each good pixel in the superdark reference image is set to the average value of that pixel over all individual darks taken in an anneal cycle (about 100 frames). The generation of the dark calibration reference files is described in detail in WFC3 ISR 2016-08. Users can verify whether the superdark file most appropriate to their observations has been installed for pipeline use in two different ways:
- Re-retrieve the images from the MAST, which automatically updates the headers and recalibrates the data
- Check the CRDS (Calibration Reference Data System).
Using an out-of-date superdark reference file can produce a poor dark correction by either leaving too many hot pixels uncorrected and unflagged or creating many negative "holes" caused by the correction of hot pixels which were not actually hot in the science data (i.e., if the detectors were warmed to anneal hot pixels in the interim).
5.3.2 Hot Pixels
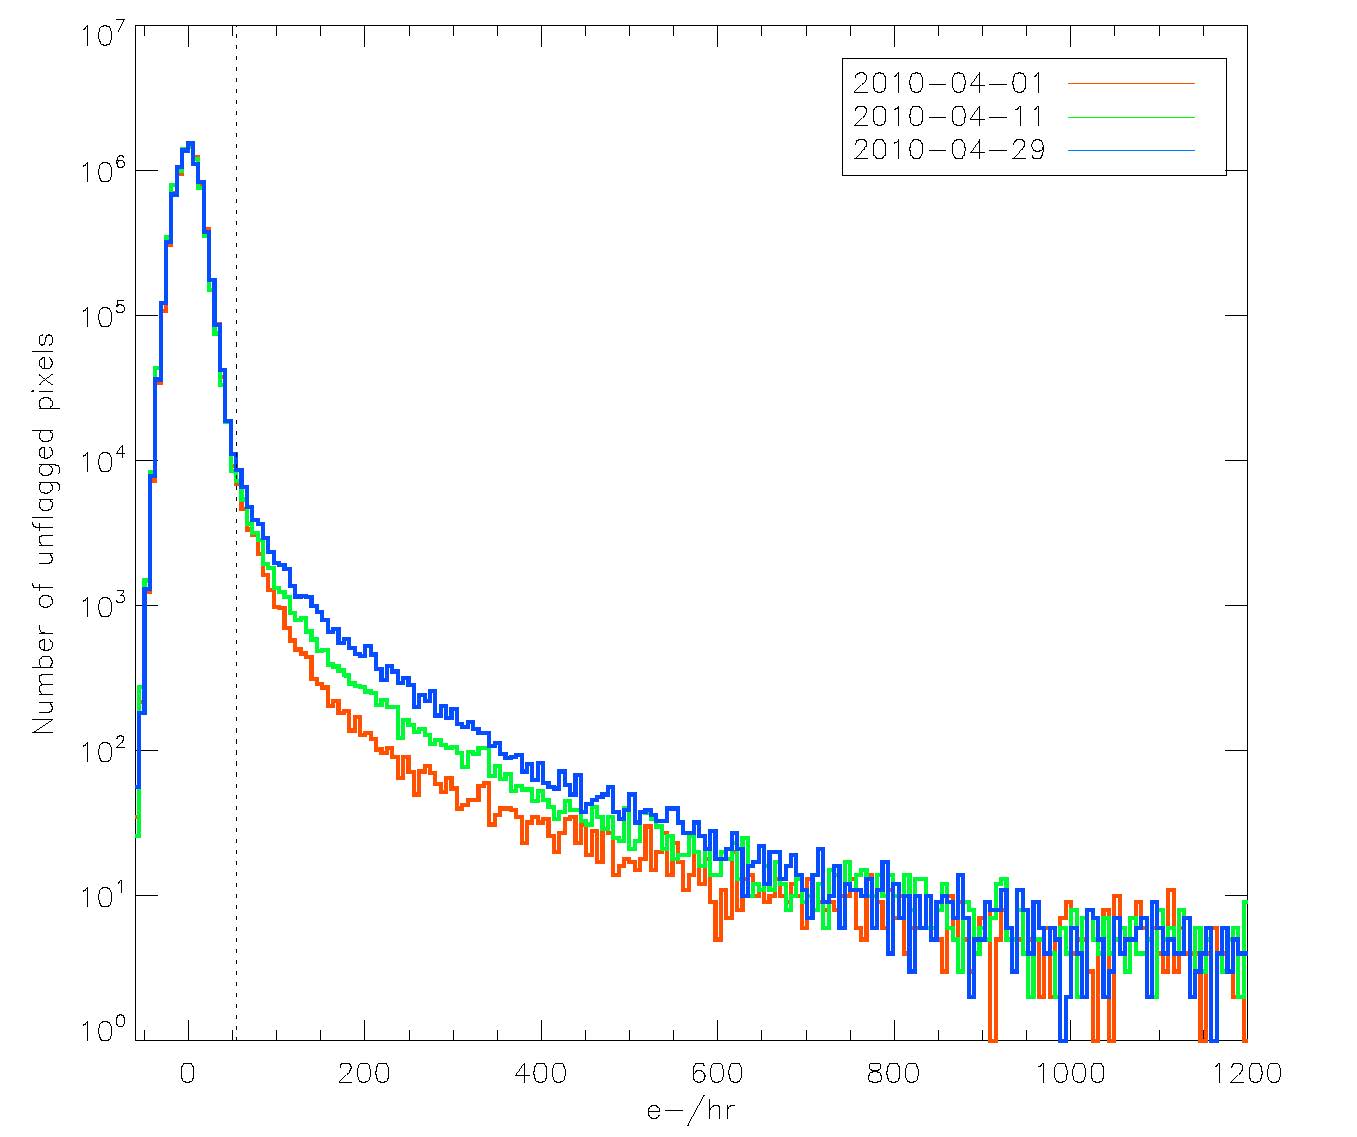
Two types of bad pixels are routinely monitored using on-orbit WFC3 data: hot pixels and dead pixels. Hot pixels, i.e., those pixels with a higher than normal dark current, are identified in dark frames using a threshold of 0.015 e-/sec (54 e-/hr). The cutoff was chosen based on the tail of the dark histogram in early on-orbit data (see Figure 5.1) as well as visual examination of the dark frames. The number of hot pixels increases over time due to on-orbit radiation damage. Periodic anneal procedures, where the UVIS detector is warmed to ~20°C, successfully fix a percentage of the hot pixels. Hot pixel locations and levels are provided by the UVIS superdark reference files, although dithering can mitigate their effect as well.
Dead pixels, specifically dead columns, are identified through visual inspection of both individual and stacks of internal frames. Bad pixel locations are propagated into the bad pixel mask (header keyword BPIXTAB and the file name *_bpx.fits) that is applied by calwf3 in the standard data reduction pipeline. Currently, there are ~8000 dead pixels in chip 1 (amps A and B) and ~16000 in chip 2 (amps C and D); these comprise ~0.1% and 0.2% of each chip, respectively.
Trending
We have chosen a limit of 0.015 e-/s/pixel (54 e-/hr/pixel) to be the threshold above which we consider a pixel to be "hot" based on the tail of the histogram as well as a visual examination of 900-second dark frames taken during Cycle 17. Figure 5.1 shows a histogram of CR-free pixels from 900-second darks taken at three different times after the April 2010 anneal procedure: immediately following the procedure (red line), about 10 days later (green line), and about 18 days later (blue line). The increase in hot pixels due to on-orbit radiation damage is apparent; the anneal procedures have been found to fix a fraction of the hot pixels which accumulate over time. The hot pixel cutoff is shown with a vertical line at 54 e-/hr; at this threshold, the growth rate for WFC3 hot pixels is ~1000 pixels/day (see WFC3 ISR 2016-08 for more information on darks and hot pixels).
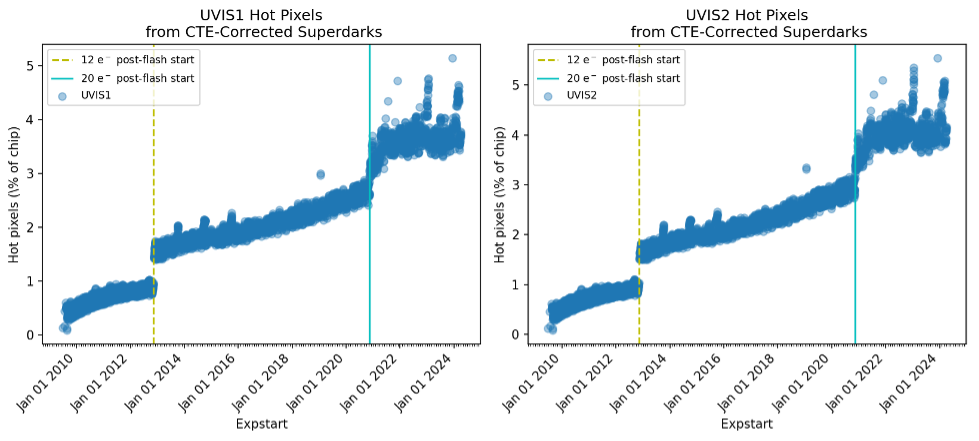
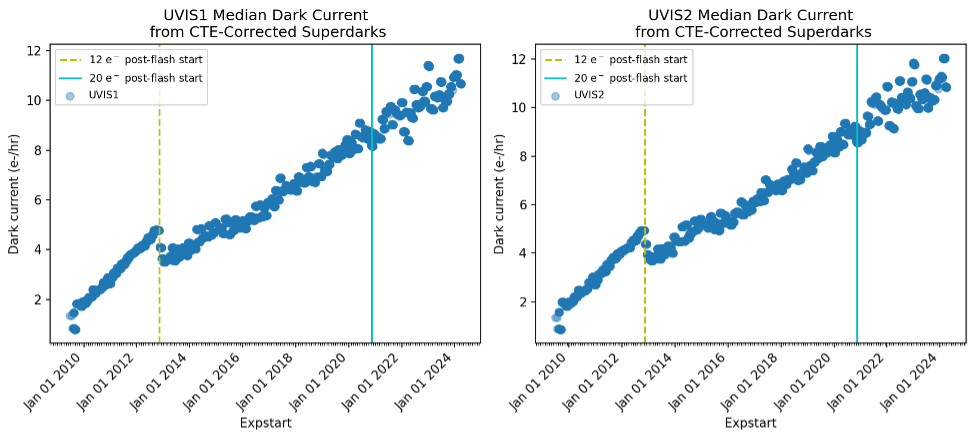
Figure 5.2 shows the number of hot pixels as a function of time since the installation of WFC3 on HST. Between Nov 8, 2012 (dashed yellow vertical line) and Nov 12, 2020 (solid cyan vertical line) the UVIS darks were post-flashed, i.e., an LED applied a background of 12 e-/pixel to each image. Post-flashing preserves faint signal in pixels far from the amps that otherwise would have been undetectable due to CTE losses. With the ongoing accumulation of damage due to high-energy radiation, as of Nov 12, 2020 the UVIS darks have had a 20 e- post-flash to further mitigate diminishing CTE. The result is a jump in the number of *detected* hot pixels as the increased background improves CTE, allowing the hot pixels to be identified as hot. In addition, the post-flash's suppression of hot pixel and cosmic ray CTE trails also causes a commensurate reduction in the overall measured dark current. Dark current and hot pixel plots are updated, as resources allow, on the WFC3 Performance Monitoring webpage or the user may email the STScI helpdesk.
As discussed above, the WFC3 CCD detectors degrade over time due to exposure to the space environment. This damage manifests itself in the darks as an increase in the number of individual hot pixels as well as in an overall higher dark current (CTE loss, another manifestation of damage, is discussed in more detail in Chapter 6). Based on a fit to non-post-flashed dark frames taken since launch, the median dark current (excluding hot pixels) is increasing by ~0.5 e-/hr/pixel/year and is currently at ~11 e-/hr/pixel in 2024 (Figure 5.2). The number of permanent hot pixels, i.e., pixels that the anneals are unable to restore to normal levels, are growing by about 35/chip/day, or 0.05-0.1% per month.
Figure 5.2: UVIS hot pixels and dark current over time
Top row: Percent of UVIS hot pixels (>0.015 e-/s) as a function of time for Chip 1 (left) and Chip 2 (right). Bottom row: median UVIS dark current (e-/hr) as a function of time. The changes to the post-flash levels for UVIS dark frames are marked by vertical lines. The plots include data up to March 31, 2024.
Several events led to a temporary increase in the number of hot pixels flagged in the UVIS superdarks. Recoveries from safe mode of either the instrument or observatory near the end, or at the beginning, of an anneal cycle can cause apparent elevated numbers of hot pixels in the last superdarks during which the safing occurred, or the first superdarks immediately following recovery from safe mode.
5.3.3 Pixel Stability
The dark current present in WFC3 UVIS can be used to monitor a pixel's behavior and determine whether the pixel varies excessively over time compared to its expected noise. In 2018 we began using a data structure known as a 'pixel history' image to efficiently evaluate each WFC3 UVIS pixel over time. The pixel stability is analyzed in steps, anneal cycle by anneal cycle, because the population of hot pixels changes after each anneal procedure. The goal of the analysis is to identify and flag pixels that vary significantly in dark current over an anneal cycle compared to their expected uncertainty; such pixels are deemed "unstable" and thus more unreliable compared to their stable counterparts. Conversely, we also aim to identify pixels that are stable despite being flagged as hot pixels; since their variance is low and their uncertainties are well calculated, such pixels need not be discarded during nominal calibration of hot pixels. The metric for "stability" is determined from a ratio defined as "F", hereafter referred to as the stability ratio (as described in WFC3 ISR 2018-15):
| (1) | F = \frac{Variance(SCI) - Mean(ERR^2)}{Mean(SCI)}+1 |
where SCI is the science value of the pixel and ERR is the uncertainty of the pixel value. Using the stability ratio, we define four classes of pixels that we monitor each anneal cycle:
| Classification Name | Definition |
|---|---|
| Cold and Stable | Mean(SCI) < 54 e-/hr and F < 2 |
| Cold and Unstable | Mean(SCI) < 54 e-/hr and F ≥ 2 |
| Hot and Stable | Mean(SCI) ≥ 54 e-/hr and F < 2 |
| Hot and Unstable | Mean(SCI) ≥ 54 e-/hr and F ≥ 2 |
The vast majority of hot pixels (~4% of the detector in 2021) are found to be stable and can be calibrated. A small portion of pixels (<1.5%) are genuinely unstable and should not be used. The data quality flag 32 is used to mark the unstable pixels in the bad pixel reference files, and hot pixels continue to be flagged with the usual value of 16. In Figure 5.3 we show a breakdown of each of the four classes of pixels for each anneal cycle from the November 2012 anneal through 2019. The y-axis is a broken logarithmic axis to simplify the visualization. Approximately 90% of the distribution consists of cold stable pixels. While the hot stable pixels would normally be discarded in science observations via the hot pixel flag in UVIS dark reference files, such pixels need not be thrown away since they do not vary significantly throughout the anneal cycle relative to their expected uncertainty. As a result, ~4-8% (depending on epoch) of the detector pixels are sufficiently stable to be calibrated in science observations rather than discarded. The prior bad pixel methodology would have treated the cold and unstable pixels as nominally 'good'; such pixels are now flagged and provided in the bad pixel tables for users to choose whether or not to use them. More information about the UVIS pixel stability and bad pixel tables is outlined in WFC3 ISR 2018-15 and WFC3 ISR 2021-14.
Figure 5.3: The number of pixels, as a percentage of the detector, in each of the categories for each anneal cycle from the November 2012 anneal cycle through the December 2018 anneal. Figure is from WFC3 ISR 2018-15.
-
WFC3 Data Handbook
- • Acknowledgments
- • What's New in This Revision
- Preface
- Chapter 1: WFC3 Instruments
- Chapter 2: WFC3 Data Structure
- Chapter 3: WFC3 Data Calibration
- Chapter 4: WFC3 Images: Distortion Correction and AstroDrizzle
- Chapter 5: WFC3 UVIS Sources of Error
- Chapter 6: WFC3 UVIS Charge Transfer Efficiency - CTE
-
Chapter 7: WFC3 IR Sources of Error
- • 7.1 WFC3 IR Error Source Overview
- • 7.2 Gain
- • 7.3 WFC3 IR Bias Correction
- • 7.4 WFC3 Dark Current and Banding
- • 7.5 Blobs
- • 7.6 Detector Nonlinearity Issues
- • 7.7 Count Rate Non-Linearity
- • 7.8 IR Flat Fields
- • 7.9 Pixel Defects and Bad Imaging Regions
- • 7.10 Time-Variable Background
- • 7.11 IR Photometry Errors
- • 7.12 References
- Chapter 8: Persistence in WFC3 IR
- Chapter 9: WFC3 Data Analysis
- Chapter 10: WFC3 Spatial Scan Data


