7.8 IR Flat Fields
Standard calwf3 processing allows for up to three types of flat field reference files for calibration: 1) a P-flat, which corrects for high-frequency 'pixel-to-pixel' variations in the spatial sensitivity as a function of bandpass, 2) a delta-correction or D-flat which accounts for any 'pixel-to-pixel' changes in the P-flat with time, and 3) a low-frequency L-flat which provides a smooth correction to the P-flat. When two or more types of flats are provided, they are multiplied together by calwf3 to form a combined flat field image.
Prior to 2020, only P-flats were used in the calwf3 pipeline for IR images. These flats were first acquired in 2008 during ground testing (see Section 7.8.1), and then updated in 2010 using sky flats to derive a smooth, in-flight correction to the ground flats (see Section 7.8.2). In 2020, new sky flats were computed in using over 10 years of on-orbit imaging. For six filters (F098M, F105W, F110W, F125W, F140W, and F160W), the sky flats have sufficient signal-to-noise to fully replace the ground-based solutions. For the remaining nine IR imaging filters, new P-flats were computed by multiplying each ground flat by an interpolated in-flight correction based on sensitivity residuals from sky flats at similar wavelengths (see Section 7.8.3; WFC3 ISR 2021-01). At the same time, new delta-flats were computed for six filters to correct for low-sensitivity artifacts known as 'blobs' appearing in the IR observations over time (WFC3 ISR 2021-10). A detailed description of IR blobs is provided in Section 7.5 and a discussion of the new delta-flats in Section 7.8.4.
Because of the effect of geometric distortion, the area of the sky seen by a given detector pixel is not constant; therefore, observations of a constant surface brightness object will have count rates per pixel that vary over the detector, even if every pixel has the same sensitivity. In order to produce images that appear uniform for a uniform illumination, the flat fields for both UVIS and IR include the effect of the variable pixel area across the field. A consequence of dividing by the flat fields is that two stars of equal brightness positioned on different regions of the detector will not have the same count rate after the flat fielding step. Thus, point source photometry extracted from calibrated FLT (*flt.fits) images must be multiplied by an effective pixel area map, as described in Section 9.1.1. Alternatively, this correction is accounted for by AstroDrizzle, which uses the geometric distortion solution to correct all pixels to equal areas, i.e. for drizzled DRZ (*drz.fits) images, photometry is correct for both point and extended sources at any position on the detector.
7.8.1 Ground Flats
During the spring of 2008, flat field images for the IR channel were produced in the laboratory during the third and final thermal vacuum campaign (TV3) using the CASTLE Optical Stimulus (OS) system (WFC3 ISR 2008-28). The CASTLE is an HST simulator designed to deliver an OTA-like external beam to WFC3. It can provide either point-source or flat-field illumination in either monochromatic or broadband mode. Flat fields with the OS tungsten lamp were taken with the detector at its nominal operating temperature. These were acquired using the SPARS10 sample sequence, with varying numbers of readouts (samples) per exposure, chosen to obtain a signal of about 60,000 electrons per pixel in the final read. Four exposures were obtained per filter, providing a mean signal-to-noise ratio of ~500, yielding flat field corrections accurate to ~0.2%.
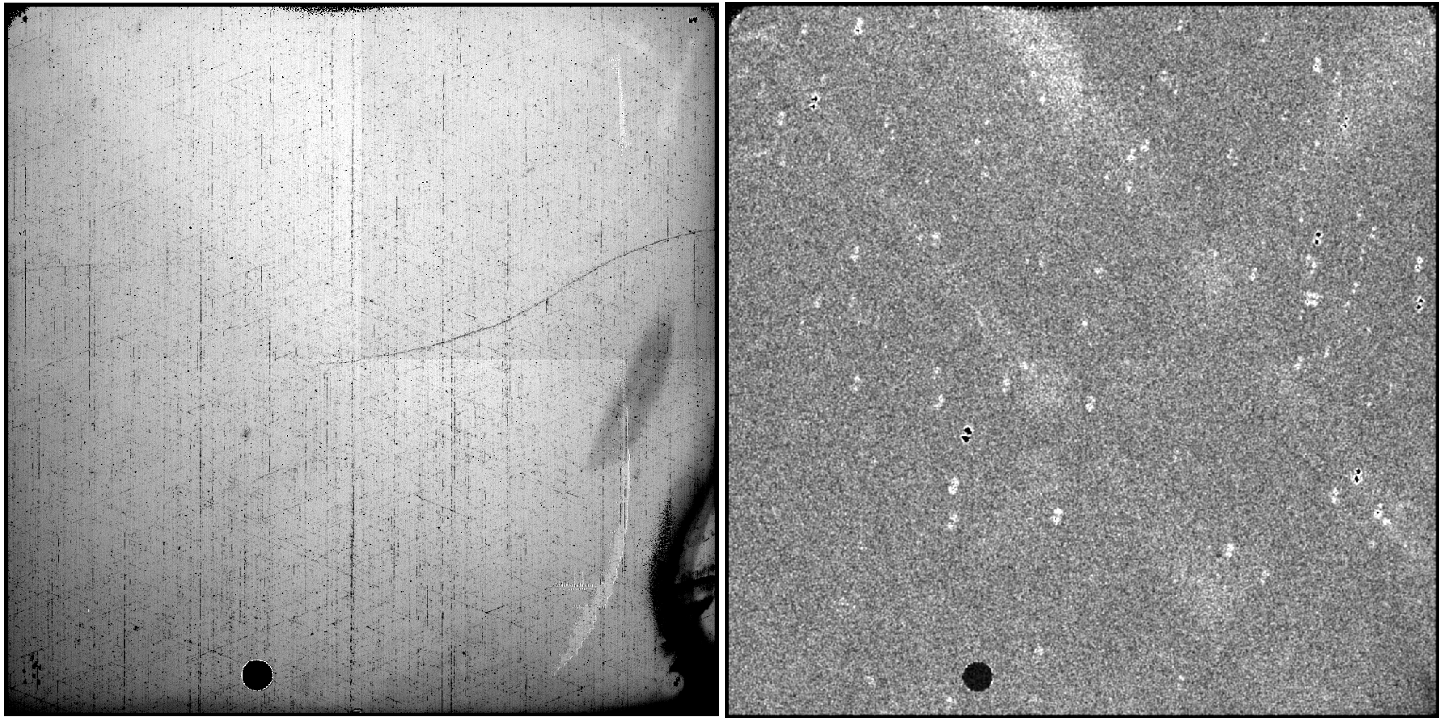
Figure 7.7 shows the science and error array of the F125W flat field acquired in TV3. A faint, extended cross-pattern in the flats is an artifact of the optical stimulus support structure and would therefore need to be corrected using inflight data. Additionally, the blob positions were expected to shift once an on-orbit optical alignment was performed. While blobs are not visually apparent in the flat field science arrays, they are easily identifiable in the error arrays due to a realignment which was performed midway through the IR ground flat calibration. As a result, a single blob appears in two slightly offset positions with √2 larger errors than the surrounding regions of the P-flat. Similarly, the cross-pattern appears in the flat field error arrays at two unique positions.
To test the large-scale uniformity of the detector response as provided by the ground flat calibration, dithered observations of the globular cluster Omega Centauri were acquired during Servicing Mission Orbital Verification, just after WFC3 was installed on HST (program 11453). By placing the same group of stars on different regions of the detector and measuring relative changes in brightness, low-frequency spatial variations in the response of the detector were measured, with average photometric errors of ±1.5% attributed to differences between the CASTLE OS and the inflight illumination (WFC3 ISR 2009-39).
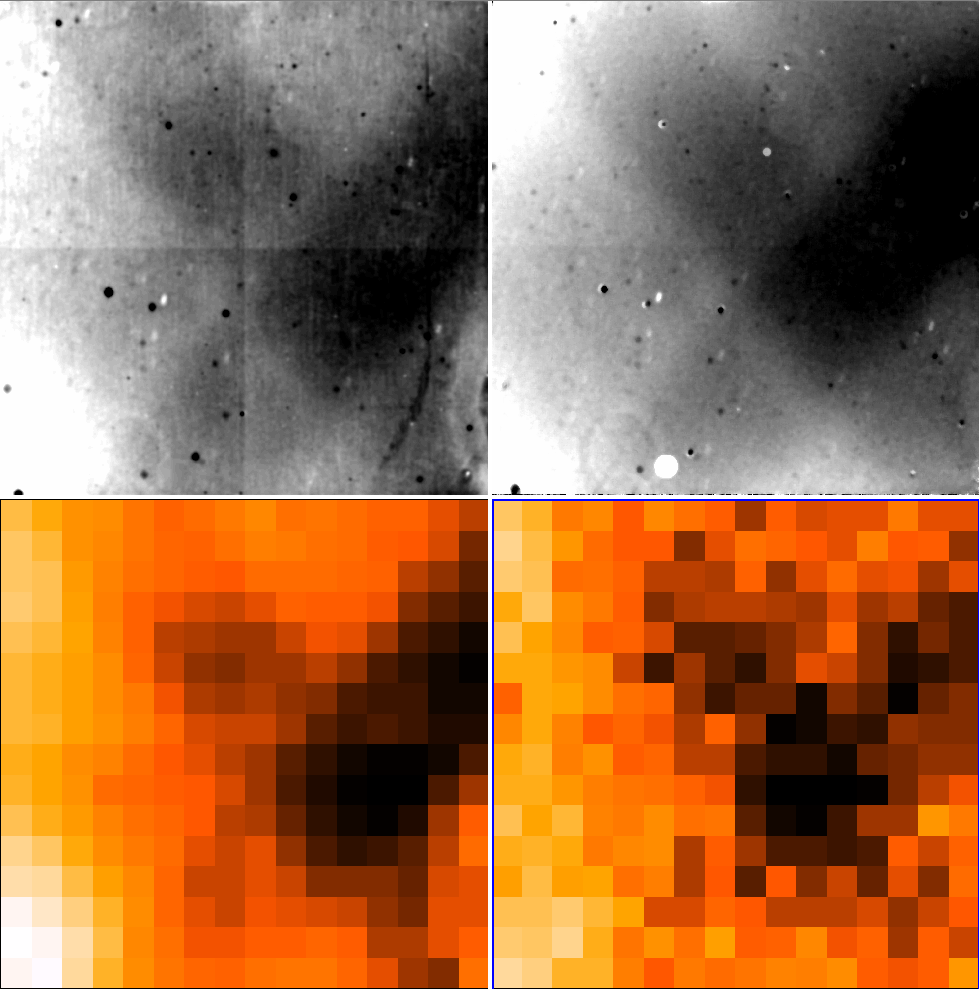
Omega Centauri was revisited in Cycles 17 and 18 (2009-2011, programs 11928 and 12340) at additional dither positions and orientation angles. Local variations in the detector response were computed using the same software used to derive the ACS inflight correction (ACS ISR 2003-10). For application to WFC3, the IR detector was divided into a 16 × 16 grid and a unique solution was computed for each grid point, representing the deviations from unity. L-flat corrections were derived for five filters (F098M, F110W, F125W, F139M, and F160W) and showed rms variations of ~1.1% and peak-to-peak residuals of ±2.5%. The inflight sensitivity residual for the F160W filter is shown in the lower-right panel of Figure 7.8 and highlights the cross-pattern seen in the ground flats. Due to the relatively small number of stars in the calibration field, these low-order corrections were insufficient to correct for the complex spatial residuals. Instead, deep images of sparse astronomical targets were used to produce sky flats in order to correct for differences in the inflight sensitivity, as described in the next section.
7.8.2 On-orbit Corrections
Combining IR external imaging data acquired between September 2009 and December 2010, sky flats were used to compute the required correction to the ground flats (WFC3 ISR 2011-11). In short, all science observations taken with the F098M, F105W, F110W, F125W, F140W, and F160W filters with exposure times exceeding 300s were calibrated using the ground flats and then combined in each filter, after masking out objects. This produced a high-quality sky image for the F160W filter, and somewhat noisier sky images for F098M and F125W. For the remaining three filters, an insufficient number of input science frames were available to derive sky images with adequate signal-to-noise. Comparing the resulting sky image between filters, no clear indication of any color dependence of the low-frequency structure was found thus, a 'gray' sky image was constructed using all available data. The top left panel of Figure 7.8 shows the gray correction, which is similar in structure to the L-flat derived from stellar observations (bottom right).
Similar differences between the CASTLE optical stimulus and inflight illumination patterns were also apparent from calibration observations of the moonlit Earth limb (program 11917). One of those Earth flats, acquired with the F105W filter and flat fielded with the ground flat reference file, is shown in the top right panel of Figure 7.8. Both the shape and the amplitude of the low-frequency residuals are very similar to the image derived from sky observations. To compare the sky image with the photometric residuals from Omega Centauri, the sky image was binned to the same 16 × 16 grid. The bottom left panel of Figure 7.8 shows the 16 x 16 sky image grid for comparison with the bottom right panel which shows the F160W stellar L-flat. Similar low frequency structures are present in both images, i.e. the results are consistent, albeit with lower signal-to-noise in the stellar L-flat.
In December 2010, the ground flat reference files ('s*pfl.fits') were replaced with an updated set of P-flats ('u*pfl.fits'). These were constructed by multiplying the ground flats with the gray sky image, rather than generating separate L-flat reference files. The gray correction was smoothed to reduce noise, causing the blobs to be slightly larger and reduced in strength. As done for the ground flats, each new P-flat was normalized to 1.0 over the image section [101:900,101:900], which excludes areas of the detector known to contain anomalies such as the "Death Star" and the "Wagon Wheel” (see Section 7.9.2). After recalibrating the Omega Centauri observations with the new P-flats, the photometric accuracy was found to be ~0.5% (with peak-to-peak variations of -1.5 to +1.6%) when avoiding the outermost 128 pixels of the edge of the detector. Within the “Wagon-Wheel” region and the edge of the detector, the photometric uncertainties increased to ~0.8% (with peak to peak variations of -2.0 to +1.9%).
7.8.3 Filter-Dependent Sky Flats
Sky flats were computed from a large set of in-flight science observations acquired over more than 10 years of on-orbit data. Delivered to the Calibration Database Reference System (CRDS) in October 2020, these new P-flat reference files ('4*pfl.fits') correct for wavelength-dependent sensitivity residuals of ±0.5% in the central 800x800 pixel region of the detector and up to 2% near the detector edges, depending on filter (WFC3 ISR 2021-01).
For the six most commonly used filters (F098M, F105W, F110W, F125W, F140W, and F160W), the combined sky image is now deep enough, with errors less than or equal to 0.2%, to fully replace the ground flat reference files. The new P-flats improve the 'pixel-to-pixel' sensitivity calibration and correct for differences in the IR gain across the four amplifiers. Unlike the 2010 solutions, the P-flats no longer include the blobs, which are now corrected for by a separate set of D-flat reference files (see next Section).
For the remaining nine IR imaging filters, wavelength-dependent sensitivity residuals from the six most frequently used filters were used to correct the P-flats acquired on the ground. An L-flat correction image for each filter was derived by interpolating the pixel values of the flat field residual images (sky flat divided by ground flat) from the two filters closest in wavelength. These residuals were smoothed to avoid degrading the filter-dependent pixel-to-pixel sensitivity and were then multiplied by the original ground flat.
To check the stability of the IR detector sensitivity, spatial-scanning photometric observations of a sparse region of M35 were acquired over a ~6 year baseline (WFC3 ISR 2021-05). To avoid the effects of image persistence, the target was dithered by large offsets to place the stars at multiple, 'clean' (no prior illumination) positions across the central 512x512 subarray. The photometry of each star shows an intrinsic scatter of order 0.5%, suggesting either residual errors in the flat field, subtle effects due to the scanning mode, and/or systematic effects related to the detector illumination history. For more details on IR photometry errors, see Section 7.11.
7.8.4 Blob Flats
A new set of delta-flats (D-flats), delivered together with the new P-flats in October 2020, now correct for ‘blobs’ in the six most frequently used filters (WFC3 ISR 2021-10). The blob delta-flats were computed by stacking archival sky flat images after the appearance of each blob. Conversely, P-flats in blob-affected regions are computed by stacking images prior to each blob's appearance. D-flats with statistical errors < 1% are available for 148 (of 152 total) blobs, and flats for the most recent and newer blobs will be delivered as and when more inflight data are available. For a current status of blob monitoring and catalog, see WFC3 ISR 2018-06.
The new D-flat reference files ('4*dfl.fits') are intended to be used in combination with the most recent P-flats described in Section 7.8.3. While there is only one set of P-flats (one for each of the 15 imaging filters), D-flats are available only for six filters at 49 unique blob appearance dates. The appropriate D-flat is selected according to the USEAFTER keyword in the flat field header corresponding to the observation date (DATE-OBS) keyword in the header of the raw image. During pipeline processing, calwf3 multiplies the P-flat and the D-flat reference files together to form a combined flat field image. D-flat values are set to 1.0 everywhere except in the blob regions which contain a high-frequency correction to the P-flat. Since blobs do not change position (aside from the occasional <1 pixel shifts discussed at the end of Section 7.5), the D-flat for an individual blob does not change over time, and new blobs are simply added to the previous D-flat and assigned an updated USEAFTER date. Previously, only the strongest set of blobs were assigned a DQ flag (value=512, 'bad in flat') via the IR bad pixel tables. Now, the D-flats provide DQ flags for all cataloged blobs, regardless of their strength, increasing the total number of flagged flat field pixels from 1.1% to 2.3% in the DQ array of calibrated WFC3/IR (*flt.fits) images.
For blobs appearing in ground test data or in early inflight science images, sky flats will have little to no signal in the affected pixels. We therefore replaced their pixel values in the P-flats with the median P-flat value in a 20-pixel wide circular annulus surrounding each blob. For the early set of blobs (those present by September 2009), there are insufficient number of external images from which to compute a pixel-to-pixel flat, so the delta-flat includes a combination of the blob and the P-flat. While these blobs affect all inflight data, they were not included in the P-flats in order to make those reference files more useful for grism calibrations. A model of the multi-component dispersed IR sky background in G102 and G141 is described WFC3 ISR 2020-04. Blobs appear in the Zodiacal light component as elongated shapes, similar to those of normal dispersed spectra but with lower signal due to their reduced sensitivity. Blobs are also apparent in the Helium I airglow component although offset from their nominal positions in imaging data due to the grism's dispersion.
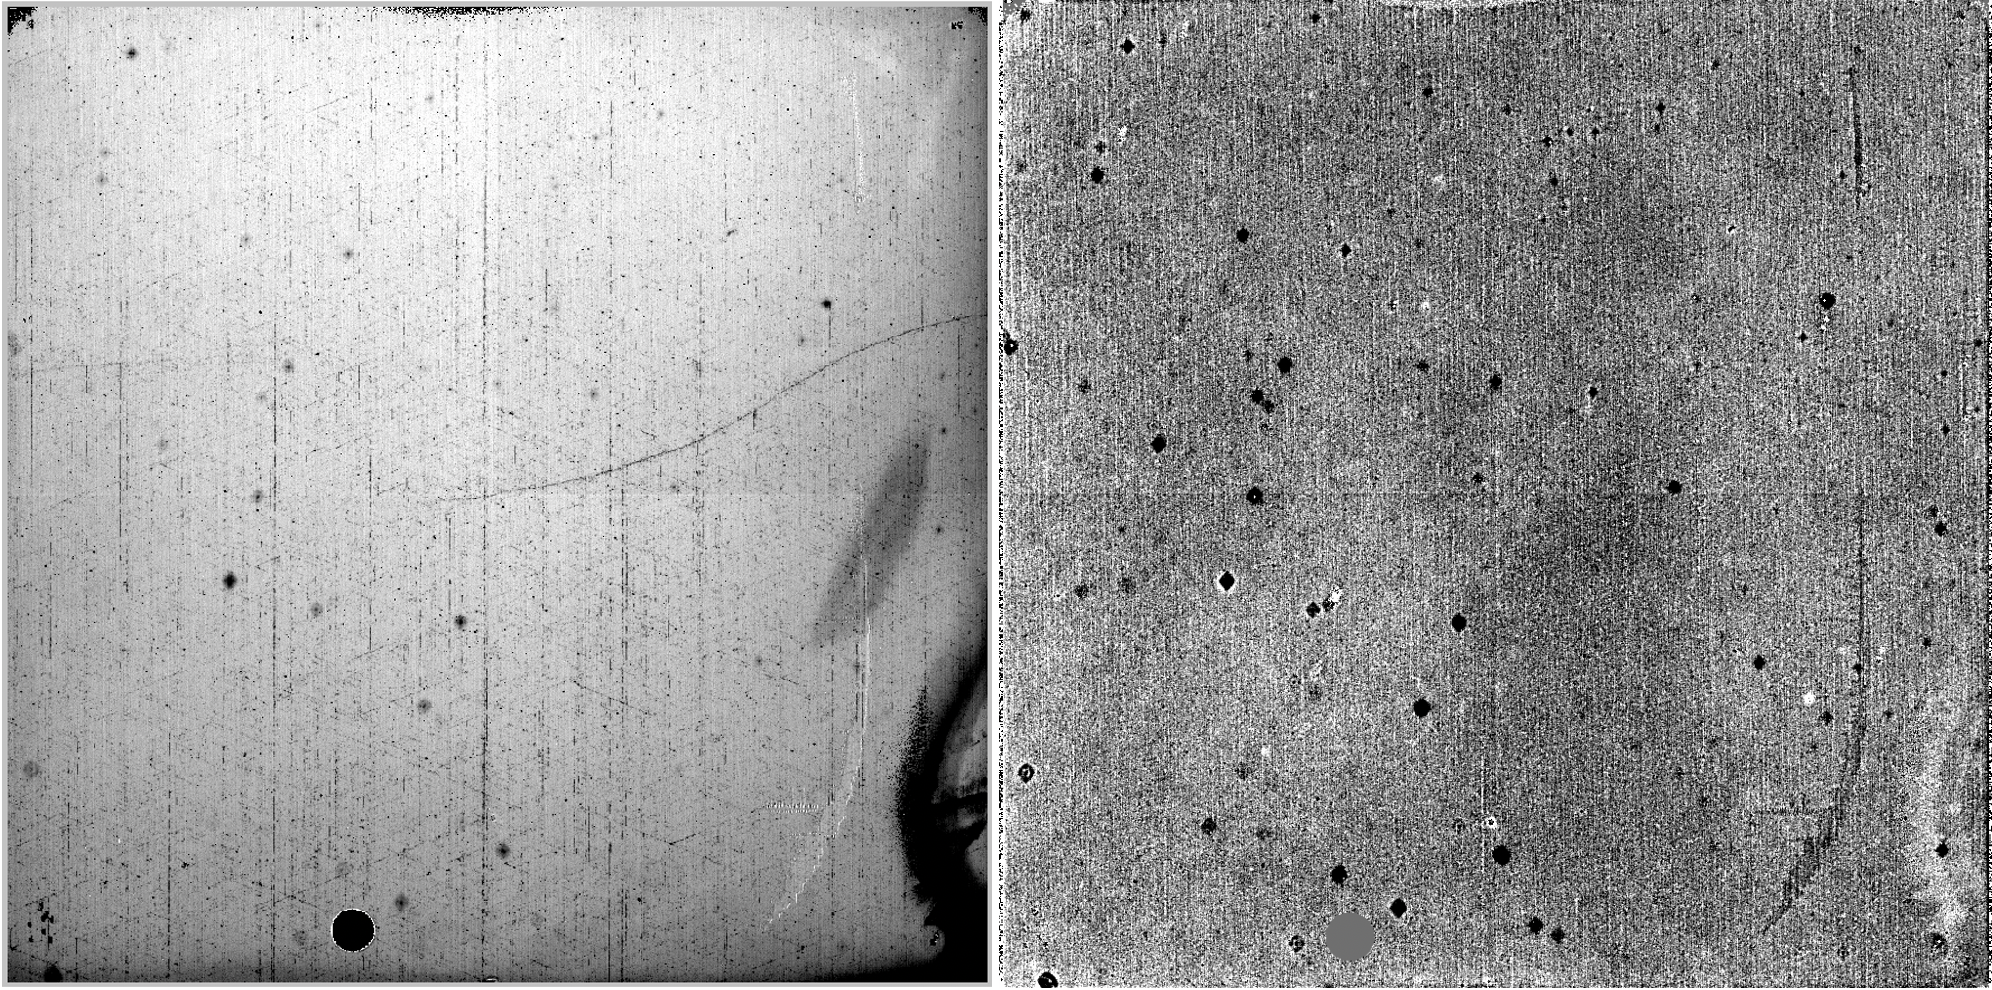
The left panel of Figure 7.9 shows the product of the F125W P-flat and D-flat for 148 blobs appearing through July 2018. The right panel shows the F125W filter-dependent residual with respect to the 2010 'gray' inflight correction, which was heavily weighted toward the F160W filter as that had the most inflight images from which to form a sky flat. The residuals are similar in both shape and amplitude to those in Figure 2 of WFC3 ISR 2011-11 which shows the ratio of the F125W and F160W sky flat computed from early inflight data.
Figure 7.9: Left: Combined F125W flat field, computed as the product of the P-flat and D-flat (4ac1921ii_pfl.fits and 4ac1825si_dfl.fits, respectively) which corrects for blobs appearing through July 2018, shown with a stretch from 0.8 to 1.1. The large cross-pattern visible in the left panel of Figure 7.7 (an artifact of the optical stimulus used in ground testing) is now removed.
Right: Ratio of the combined F125W flat field (P-flat times D-flat) and the 2010 P-flat (uc72113qi_pfl.fits), shown with a stretch from 0.98 to 1.02. Filter-dependent residuals are present at ~0.5% in the center of the detector and ~1% in the "Wagon wheel" feature in the lower right corner. Blobs arising inflight after 2010 appear as dark residuals, while blobs included in the 2010 P-flat appear as dark residuals encircled with a white ring (the result of smoothing in the early in-flight correction).
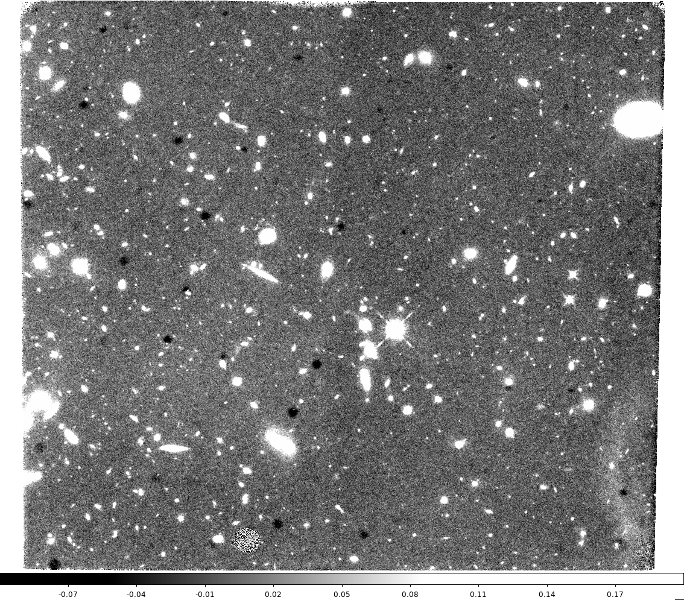
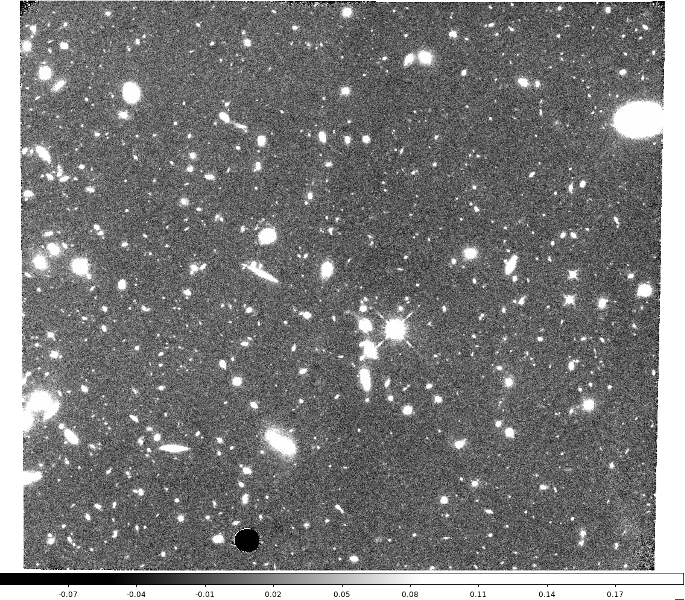
A sample drizzled product from MAST is shown in Figure 7.10, comprised of four FLT images in the F140W filter. The drizzled image has a combined exposure time of ~5200 seconds and a total background of ~10,000 electrons. The top panel shows the drizzle-combined image (ibkdf2010_drz.fits) from FLT images calibrated with the 2010 flats. Residuals in the sky background are similar to the wavelength-dependent structure seen in the right panel of Figure 7.9. The drizzle-combined image from FLT images calibrated with the new (2020) P-flat and D-flat reference files is shown in the bottom panel in Figure 7.10. The large-scale uniformity of the background is significantly improved and regions of the detector impacted by blobs appear visually clean.
For precise photometry in regions affected by blobs, observers planning WFC3 IR programs should consider utilizing a 'blob' dither in the Phase II proposal implementation (e.g. PATTERN= ‘WFC3-IR-DITHER-BLOB’, see also WFC Instrument Handbook) in order to permit the cleaning of blobs from drizzle-combined images. Calibrated FLT images can be reprocessed with AstroDrizzle, rejecting any pixels flagged with a value of 512 in the DQ array, and 'filling in' with clean regions of the sky from the associated dithered exposures. For more detail on blob correction strategies, see Section 7.5.3.
-
WFC3 Data Handbook
- • Acknowledgments
- • What's New in This Revision
- Preface
- Chapter 1: WFC3 Instruments
- Chapter 2: WFC3 Data Structure
- Chapter 3: WFC3 Data Calibration
- Chapter 4: WFC3 Images: Distortion Correction and AstroDrizzle
- Chapter 5: WFC3 UVIS Sources of Error
- Chapter 6: WFC3 UVIS Charge Transfer Efficiency - CTE
-
Chapter 7: WFC3 IR Sources of Error
- • 7.1 WFC3 IR Error Source Overview
- • 7.2 Gain
- • 7.3 WFC3 IR Bias Correction
- • 7.4 WFC3 Dark Current and Banding
- • 7.5 Blobs
- • 7.6 Detector Nonlinearity Issues
- • 7.7 Count Rate Non-Linearity
- • 7.8 IR Flat Fields
- • 7.9 Pixel Defects and Bad Imaging Regions
- • 7.10 Time-Variable Background
- • 7.11 IR Photometry Errors
- • 7.12 References
- Chapter 8: Persistence in WFC3 IR
- Chapter 9: WFC3 Data Analysis
- Chapter 10: WFC3 Spatial Scan Data
