5.4 UVIS Flat Fields
The UVIS flat fields provide a 2-D spatial map of the detector response and represent the combined throughput of multiple components along the optical path. The flat fields include both a high spatial frequency component that accounts for variations in the pixel-to-pixel response (P-flat) and a low spatial frequency component (L-flat) that corrects for large-scale modulations across the detector and as such are often referred to as LP-Flats.
The flat field reference files in use during WFC3’s commissioning in 2009 (t*_pfl.fits) were derived from ground test data (WFC3 ISR 2008-46), and these flats were found to contain a large internal window reflection affecting ~45% of the detector field of view at a level of 1-2%. A simplified geometric model was used to remove this feature from the ground flats.
Because of geometric distortion, the area of the sky seen by a given pixel is not constant; therefore, observations of a uniform surface brightness object will have count rates per pixel that vary over the detector, even if every pixel has the same sensitivity. In order to produce images that appear uniform for uniform illumination, the flat fields include the effect of the variable pixel area across the field. A consequence of dividing by these flat fields is that two stars of equal brightness falling on different portions of the detector will not have the same total counts in a calibrated (*_flt.fits, *flc.fits) image. To correct for this effect, point source photometry extracted from flat-fielded images should be multiplied by the effective pixel area map (see Section 9.1.11). Alternatively, this correction is accounted for in the pipeline by AstroDrizzle (see Section 4.2), where the distortion reference files are used to correct all pixels to equal area on the sky for drizzled (*_drz.fits, *drc.fits) data products.
Because of geometric distortion, the area of the sky seen by a given pixel is not constant; therefore, observations of a uniform surface brightness object will have count rates per pixel that vary over the detector, even if every pixel has the same sensitivity. In order to produce images that appear uniform for uniform illumination, the flat fields include the effect of the variable pixel area across the field.
Corrections for additional low-frequency components, due to differences between the ground and inflight optical paths, were computed from on-orbit photometry of bright stars in Omega Centauri dithered across many positions on the detector (WFC3 ISR 2013-10). In-flight solutions (v*_pfl.fits) were delivered on December 14, 2011 for the 42 full-frame filters (excluding the QUAD filters, which currently still use the ground flats). Flats for 2 × 2 and 3 × 3 binned modes (w*pfl.fits) were delivered on August 29, 2012 (WFC3 TIR 2012-04).
Finally, to support the UVIS chip-dependent photometric calibration (WFC3 ISR 2016-03), an updated set of flat fields (z*pfl.fits) were delivered on February 23, 2016. These include revised L-flat corrections based on CTE-corrected Omega Centauri photometry and a temperature-dependent correction for the UV filters. The photometric repeatability of white dwarf standards placed at different areas (or stepped) across the detector field of view is now better than 1% r.m.s. and 3% peak-to-peak over the full wavelength range of the detector (WFC3 ISR 2016-04, WFC3 ISR 2016-05).
The following three sections describe in more detail the development and processing which has gone into generating the UVIS flatfields currently in use in the MAST automated calibration pipeline.
5.4.1 Ground Flats
In the spring of 2008, flat fields for the UVIS channel were produced at the Goddard Space Flight Center during the third and final thermal vacuum campaign (TV3) using the CASTLE Optical Stimulus (OS). CASTLE (Calibration Stimulus from Leftover Equipment) is an HST simulator capable of delivering OTA-like, external, monochromatic point source and broadband full field illumination. Flats were acquired in only the standard CCD readout configuration of four amplifiers (ABCD), gain=1.5 and binning=1 × 1. Flat fields with the OS Xenon and Halogen lamps were taken with the detector at its nominal operating temperature of -82°C. Flats for the ultraviolet (UV) filters were acquired at a warmer detector temperature (-49°C) using the deuterium lamp to achieve higher count rates.
With a total signal of at least 75,000 electrons, the UVIS ground flats achieve an r.m.s. error better than 0.4% per pixel. The flats were normalized by the median value in a 100 × 100 pixel region in UVIS1 amplifier A, coordinates [1032:1133,328:429]. This region was selected to avoid the small dark rings ("droplets") that are spread across the UVIS field of view. The droplets are likely mineral residue on the outer window of the flight detector caused by a condensation event that occurred before TV3 (WFC3 ISR 2008-10). About one-third of these droplets moved in a coherent way during launch (WFC3 ISR 2009-27).
Unlike the ACS/WFC detector, the two UVIS chips were not cut from the same silicon wafer and should be considered as two independent detectors. For the 42 full-frame filters, the UVIS2 flats were divided by the UVIS1 normalization value in order to preserve the overall sensitivity difference between chips. In this way, calibrated flat-fielded (*_flt.fits, *flc.fits) or drizzled (*_drz.fits, *drc.fits) data products only required the use of a single zeropoint value for each filter. For the QUAD filters, on the other hand, each quadrant was normalized using a 100 × 100 pixel box in the corresponding amplifier, and therefore each carries its own unique zeropoint.
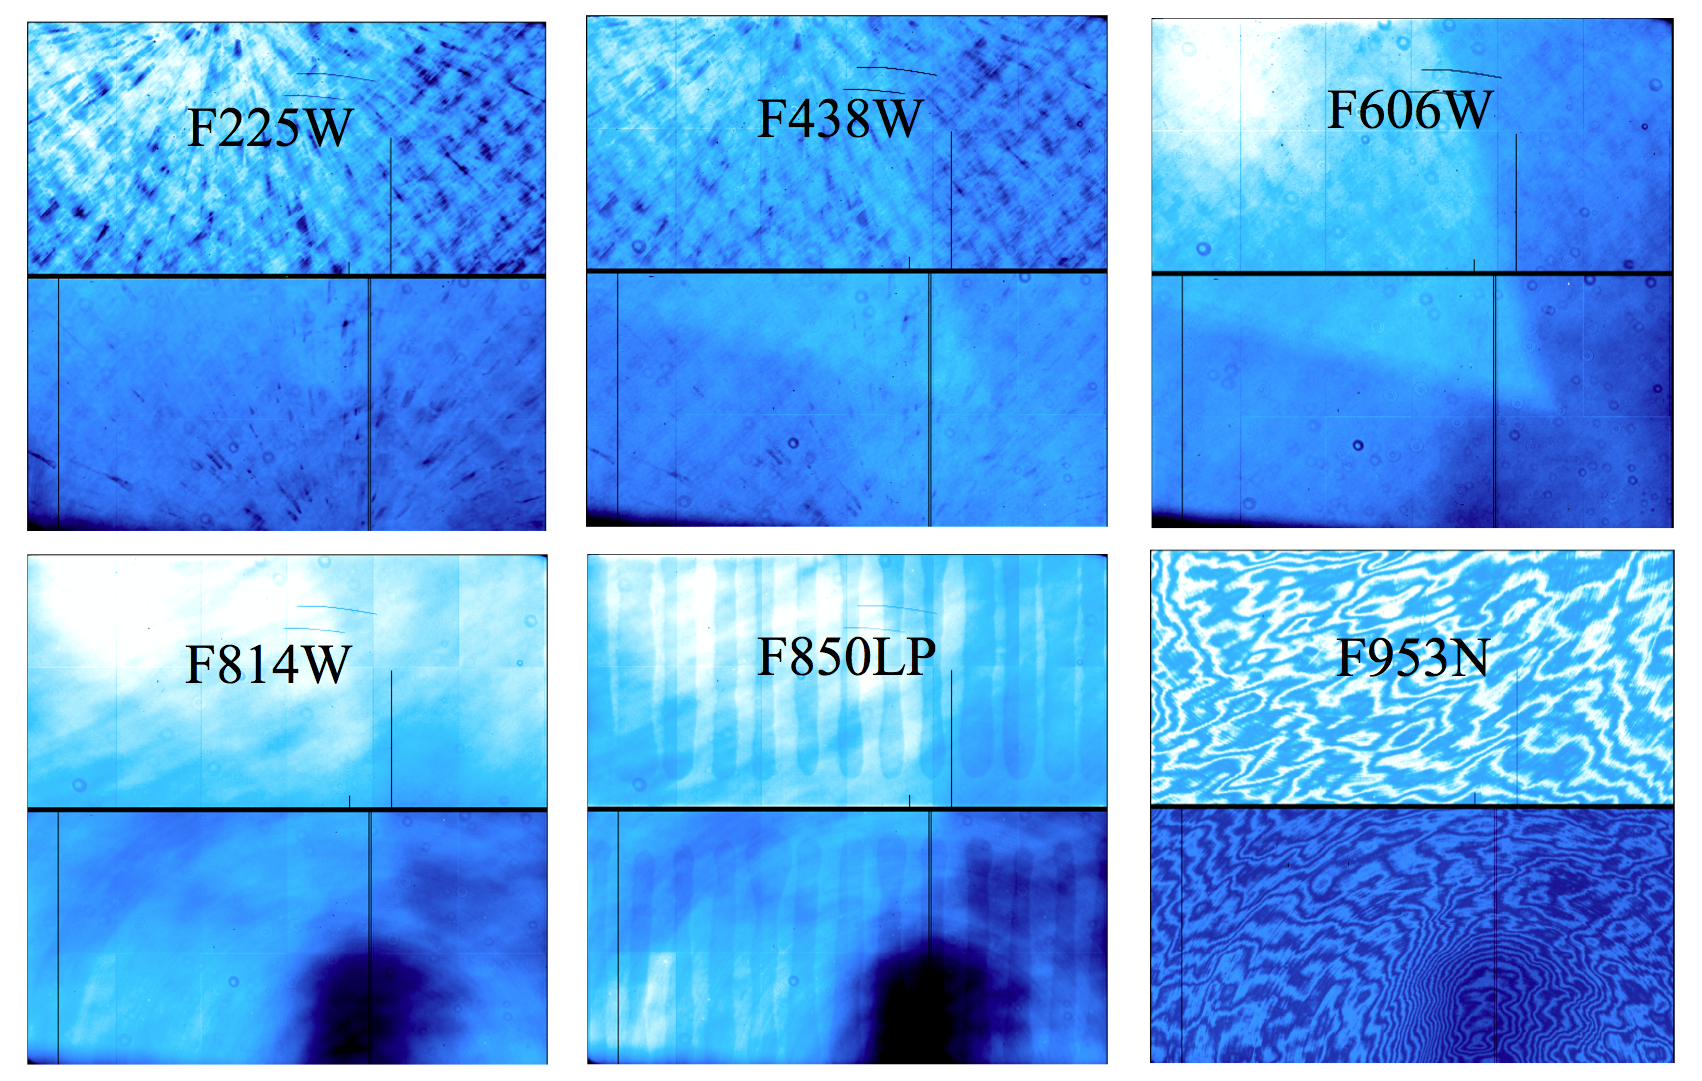
A subsample of ground test UVIS flat fields are shown in Figure 5.4. A complete set may be found in the ‘UVIS CASTLE Photometric Filter Flat-Field Atlas’ (WFC3 ISR 2008-46). On-orbit corrections to the flat fields are described in the next two sections.
5.4.2 On-orbit Corrections
Due to differences in the optical path, flat fields acquired inflight were expected to differ from those obtained during ground testing, since neither the laboratory flat-field illumination nor the on-orbit internal lamp flats provides an accurate simulation of the OTA. Corrections to the spatial response were characterized by observing dense star clusters with multiple telescope orientations and large dithered steps across the detector (WFC3 ISR 2009-06). Placing the same stars over different portions of the detector and measuring relative changes in brightness, local variations in the response (L-flats) were computed.
Initial on-orbit data confirmed that the ground flats did not fully correct low- and mid-frequency structure, and SMOV calibration program 11452 (UVIS Flat-Field Uniformity) showed differences of ~1.5 to 4.5% in a subset of 6 filters based on observations of two galactic globular clusters (see (WFC3 ISR 2009-19). Supplemental observations were obtained in Cycles 17 and 18 (programs 11911 & 12339) in a key set of 10 broadband filters used most frequently by observers: F225W, F275W, F336W, F390W, F438W, F555W, F606W, F775W, F814W, and F850LP.
The same mathematical algorithm for deriving ACS inflight corrections (ACS ISR 2003-10) was used to characterize the accuracy of the UVIS ground flats. Aperture photometry was performed on the cluster data with a radius of 0.2” (5 pixels) to minimize uncertainties due to crowding. Then, a spatially variable aperture correction to 0.4” (10 pixels) was applied to each image to account for variations in the PSF with detector position and telescope focus, including temporal effects such as breathing and long term focus drifts (WFC3 ISR 2013-11). Because of spatial and temporal variability in the UVIS encircled energy, the aperture corrections for radii smaller than 0.4” (10 pixels) are most accurate when computed directly from bright stars in each image.
The first set of L-flat corrections showed evidence of an extended wedge-shaped artifact in the ground flats (see Figure 5.5 where the wedge is most prominent in the F606W flat). This same feature was noticed in on-orbit flats obtained by observing the dark side of the Earth during periods of full moon illumination (programs 11914 and 12709). This extended feature, dubbed the UVIS 'flare', is a result of the tilted UVIS focal plane, where light is reflected multiple times between the detector and the two chamber windows. When a point source is positioned in the lower right quadrant of the UVIS detector, out of focus reflections between the CCD and the two windows appear along a diagonal from the source towards the upper left (see Section 5.5.1). When the detector is illuminated by a uniform surface brightness source, the summation of defocused ellipses creates the wedge shaped ‘flare’ apparent in both the ground flats and the on-orbit Earth flats. The L-flat residuals showed a negative imprint of the flare, implying that it is not a true feature of the L-flat, but instead an internal reflection in the ground flat which is imprinted on the Omega Centauri images during the flat fielding process.
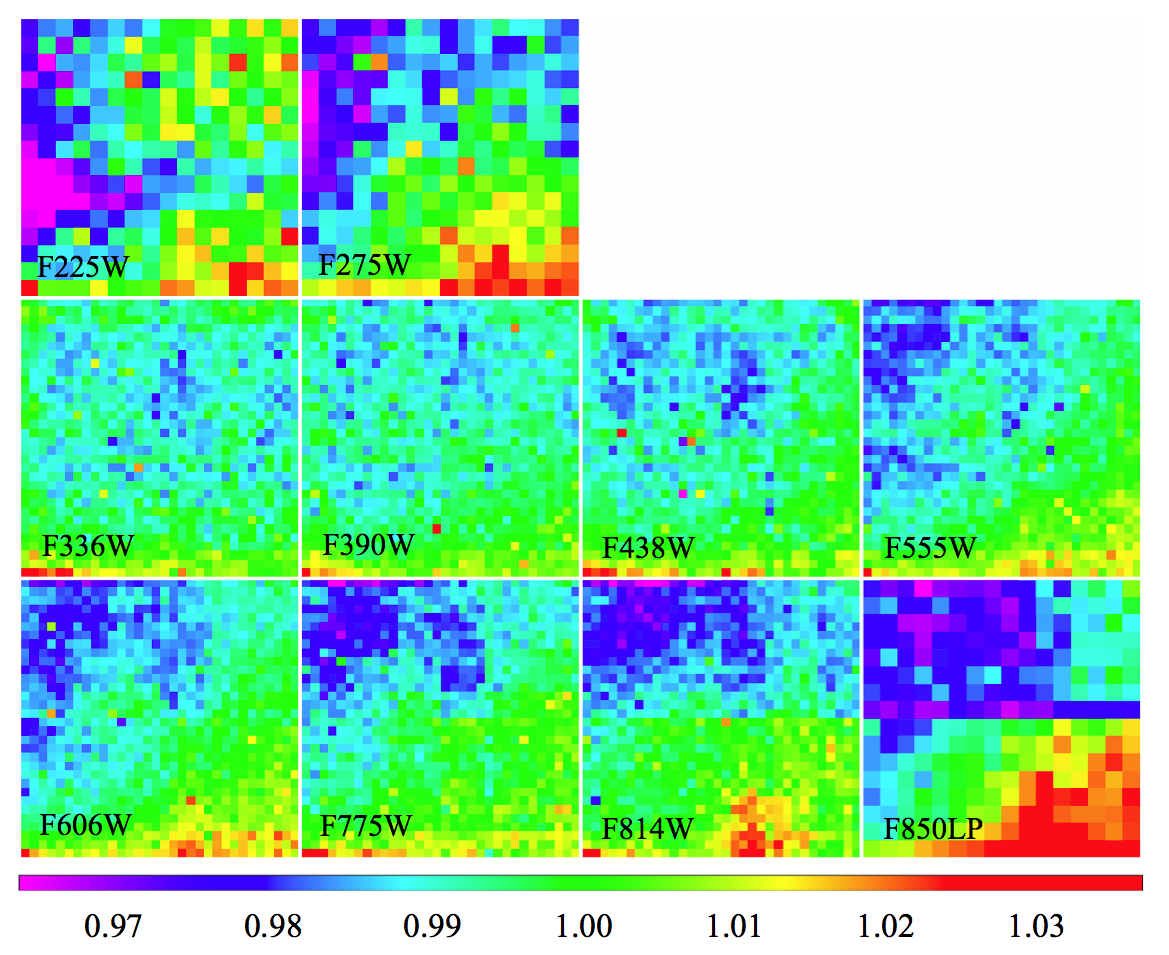
A geometric model (WFC3 ISR 2011-16) was used to predict the shape and extent of the flare and the relative strength of the four internal reflections with respect to the primary source (see Figure 5.5). The absolute strength of the flare as a function of wavelength was estimated from the preliminary L-flat solutions, and this was used to scale and divide the model from the ground flats. L-flats were then recomputed from cluster photometry recalibrated with flare-free ground flats. Sensitivity residuals for the 10 broadband filters are shown in Figure 5.6, represented as a chessboard grid of basis functions of order 2n, where the 4th and 5th order solutions result in a 16 × 16 and 32 × 32 pixelated version of the UVIS detector (with each grid pixel representing an independent solution). With the exception of the two bluest UV flats, which were obtained with the detector running warmer than usual during ground testing, the sensitivity residuals show a general wavelength dependence, where the required correction deviates from unity more at longer wavelengths compared to shorter ones.
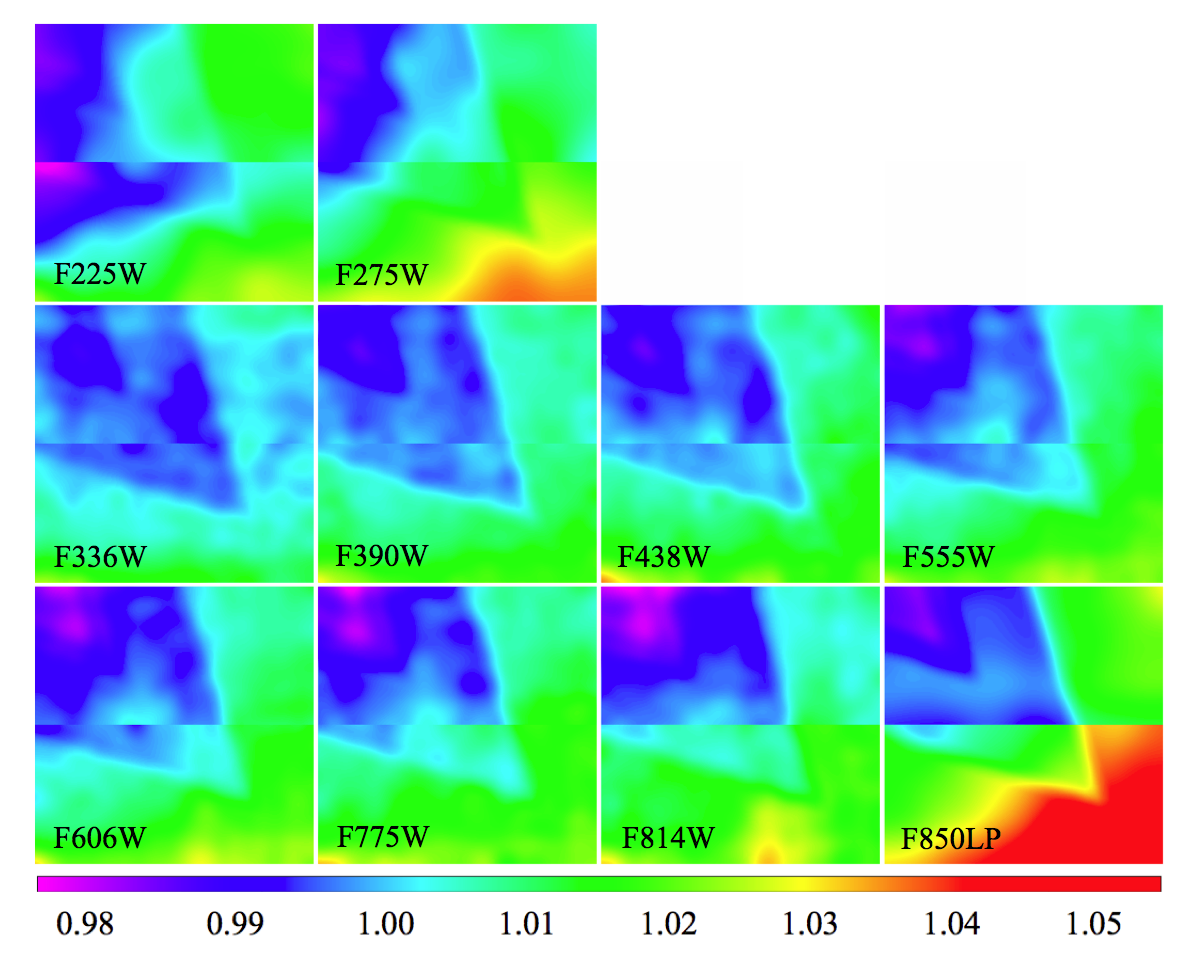
Rather than carry a separate set of L-flat reference files, revised LP-flats were created by multiplying the ground P-flats (flare removed) with smoothed versions of the pixelated L-flat. Figure 5.7 shows the ratio of the improved 2011 pipeline flats with respect to their 2009 solutions for the 10 broadband filters with on-orbit calibration data. The 2011 solutions differ by 0.6 to 1.8% rms, with a maximum change of ~2.8 to 5.5%, depending on filter (WFC3 ISR 2013-10).
For the remaining 32 full-frame filters, flat-field corrections (including both the flare and the stellar L-flat) were computed via interpolation based on the filter pivot wavelength, using the weighted average of the residual flat for the two filters nearest in wavelength. The wavelength dependence of both the flare and the L-flat in Figures 5.6 and 5.7 suggests that interpolation is a valid approximation for filters with no available on-orbit cluster data.
To quantify the accuracy of the new flat fields, white dwarf standards were stepped across the detector field of view to measure their photometric repeatability. For filters with pivot wavelength greater than 300nm, photometry in a 10-pixel aperture was repeatable to better than 0.7% rms and 2.7% peak-to-peak. The flux residuals showed a weak correlation with position (e.g. the number of parallel transfers required for each source during read-out), suggesting that some of the spatial variation was due to CTE losses during readout at a level of 0.5-1.0%. For UV filters, the photometric residuals from stepped data calibrated with the 2011 flats were 1.8% rms and 6.7% peak-to-peak (WFC3 ISR 2015-18).
The 2011 in-flight flats corrected for sensitivity offsets between the two chips using dithered stellar photometry in Omega Centauri, but the average cluster population is significantly redder than the white dwarf used to derive the zeropoints. When dividing the cluster stars into separate populations by their intrinsic color, differential photometry of sources dithered between the chips showed offsets in the measured count rate that correlated with the source’s intrinsic color. For the UV filters, this offset was as large as 5% in F225W for blue versus red populations, though red leaks (Section 6.5.2 of the WFC3 Instrument Handbook) limit the accuracy of this prediction at the 1-2% level.
5.4.3 Chip-Dependent Flats
The quantum efficiencies of the two UVIS chips differ at wavelengths shorter than about 400 nm (see Section 5.4.1 of the WFC3 Instrument Handbook). Motivated by this difference, a chip-dependent approach to the photometric calibration was adopted in February 2016 to better track any changes with time as the two detectors age. Prior to this date, sensitivity offsets between chips were derived from stars in Omega Centauri dithered between UVIS1 and UVIS2, as described in Section 5.4.2, and these were accounted for by calwf3 as part of the flat fielding step (FLATCORR). Photometric keywords such as PHOTFLAM, the inverse sensitivity, were then populated in the image header via the PHOTCORR photometry switch, where a single value of PHOTFLAM applied to both UVIS1 and UVIS2.
In the chip-dependent approach, the L-flats were computed from CTE-corrected star cluster data dithered over a single chip only. The LP-flats were then normalized by the median value of each chip. To ensure that count rate photometry in calibrated data remains continuous across the two chips, calwf3 (starting with version 3.3+) made use of a new calibration switch (FLUXCORR), which multiplies the UVIS2 science extension by the sensitivity ratio (PHTRATIO) of the two chips (see Section 9.1 for details). This ratio is empirically derived from photometry of white dwarf standards measured for UVIS1 and UVIS2 separately as part of the UVIS photometric calibration program (WFC3 ISR 2016-03).
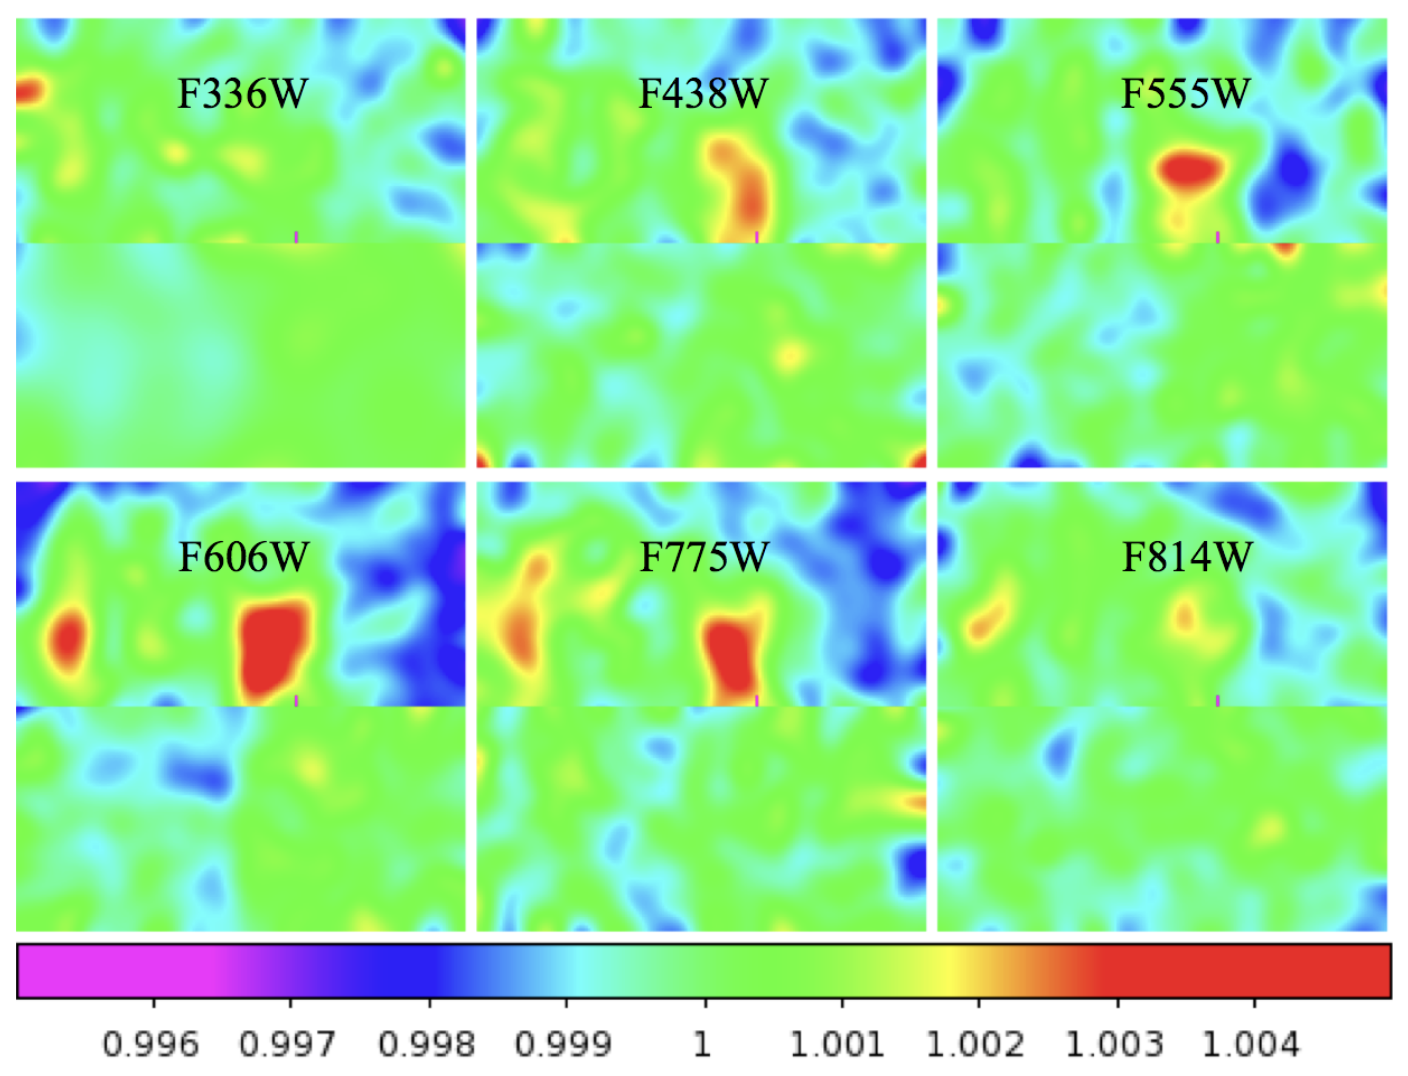
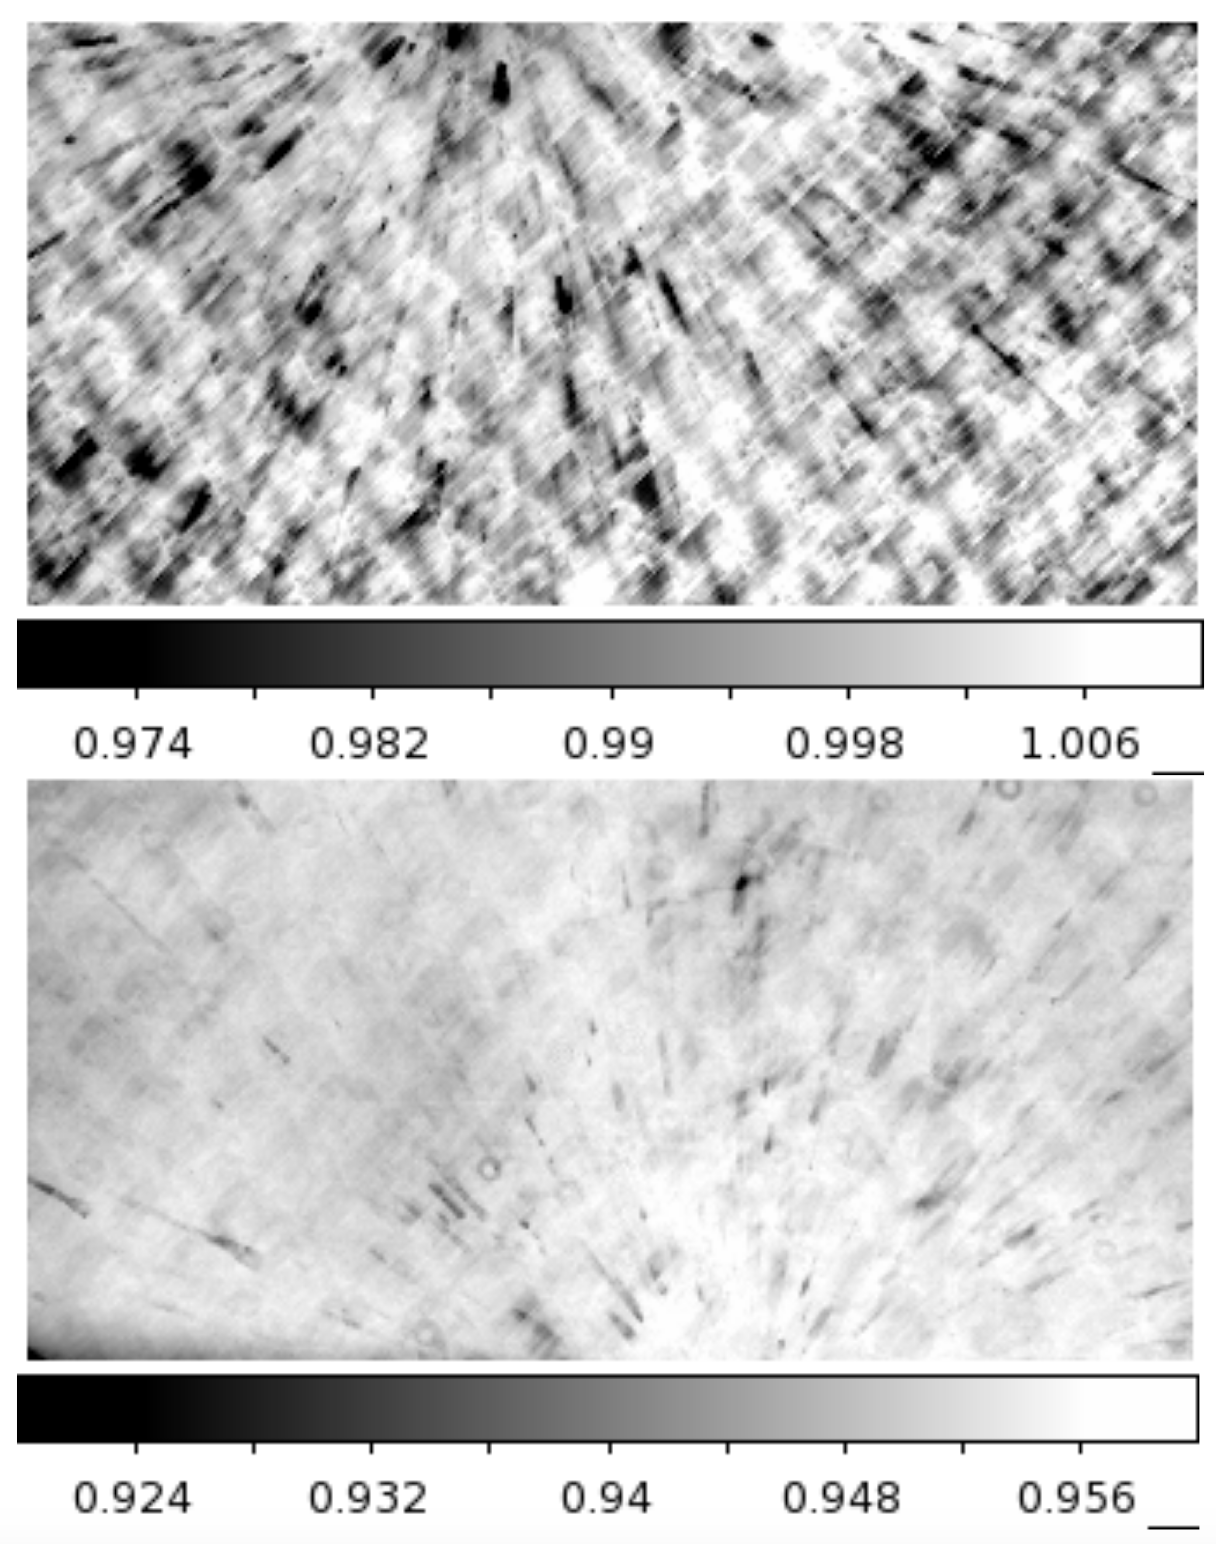
For the majority of filters, the improvement in the chip-dependent flats is small and is primarily attributed to correcting for CTE losses in the star cluster data used to determine the L-flat. Figure 5.8 shows the ratio of the CTE-corrected L-flat to the 2011 L-flat for six broadband filters, where the total correction from the center to the edge of each chip is on average 0.6%.
Flats for the four bluest UVIS filters (F218W, F225W, F275W, F280N) include an additional correction to the spatial response with temperature. Due to ground equipment limitations, these flats were obtained at a warmer detector temperature (−49°C) during ground testing and have now been corrected with in-flight data (acquired at −82°C). White dwarf standard stars stepped across the two chips showed flux residuals which correlate with a crosshatch pattern in the UV flat fields at spatial scales of ~50 – 100 pixels. These data were used to derive a linear correction model which improves the spatial repeatability from ~7% to ~3% peak-to-peak (WFC3 ISR 2016-05). The ratio of the 2016 to 2011 flats for the F275W filter is shown in Figure 5.9, where the crosshatch correction is more pronounced for UVIS1 (top chip).
The UVIS chip-dependent calibration is intended to produce uniform count rates across the two chips for sources similar in color to the white dwarf standards. As discussed in Section 5.4.2, count rate offsets of several percent are found in the UV for red versus blue stars, but these appear to impact only the photometric zeropoints and not the flat fields themselves. Monochromatic flats obtained during ground testing with an optical stimulus at wavelengths 310, 530, 750, and 1250 nm showed no evidence of spatial residuals in the flat ratio with wavelength.
-
WFC3 Data Handbook
- • Acknowledgments
- • What's New in This Revision
- Preface
- Chapter 1: WFC3 Instruments
- Chapter 2: WFC3 Data Structure
- Chapter 3: WFC3 Data Calibration
- Chapter 4: WFC3 Images: Distortion Correction and AstroDrizzle
- Chapter 5: WFC3 UVIS Sources of Error
- Chapter 6: WFC3 UVIS Charge Transfer Efficiency - CTE
-
Chapter 7: WFC3 IR Sources of Error
- • 7.1 WFC3 IR Error Source Overview
- • 7.2 Gain
- • 7.3 WFC3 IR Bias Correction
- • 7.4 WFC3 Dark Current and Banding
- • 7.5 Blobs
- • 7.6 Detector Nonlinearity Issues
- • 7.7 Count Rate Non-Linearity
- • 7.8 IR Flat Fields
- • 7.9 Pixel Defects and Bad Imaging Regions
- • 7.10 Time-Variable Background
- • 7.11 IR Photometry Errors
- • 7.12 References
- Chapter 8: Persistence in WFC3 IR
- Chapter 9: WFC3 Data Analysis
- Chapter 10: WFC3 Spatial Scan Data
