8.1 Persistence in WFC3 IR
Image persistence, a phenomenon commonly observed in HgCdTe IR detectors, is an afterglow of earlier images, that in the case of the WFC3 IR detector, is present when pixels are exposed to fluence1 levels greater than about 40,000 electrons. In cases where portions of the detector are heavily saturated in the initial image, the afterglow can be detectable at levels comparable to the background for several hours. We note that on rare occasions an afterglow can appear from bright sources taken more than several hours earlier. The effect, dubbed 'burping', is somewhat different than standard persistence in that it occurs after a sequence of persistence-free images followed by a well-exposed internal flat field (intflat). That is, exposures prior to the intflat contain no discernible persistence yet an exposure after the intflat can show persistence which can be traced back to a bright source observed hours up to several days earlier (WFC3 ISR 2015-11). The effect is not well-understood but speculation is that a portion of persistence from bright sources can sometimes remain trapped and hidden longterm in the IR array, to be released later in response to high signal from the intflat.
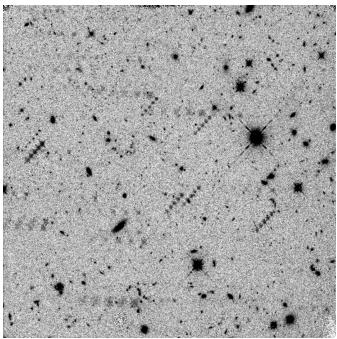
An obvious example of persistence is shown in Figure 8.1. An image of a high galactic latitude field, the observation was taken to search for the optical counterpart to a γ-ray burst. However, two visits from separate IR programs had preceded the observation of this field. The afterglow of the bright sources in these dithered observations (taken in the preceding 12 hours) is clearly visible as 5-point line patterns in Figure 8.1.
Figure 8.1: Persistence in an IR image.
Example of an IR image (ia21h2e9q), in which persistence due to earlier visits is very obvious. The amplitude of the persistence for the brightest pixels in the diagonal trails of stars is about 0.1 electrons/sec. The image is shown using a linear grey scale from 0.7 to 0.9 electrons/sec.
Pixels in the WFC3 IR array and other HgCdTe IR detectors are operated as reversed biased diodes. IR detector pixels are effectively p-n junctions; when in a steady state, the diffusion current is equal to the drift current. A very small current can be induced by by applying a reverse-bias voltage (the reset switch is briefly closed); charge is removed and the depletion region is widened. Subsequently, when light falls on the detector, the depletion region and diode capacitance shrinks, until the next reset read (Dereniak, 1996). Persistence is understood to arise from imperfections, or traps, within the detector pixels that are exposed to free charge as the bias is reduced. The number of traps exposed is determined by the amount of charge accumulated in the diode. A small percentage, of order 1%, of the free charge (WFC3 ISR 2013-07) is captured by the traps and released later, creating the afterimages known as persistence. Resets prevent more charge from being trapped because they remove free charge from the location of the imperfections, however they do not affect the charge that has already been trapped. A detailed theory of persistence has been presented by Smith et al. (2008a, 2008b) and Long et al. (WFC3 ISR 2013-07).
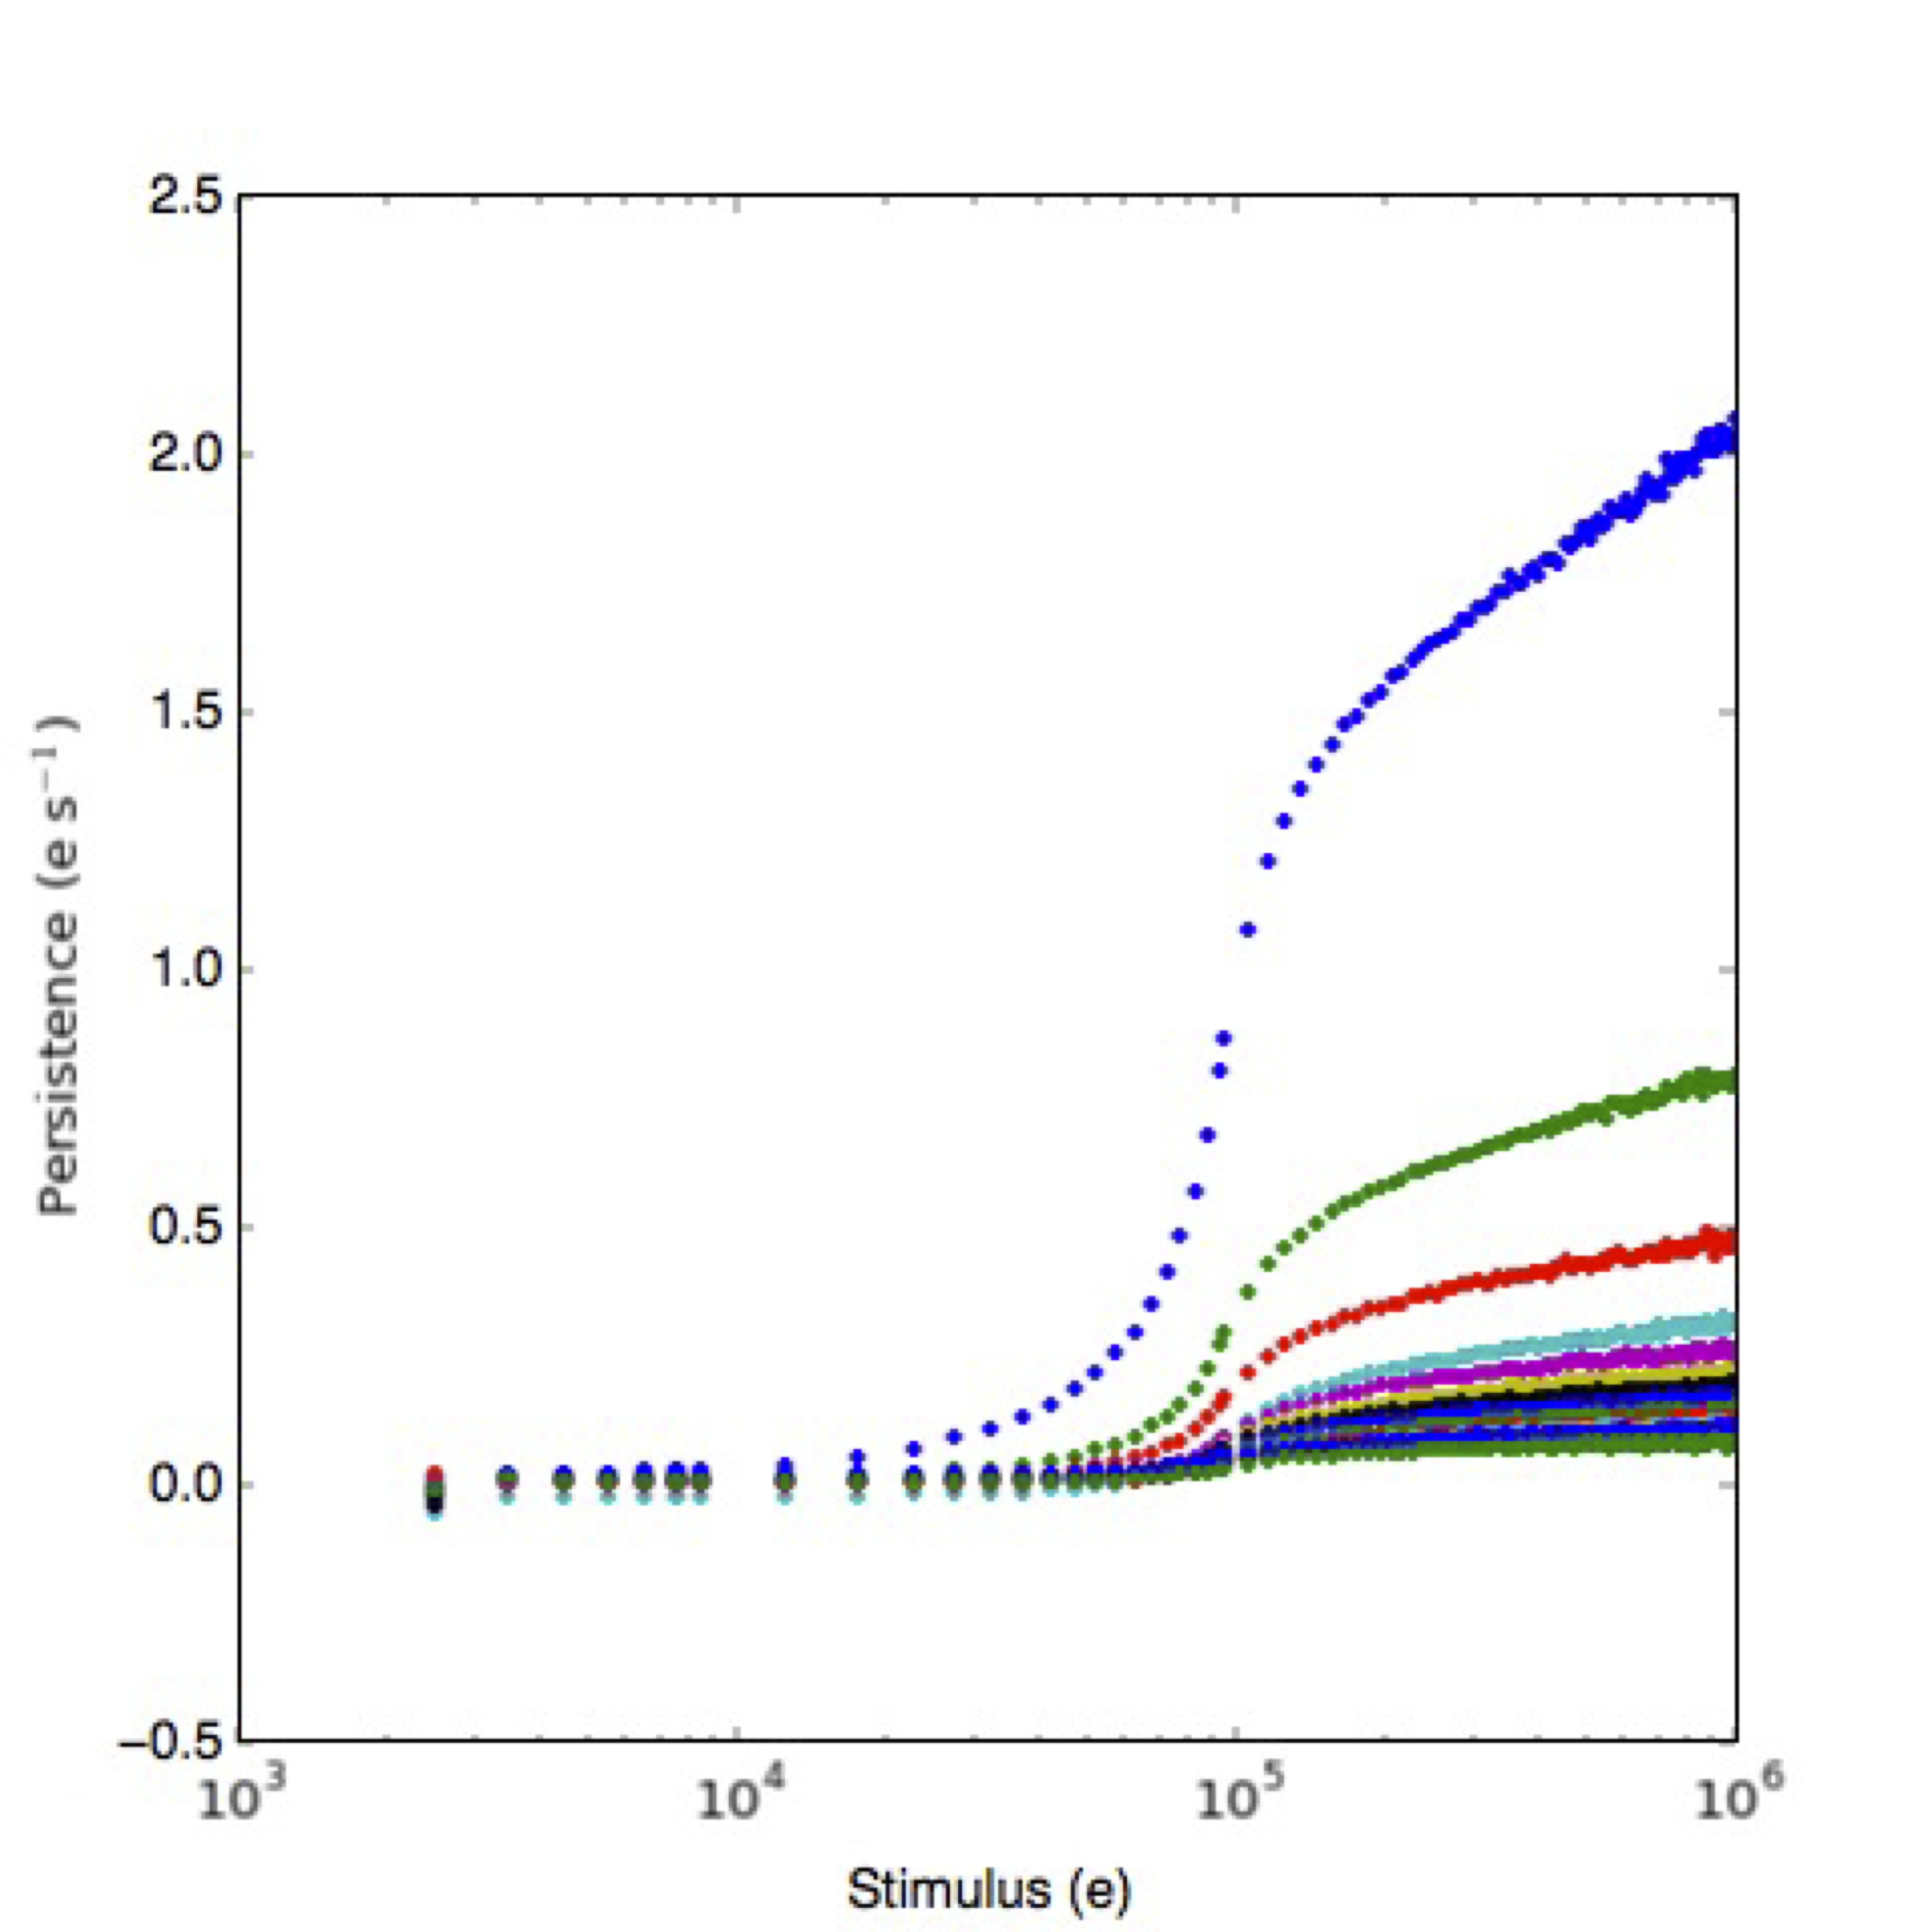
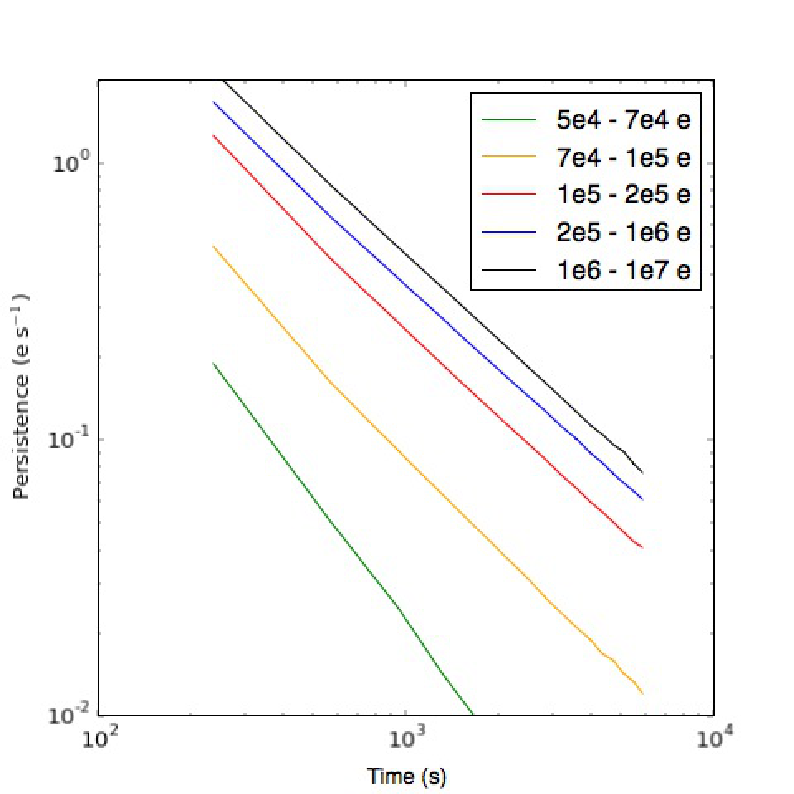
Different HgCdTe IR detectors have different persistence characteristics. In WFC3, a pixel exposed to an effective fluence level of 105 electrons produces a signal of about 0.3 e¯/sec 1000 s after the exposure. This signal decays with time as a power law with a slope of about -1. Thus after 10,000 s, the persistence signal will be about 0.03 e¯/sec, just under the dark current of 0.048 e¯/sec (median). As shown in the left panel of Figure 8.2, the amount of persistence in the WFC3 IR detector depends strongly on the fluence of the earlier exposure. The shape of the curve reflects 1) the density of traps in different regions of the pixels and 2) the fact that once the detector is saturated the voltage levels within the diodes do not increases sharply with increasing fluence. The right panel of Figure 8.2 shows the power law decay of the persistence at different fluence levels.
Figure 8.2: Persistence as a function of stimulus and time.
Top: Persistence as a function of stimulus in a series of dark frames after an observation of the globular cluster Omega Cen. Each color represents one dark image, thus the color sequence represents a time sequence in the darks series (blue is the first dark, green the second, red the third, and so on). Note that the persistence decreases with each subsequent dark exposure.
Bottom: The persistence decay as a function of time. Each color represents the persistence decay as a function of time for pixels grouped by different fluence values in the stimulus exposure (Long et al. 2012).
A further complexity to modeling the persistence is that persistence actually depends not just on the total fluence, but on the complete exposure history since the traps have finite trapping times (WFC3 ISR 2013-06, WFC3 ISR 2013-07). A short exposure of a source that results in a fluence of 105 electrons produces less persistence than a longer exposure of a fainter source that reaches the same fluence level because in the second case the traps have more time to capture free electrons before the diode gets reset. While tracking the complete history of each WFC3/IR pixel is a huge task, to a good level of approximation it is possible to model persistence as a function of only total fluence and total exposure time in the stimulus image. This model, which is currently used by the WFC3 team to predict persistence and derive the persistence products (see Section 8.2) is parameterized as:
| P(t) = A\Big(\frac{t}{1000}\Big)^{\gamma} |
where t is the time, in seconds, since the end of the stimulus exposure and A and γ are functions of both exposure time and fluence level in the stimulus exposure. We refer to this model as the “A-γ” model (WFC3 ISR 2015-15).
Additionally, clear evidence of spatial variation in persistence across the IR detector has been measured (WFC3 ISR 2015-16). One quadrant (upper left) has a higher persistence amplitude than the other three. The shapes of the power law exponents also appear to differ between quadrants. Using a correction flat provides a factor of two reduction in the peak to peak uncertainties; this flat is incorporated into the persistence prediction software and is available from MAST (Version 3.0.1 of the persistence software).
Persistence of the magnitude (and impact) seen in Figure 8.1 is rare. In part, this is because the STScI contact scientists check all Phase II submissions to identify any programs that are likely to cause large amounts of persistence so that the mission schedulers can insert 2 WFC3/IR-free orbits before executing another WFC3/IR program. However, this process is only intended to identify the worst cases. A large fraction of WFC3/IR exposures have some saturated pixels and all of these pixels have the potential to generate persistence in a following IR observation. Inhibiting IR observations of all exposures that could generate persistence would make it impossible to schedule the large numbers of IR observations that are carried out with HST, and in most cases, small amounts of persistence do not affect the science quality of the data, as long as observers and data analyzers take time to examine their IR images for persistence.
1Fluence here is expressed in electrons. We use this nomenclature regardless of whether or not the pixel's full-well capacity is reached. Therefore when values larger than the typical ~80,000 e¯ full-well capacity for the WFC3/IR channel are reported throughout this Chapter, their meaning is not that of “detected” electrons, but rather that of “electrons that would have been detected for an infinite full-well capacity”. This number is proportional to the impinging photon flux multiplied by the exposure time.
-
WFC3 Data Handbook
- • Acknowledgments
- • What's New in This Revision
- Preface
- Chapter 1: WFC3 Instruments
- Chapter 2: WFC3 Data Structure
- Chapter 3: WFC3 Data Calibration
- Chapter 4: WFC3 Images: Distortion Correction and AstroDrizzle
- Chapter 5: WFC3 UVIS Sources of Error
- Chapter 6: WFC3 UVIS Charge Transfer Efficiency - CTE
-
Chapter 7: WFC3 IR Sources of Error
- • 7.1 WFC3 IR Error Source Overview
- • 7.2 Gain
- • 7.3 WFC3 IR Bias Correction
- • 7.4 WFC3 Dark Current and Banding
- • 7.5 Blobs
- • 7.6 Detector Nonlinearity Issues
- • 7.7 Count Rate Non-Linearity
- • 7.8 IR Flat Fields
- • 7.9 Pixel Defects and Bad Imaging Regions
- • 7.10 Time-Variable Background
- • 7.11 IR Photometry Errors
- • 7.12 References
- Chapter 8: Persistence in WFC3 IR
- Chapter 9: WFC3 Data Analysis
- Chapter 10: WFC3 Spatial Scan Data


