5.5 Image Anomalies
Some UVIS images may contain features that are not direct images of astronomical sources. The causes of these features include multiple reflections between optical surfaces (detector, filters, and windows) of light from the astronomical scene, scattered light from bright sources outside the detector FOV, light from the bright Earth that is scattered in the OTA, and electronic cross talk between readout amplifiers. In general, these artifacts are not calibrated and cannot be removed by the WFC3 pipeline.
Examples of the different kinds of image anomalies can be found on the WFC3 website as well as in WFC3 ISR 2017-22. Two new XML overlay files have been added for users to explore the potential for the Dragon’s Breath and Figure 8 ghost artifacts on UVIS images (see STAN 46 for more information). It can be loaded through the FOV tab in the Aladin file viewer, on top of the planned visit. Users can then tweak the overlay or their observation ORIENT to explore whether particular ORIENT restrictions might compromise their science results.
5.5.1 Ghosts
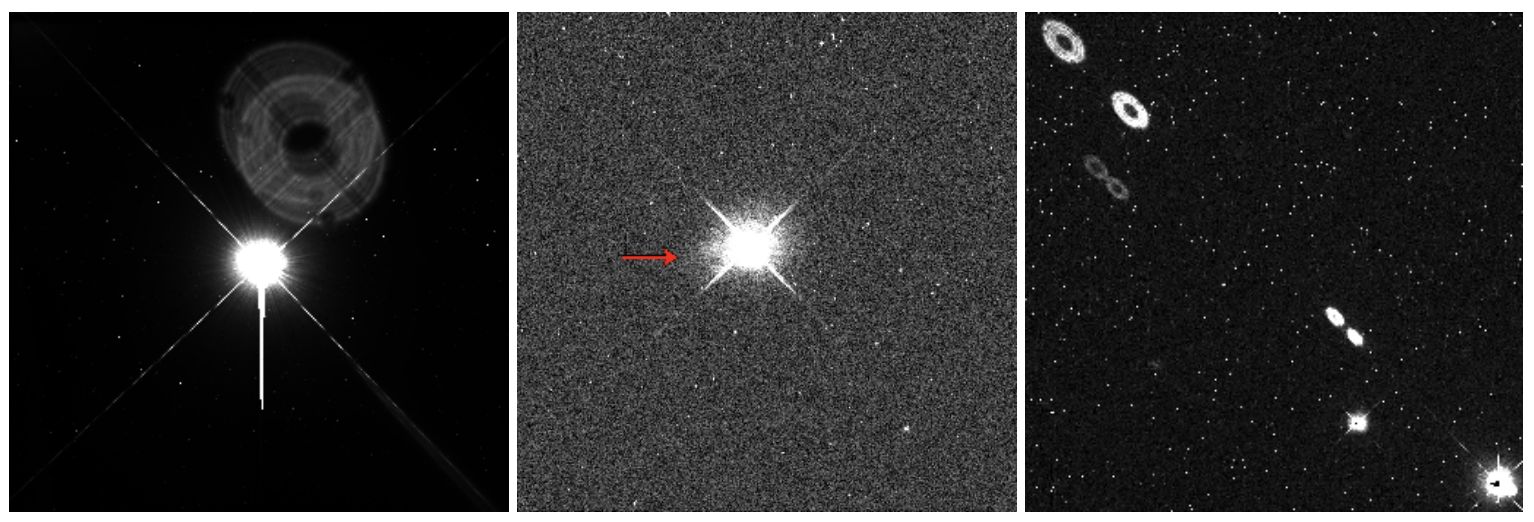
Ghosts appear as images of the pupil formed from the light of a bright target in, or near, the UVIS detector FOV. The target light is scattered twice (or more) by optical surfaces forming one (or more) out of focus image(s). The separation of the ghost from the source depends upon the separation of the scattering surfaces and the angle of scattering. Filter ghosts are formed by scattering of the near-normal source light at the surfaces of a filter and, as such, are found close to, or overlapping, the source image. Further details concerning these ghosts may be found in WFC3 ISR 2007-09. Some examples of the ghosts can be seen in Figure 5.10.
Scattering between the UVIS CCD and either the detector, or dewar window forms so-called ‘optical’ ghosts. These ghosts are separated by ~80" from their source generally in pairs (a "figure eight"; see the right panel of Figure 5.10). Further details may be found in the following WFC3 ISRs; note that documents released before 2009 were based on ground test data. The reports include WFC3 ISR 2001-17 (ghost modeling), WFC3 ISR 2004-04 (initial filter ghosts, most fixed before flight), WFC3 ISR 2007-09 (filter ghosts after filter replacements with overall performance of those replacement filters in WFC3 ISR 2007-01), WFC3 ISR 2007-21 (channel glint in spare UVIS detector ground-testing images, not present in on-orbit images) and WFC3 ISR 2011-16 ("figure eight" ghosts).
Figure 5.10: Ghosts in the WFC3/UVIS detector
Examples of filter-detector ghosts and optical ghosts in the WFC3/UVIS detector:
- Left: a filter-detector ghost (from dataset ibsq56igq) due to the bright star Fomalhaut in the center.
- Middle: A filter ghost (indicated by the arrow) formed near the source (ic9t32gbq).
- Right: An optical ghost known commonly as a figure-eight. Multiple figure-eights are seen in the image caused by two sources in the field (ibvk02ccq).
5.5.2 Dragon’s Breath and Scattered Light
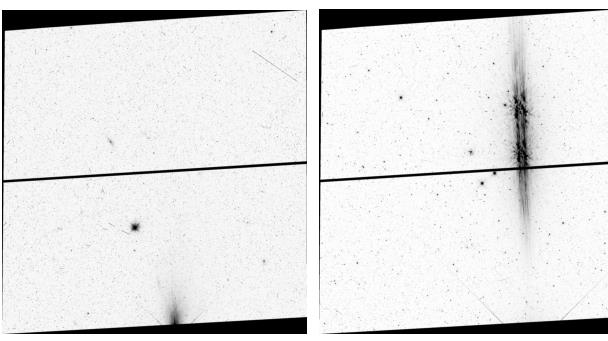
Bright sources immediately outside the image frame on WFC3/UVIS can create (mostly minor) light anomalies in the form of spurious signal redirected into the field of view and affecting the image (see Figure 5.11). Dragon’s Breath (when the light originates from the edge) or Scattered Light (when the light is somewhat displaced from the edge) affects about 12% of a subset of images which include those taken in full-frame wide and long pass filters with exposure times \ge300 seconds (WFC3 ISR 2017-02). It occurs when a bright source lies within a 30’’ rind around the field of view, and peaks when the neighboring source has a V band magnitude around 11.9 or 14.6 (interactive visualization of known dragon's breath sources). The cause for the scattering along the optical path is not completely understood. Most cases of Dragon’s Breath and Scattered Light are low-level features and will not adversely affect a science image. Note that dithering, done by the vast majority of observers, results in either a shift or sometimes complete disappearance of the feature.
Figure 5.11: Dragon’s Breath and Scattered Light on WFC3/UVIS
Examples of Dragon’s Breath and Scattered Light on WFC3/UVIS. Left: Dragon’s Breath spills into the image frame from the bottom of the image. Right: Scattered light projects into the center of the image from a source just off the bottom of the FOV. These are worst-case examples shown with an extreme image stretch; most instances of Dragon’s Breath and scattered light are much less dramatic both in number of affected pixels and flux from the effect.
5.5.3 Crosstalk
Generally whenever two or more quadrants of an electronic device are read out simultaneously, there is a chance of crosstalk (Janesick 2001) and in fact, both the UVIS and IR channels in WFC3 exhibit some very low-level crosstalk (CT). In the UVIS, amps A+B and amps C+D are coupled, thus bright sources in A (or B, C, D) will give rise to CT in B (or A, D, C) respectively. In the IR channel, the CT is also a low-level mirror image although in this case, the coupled amps are 1+2 (upper left and lower left, when image is displayed with x=1,y=1 at lower left) and 3+4 (upper right and lower right). In both channels, the CT appears as a negative image; thus, these electronically induced features are unlikely to be confused with e.g. optical ghosts.
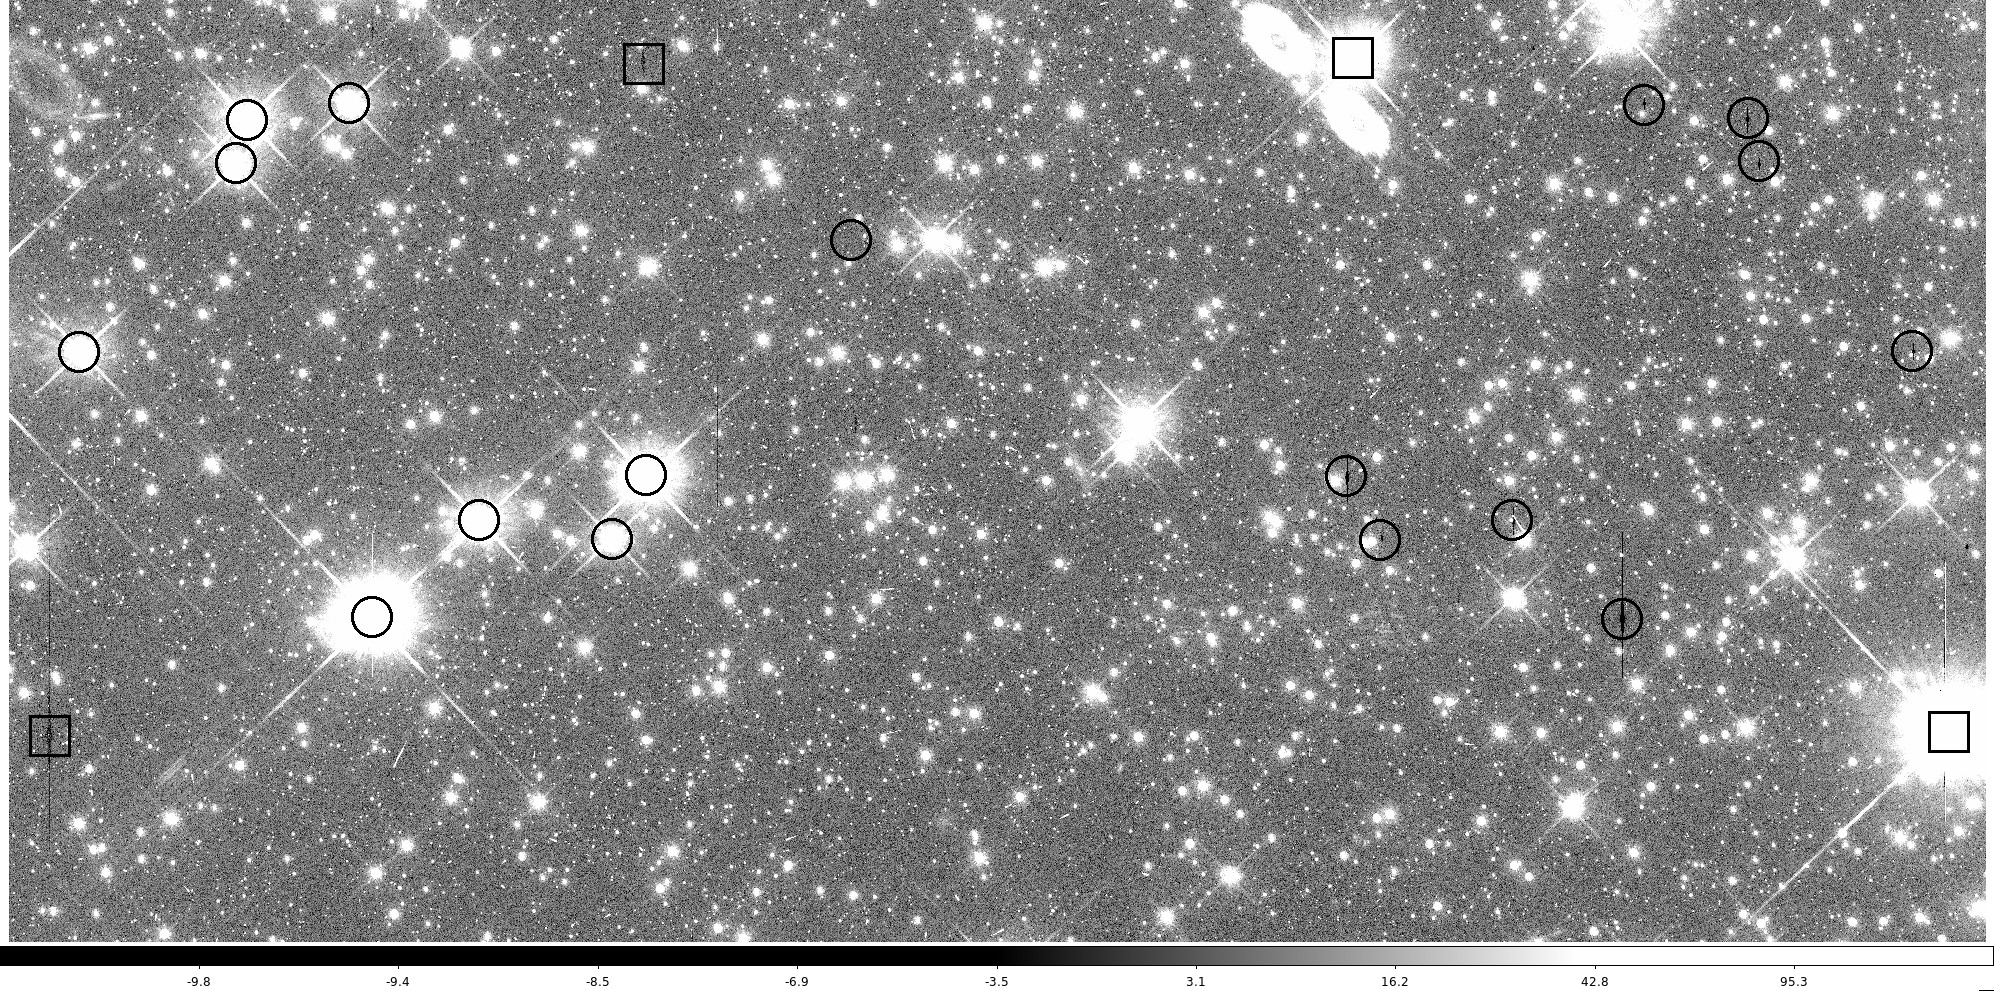
Figure 5.12 shows a sample UVIS image with CT in both amplifiers due to multiple bright sources. The UVIS CT is linear, negative, and appears at the level of ~10-4 to 10-5 of the source. Specifically, in full-frame, unbinned UVIS readouts, the CT level is ~2 × 10⁻⁴ of the source when the target is in quadrants A or C and about 8 × 10⁻⁵ when the target is in quadrants B or D (WFC3 ISR 2009-03).
Crosstalk in the UVIS channel only occurs in the chip containing the target, it does not cross between chips. To within the errors, the CT due to hot pixels and cosmic rays is the same as for point or extended sources. Dithering of observations can help mitigate the low-level effects of CT: the mirror image nature of the CT moves the features in a direction opposite to the target motion, i.e., they will appear to be transients and thus be removed during the drizzling procedure.
A standalone procedure is available for correcting UVIS data for crosstalk (the automated pipeline does not remove the effect). Pixels are effectively corrected to a mean which is well within 1-sigma of the mean of surrounding pixels. The code is described in WFC3 ISR 2012-02 and the software (IDL and python version) are available for use.
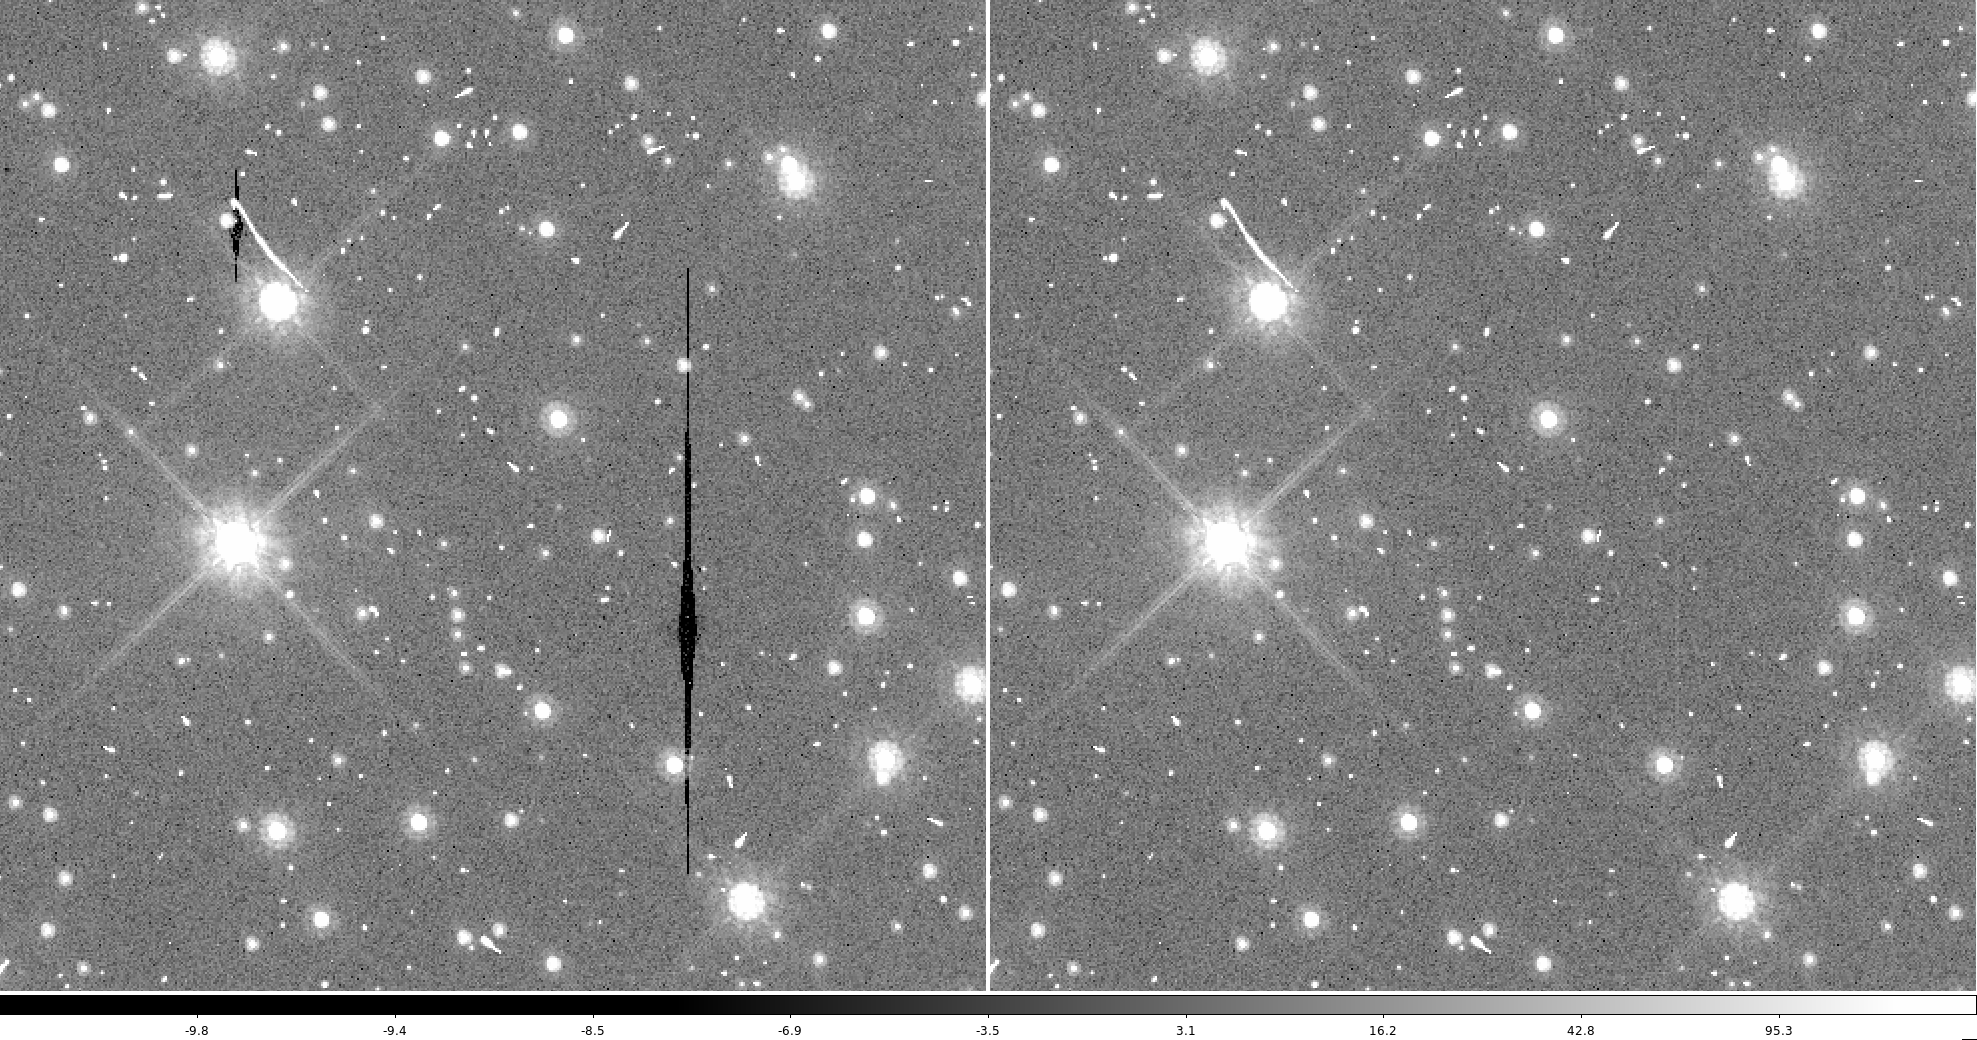
Figure 5.13 shows a subsection of amplifier B from the image in Figure 5.12 and the corresponding crosstalk corrected image.
Figure 5.12: UVIS Crosstalk
UVIS crosstalk for chip 1 (dataset iaby01leq). Circles show bright stars in amplifier A causing crosstalk in amplifier B and squares show bright stars in amplifier B causing crosstalk in amplifier A.
Figure 5.13: UVIS Crosstalk Correction
Subsection of amplifier B (dataset iaby01leq) showing the original (left) and the CT-corrected (right) image sections.
-
WFC3 Data Handbook
- • Acknowledgments
- • What's New in This Revision
- Preface
- Chapter 1: WFC3 Instruments
- Chapter 2: WFC3 Data Structure
- Chapter 3: WFC3 Data Calibration
- Chapter 4: WFC3 Images: Distortion Correction and AstroDrizzle
- Chapter 5: WFC3 UVIS Sources of Error
- Chapter 6: WFC3 UVIS Charge Transfer Efficiency - CTE
-
Chapter 7: WFC3 IR Sources of Error
- • 7.1 WFC3 IR Error Source Overview
- • 7.2 Gain
- • 7.3 WFC3 IR Bias Correction
- • 7.4 WFC3 Dark Current and Banding
- • 7.5 Blobs
- • 7.6 Detector Nonlinearity Issues
- • 7.7 Count Rate Non-Linearity
- • 7.8 IR Flat Fields
- • 7.9 Pixel Defects and Bad Imaging Regions
- • 7.10 Time-Variable Background
- • 7.11 IR Photometry Errors
- • 7.12 References
- Chapter 8: Persistence in WFC3 IR
- Chapter 9: WFC3 Data Analysis
- Chapter 10: WFC3 Spatial Scan Data


