7.9 Pixel Defects and Bad Imaging Regions
7.9.1 Bad Pixels
Data from a variety of on-orbit calibration programs have been used to identify bad pixels and regions on the IR detector. All pixels found anomalous enough to potentially impact data analysis results are flagged and listed in the current bad pixel table reference file. While these pixels are listed in the bad pixel table and propagated into the data quality (DQ) arrays of the observer's ima and flt files produced by calwf3, the flagged science pixels will still have calwf3-calculated signals and signal rates in the science (SCI) arrays. It is therefore important for observers to examine the DQ arrays in their data, and use them to identify which pixels to ignore in any post-calwf3 data reduction and analysis (such as AstroDrizzle).
It is the responsibility of the observer to determine which types of bad pixels are acceptable and which are to be avoided during data analysis. Use the DQ arrays for this purpose.
During calwf3 processing, the bad pixel table is imprinted onto the data quality (DQ) array associated with each MULTIACCUM ramp. Using the pixel values in the DQ array (see Table 3.3) observers can tailor the types of bad pixels used in their analysis. The current default for IR channel data is for Astrodrizzle to ignore (treat as bad) all pixels with any flag except 512 and 64. The 512 flag is used to identify pixels affected by blobs, while the 64 flag is currently not attached to any type of bad pixel and not used. Observers can change the driz_sep_bits parameter within Astrodrizzle to modify this default and adjust which types of bad pixels to use or ignore.
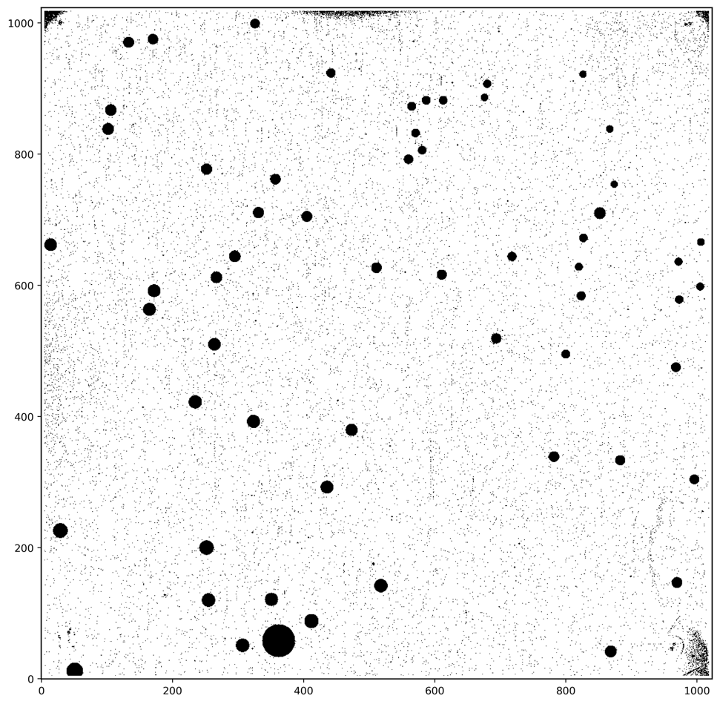
A collection of time-dependent WFC3/IR bad pixel tables are generated annually in order to reflect the observed behavior changes of ∼3.5% of the detector pixels (Figure 7.9., WFC3 ISR 2019-03; WFC3 ISR 2024-02). These new tables also incorporate enhanced bad pixel detection methods that identify and flag bad-in-zeroth-read, dead, hot and unstable pixels on a cycle-by-cycle basis as well as the IR blobs as they appear on the instrument. No evidence has been found for a long-term trend in the number or locations of the bad-in-zeroth-read and dead pixels. However, evidence for a linear increase of ∼200 new stable hot pixels per cycle have been found and the number of unstable pixels can change by up to ∼4000 pixels per cycle. The bad pixel tables used by the calwf3 pipeline along with the time-dependent WFC3/IR superdarks (WFC3 ISR 2019-04). For drizzled data products, a new AstroDrizzle parameter table can be used together with these new reference files in order to recover the stable hot pixels (WFC3 ISR 2019-05). Observers with archival data prior to May 2019 may re-request their data from the MAST portal to have their data automatically reprocessed and redrizzled with the most up-to-date reference files.
7.9.2 Off-nominal Detector Regions
As noted in Section 5.7.7 of the WFC3 Instrument Handbook, there are several coherent features on the IR detector composed of poorly performing pixels. The “Death Star”, the large circular feature at the left bottom edge of the detector, is a collection of pixels which have extremely low QE and exhibit unstable behavior. Unbonded pixels in the upper left and right corners and along the top edge of the detector are unresponsive to illumination. These pixels have all been flagged as dead in the bad pixel mask and should be avoided during analysis. In the lower right corner of the detector is the feature known as the “Wagon Wheel”, a collection of pixels with quantum efficiencies 25% to 50% below normal. This does not mean that these pixels cannot be used during data analysis, but sources in this region will have a lower signal-to-noise ratio than they would elsewhere on the detector, an aspect reflected in the error arrays of calwf3 calibrated data. A more detailed description of these detector regions is given in WFC3 ISR 2008-28.
7.9.3 Dead Pixels
These are pixels with a very low quantum efficiency i.e. they measure little or no signal when illuminated. In addition to the dead pixels found through the analysis of on-orbit data, the pixels comprising the “Death Star” are considered dead. In total, about 3300 pixels are flagged as dead (0.3% of the detector’s light-sensitive pixels), marked with a 4 in the bad pixel table (see WFC3 ISR 2010-13 and WFC3 ISR 2019-03 for details). Other than those pixels within the “Death Star” and the small areas of unbonded pixels along the FOV edge, dead pixels are scattered randomly across the detector. No long-term trend is evident in the dead pixel population. We recommend that observers ignore any pixel marked as dead.
7.9.4 Bad Zeroth Read Pixels
These are pixels which exhibit anomalous signals in the zeroth read of a data ramp, usually due to being shorted or unbonded (WFC3 ISR 2003-06, WFC3 ISR 2019-03). As a result, many of the bad zeroth read pixels are also flagged as dead. By flagging bad zeroth read pixels in the bad pixel table, the pipeline adopts a conservative approach to bad pixel behavior. Historically, pixels with an off-nominal signal in the zeroth read displayed other non-nominal behaviors thus these pixels are clearly of questionable quality. As with all flavors of bad pixels, observers should determine whether or not using these pixels will have a significant impact on their analysis.
In a typical cycle, there are about 3100 pixels in total (~0.30% of the detector pixels) flagged as bad in the zeroth read (flag value of 8); no long-term trend is evident in the bad in zeroth read population. These pixels are largely concentrated in the areas of the “Death Star”, the upper corners, and along the quadrant boundaries of the detector (WFC3 ISR 2019-03).
7.9.5 Unstable Pixels
There are a total of about 15,000 unstable pixels (1.5% of all science pixels) on the IR detector, flagged with a DQ value of 32 (WFC3 ISR 2019-03). Due to the unpredictable behavior of these pixels, we recommend against including them in data analysis.
Unstable pixels display abnormal variations in signal in a set of nominally identical ramps. Initial studies early in the WFC3 mission found a wide range of unstable pixel behaviors: some pixels appear stable and repeatable in almost all ramps, but will measure appreciably different signal values in only one or two ramps. Other pixels display signal values that vary wildly from ramp to ramp in all observations of a data set (WFC3 ISR 2010-13, WFC3 ISR 2012-11). A recent analysis of more than 10 years of data (WFC3 ISR 2019-03) identified and flagged unstable pixels (as well as bad-in-zeroth, dead pixels) on a cycle-by-cycle basis and delivered updated bad pixel tables to the calibration pipeline. About 3.5% of the IR science pixels have exhibited unstable behavior for some period of time since launch. The number of unstable pixels can change by up to ~4000 pixels per cycle.
For any epoch of WFC3/IR data retrieved from MAST after May 2019, the automated calibration pipeline images (flt, ima) will have unstable pixels flagged with 32 in the DQF. Observers working with such data can choose to reclaim calibrated stable hot pixels for their analysis by discarding only those hot pixels flagged as both hot (16) AND unstable (32); hot pixels which are stable are calibrated via the superdark calibration reference file. Observers working with drizzled data (drz) will find that the stable hot pixels (16) are by default reclaimed and treated as good; only pixels flagged as unstable (32) continue to be treated as bad (WFC3 ISR 2019-05).
7.9.6 Snowballs
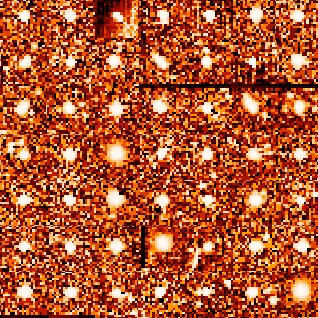
Curious but relatively innocuous anomalies which occasionally appear in IR observations are "snowballs". These sources have an extended, fuzzy appearance in the data. Snowballs are transient, extended sources that appear in IR channel data at rates of roughly 1.2 snowballs per hour of exposure time. The snowballs are suspected to be caused by natural radioactivity within the detector itself. Specifically, alpha particles emitted by thorium and/or uranium at ~1 ppm concentration in the detector can explain the observed characteristics of the snowballs (WFC3 ISR 2009-44). Similar to the manner in which cosmic rays appear, the entire flux of a snowball is deposited into the detector's pixels instantaneously. A typical snowball affects about 10 pixels, depositing between 200,000 and 500,000 electrons, and saturating 2-5 pixels. Figure 7.10 shows a 7×7 mosaic of snowballs gathered from ground testing and on orbit data. Since the snowball behavior mimics that of cosmic ray impacts, calwf3 is able to remove snowballs from WFC3/IR data during standard pipeline processing. That, combined with low rate of occurrence, means snowballs should have a minimal impact on science observations. Further details on snowballs can be found in WFC3 ISR 2009-43 (initial characterization) and in WFC3 ISR 2015-01 (long-term characterization).
The snowball occurrence rate, intensity, shape, and variation over time provides important constraints on candidate species by their decay rates, and HST’s WFC3/IR has by far the longest time baseline for analysis (WFC3 ISR 2020-03). The IR ‘Snowball’ occurrences in WFC3/IR have been analyzed from in-flight data since launch finding more than 10,000 snowballs over an 11 year baseline of observations, distributed roughly equally across that time period.
-
WFC3 Data Handbook
- • Acknowledgments
- • What's New in This Revision
- Preface
- Chapter 1: WFC3 Instruments
- Chapter 2: WFC3 Data Structure
- Chapter 3: WFC3 Data Calibration
- Chapter 4: WFC3 Images: Distortion Correction and AstroDrizzle
- Chapter 5: WFC3 UVIS Sources of Error
- Chapter 6: WFC3 UVIS Charge Transfer Efficiency - CTE
-
Chapter 7: WFC3 IR Sources of Error
- • 7.1 WFC3 IR Error Source Overview
- • 7.2 Gain
- • 7.3 WFC3 IR Bias Correction
- • 7.4 WFC3 Dark Current and Banding
- • 7.5 Blobs
- • 7.6 Detector Nonlinearity Issues
- • 7.7 Count Rate Non-Linearity
- • 7.8 IR Flat Fields
- • 7.9 Pixel Defects and Bad Imaging Regions
- • 7.10 Time-Variable Background
- • 7.11 IR Photometry Errors
- • 7.12 References
- Chapter 8: Persistence in WFC3 IR
- Chapter 9: WFC3 Data Analysis
- Chapter 10: WFC3 Spatial Scan Data

