7.4 WFC3 Dark Current and Banding
7.4.1 Dark Current Subtraction
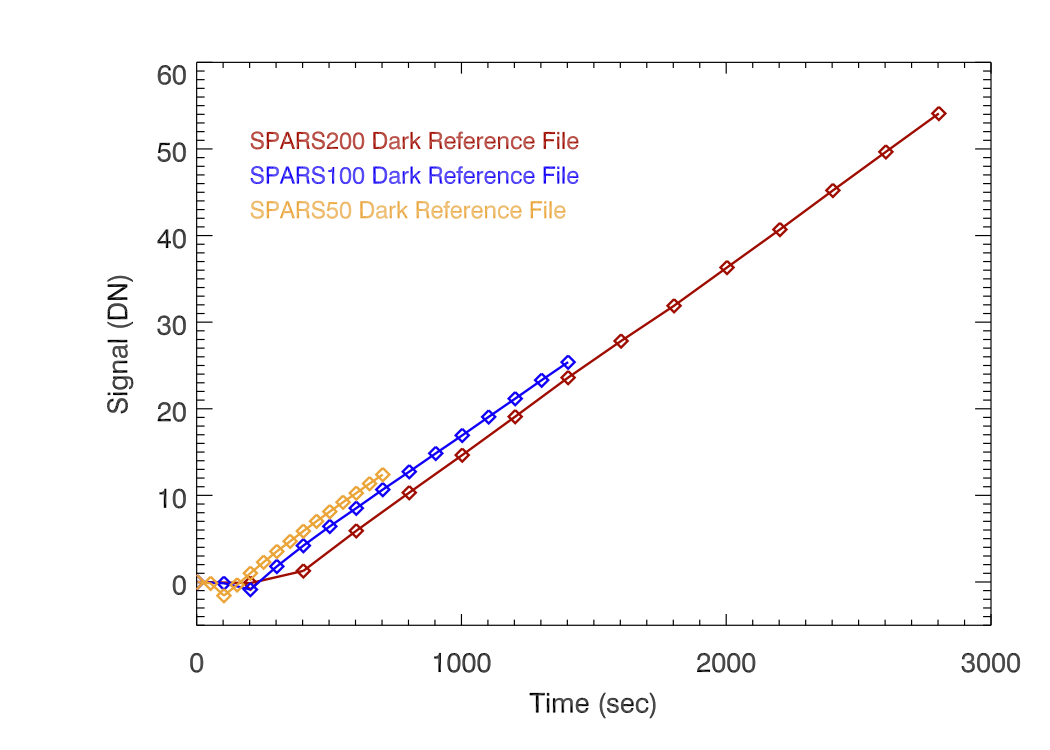
The dark current in the IR detector is the signal measured when no illumination source is present. In an ideal detector, this signal would grow linearly with integration time. In practice, the dark current behavior of the IR detector is dependent upon the timing pattern used to collect each observation and is not constant for the duration of a given MULTIACCUM ramp (for more information, see Section 7.7 in the WFC3 Instrument Handbook). The measured dark current can even be negative in certain situations (e.g. detector reset effects, see WFC3 ISR 2010-16 and references therein). Figure 7.1 shows a plot of the mean measured dark current signal versus time for three different timing patterns. Note that the three curves are not superimposed one another, nor do they show a straight line for the entire duration of the ramps. Details are presented in WFC3 ISR 2009-21. For these reasons, there is a separate MULTIACCUM dark current reference file for each sample sequence and mode (full-frame, subarray) combination. During pipeline processing, calwf3 subtracts the appropriate dark current ramp read-by-read from the science observation (see WFC3 ISR 2012-11).
The behavior of the IR darks has been analyzed in on-orbit data spanning Sep 2009 - June 2016. Although the darks possess a similar signal pattern across the detector, the median dark rates vary by as much as ~0.03 e-/s (WFC3 ISR 2017-04). The distribution of these median values has a triangular shape with a mean and standard deviation of 0.049 ± 0.007 e-/s). There is no apparent systematic long-term trend in the dark signal (see Figure 3 from WFC3 ISR 2017-04).
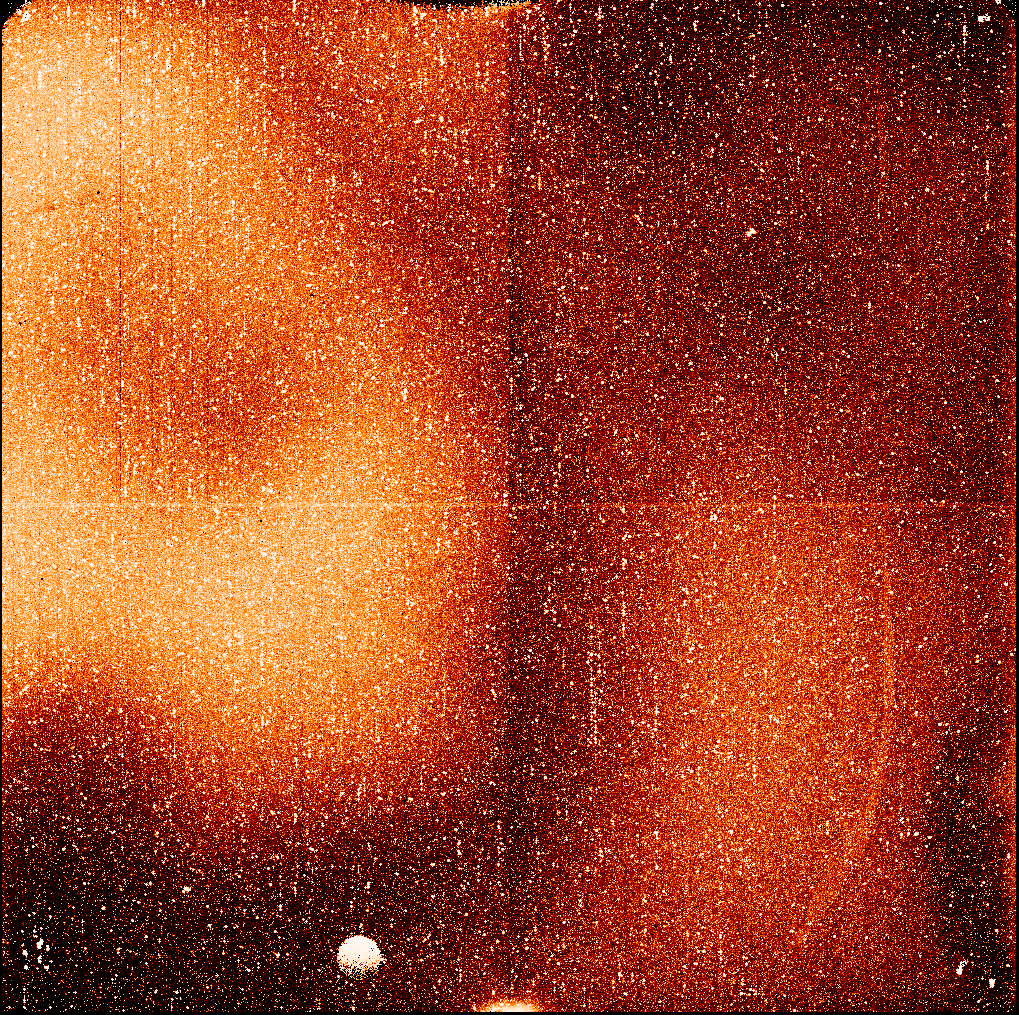
The dark current calibration files are created from a stack of dark up-the-ramp datasets which are taken on a regular basis throughout each observing cycle. For each sample sequence, the dark current calibration file is created by calculating the robust (outlier rejected) mean signal for each pixel in each read. Calculated uncertainties in the dark current calibration signals (in the error arrays of these files) are propagated into the error arrays of the calibrated science observations at the time of the dark current subtraction by calwf3. Figure 7.2 illustrates the large-scale dark current structure, showing the measured signal rate in a high signal-to-noise dark current calibration ramp. In general, the upper left quadrant of the detector has the highest dark current, while the upper right has the lowest.
The time-variable behavior of the WFC3/IR darks has been analyzed in on-orbit data covering May 2009 - Oct 2017 and new WFC3/IR dark calibration files were created for all allowed observing modes (WFC3 ISR 2019-04). Unlike previous superdark releases, the values of any pixels exhibiting time-dependent behavior are updated on a cycle-by-cycle basis, which allows for better calibration of those ∼3.5% of detector pixels that were found to have fluctuating dark levels (WFC3 ISR 2019-03). The new superdarks also incorporate an additional four years of dark calibration data since the previous release, which reduces the errors associated with the superdark values by 8.9-67%, with an average decrease of 30% (see WFC3 ISR 2019-04), depending on the observing mode. The superdarks were installed in 2019 in the calwf3 pipeline along with the new accompanying time-dependent WFC3/IR bad pixel tables (WFC3 ISR 2019-03; see also STAN 29 from June 2019); all prior data were reprocessed with the new reference files. For drizzled data products, a new AstroDrizzle parameter table should be used together with these new reference files in order to recover the stable hot pixels (WFC3 ISR 2019-05).
Observers with archival data prior to May 2019 may re-request their data from the MAST portal to obtain data reprocessed and redrizzled with the new WFC3/IR superdark, bad pixel, and AstroDrizzle reference files.
7.4.2 Banding
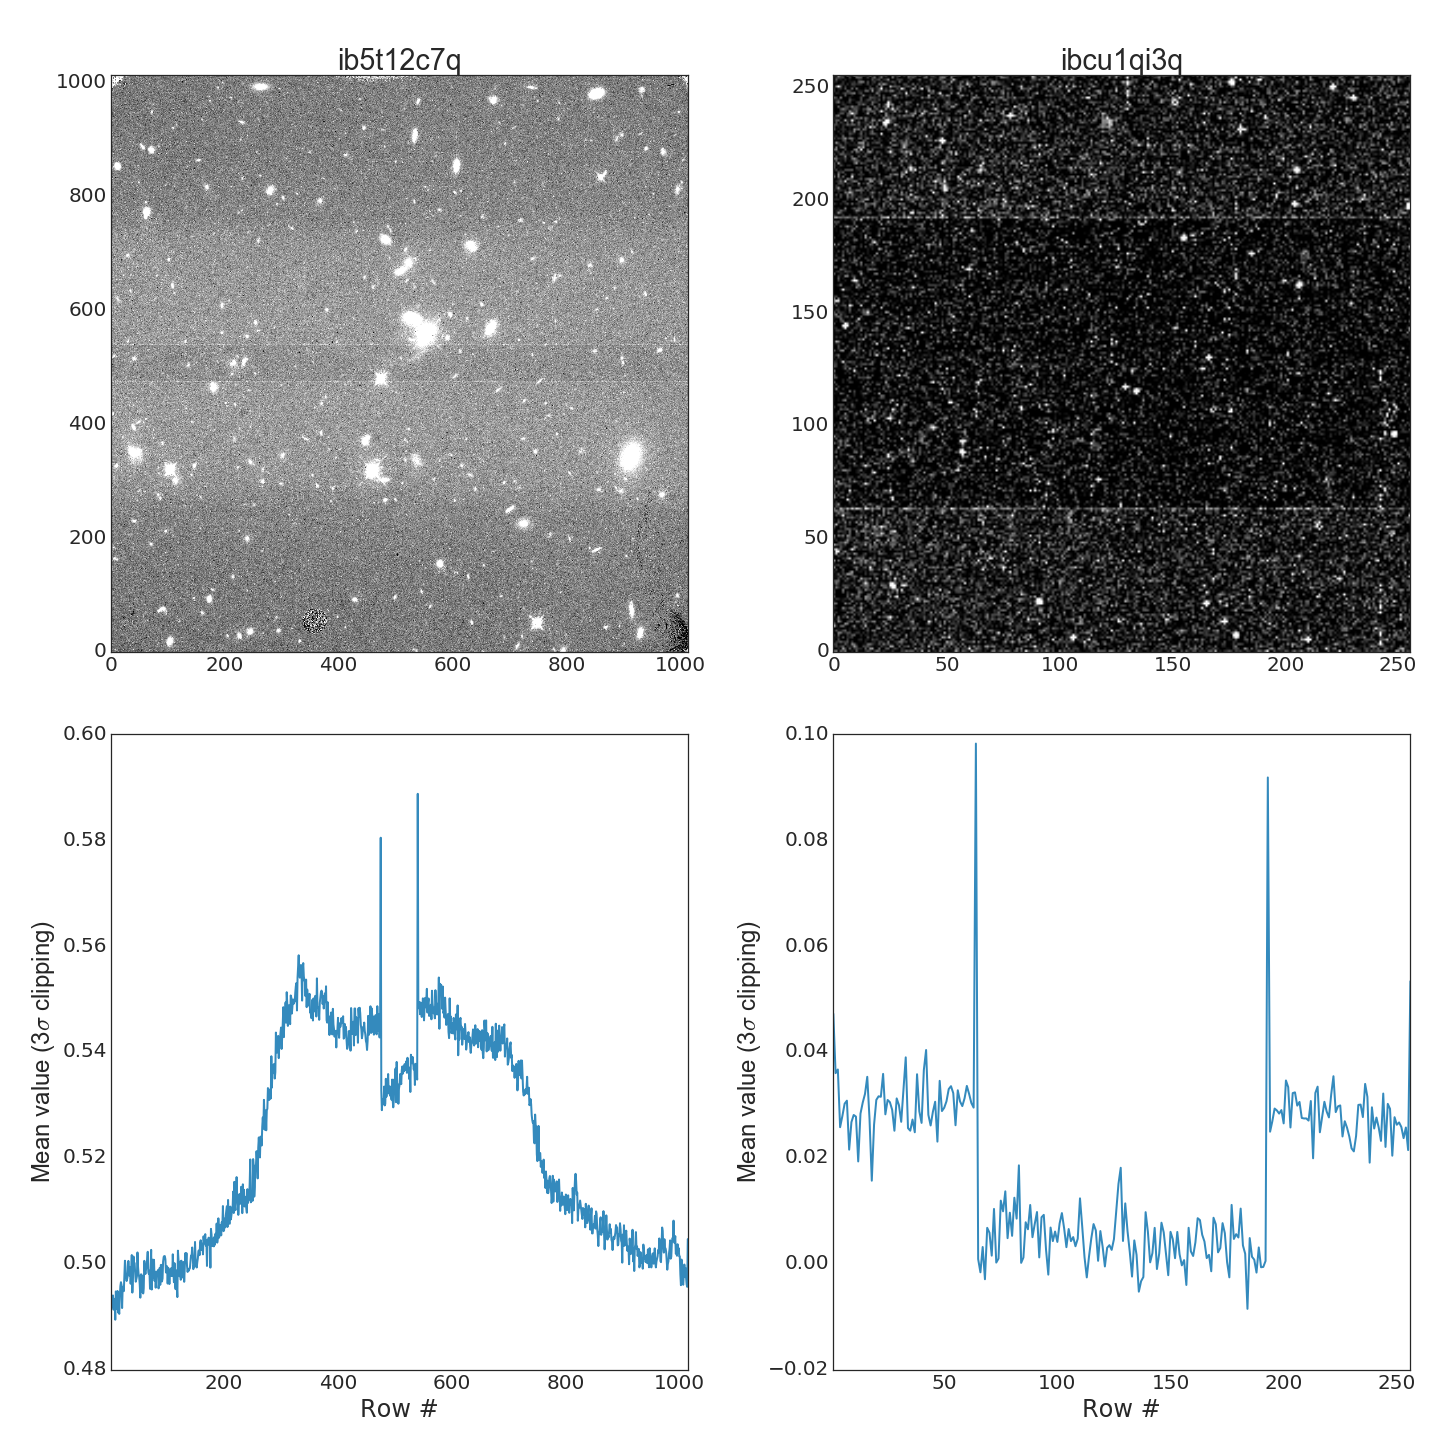
Banding occurs when an IR observation (or observations) in a smaller readout format immediately precedes an observation in a larger subarray or a full-frame. The banded images exhibit a rectangular region containing pixels whose brightness levels are offset by typically +/- 3-5 DN from values in the rest of the image. The band is centered vertically in the larger (second) image, extending all the way across the image horizontally, and has a height equal to the height of the smaller (first) subarray observation, as illustrated in Figure 7.3 (top panels). The banded region is outlined on top and bottom by single rows of pixels with even brighter levels. The bottom panels of Figure 7.3 show the respective vertical brightness profiles. For more information, please refer to WFC3 ISR 2011-04 and the last paragraph of Section 7.4.4 of the WFC3 Instrument Handbook.
Figure 7.3: Examples of banded images.
Top Left: 64-pixel-high band in a SPARS50 full-frame science image. Top Right: 128-pixel-high band in a SPARS10 256 × 256 subarray dark calibration image. Bottom panels: 3-sigma clipped robust mean along the x-axis of the two images in the top panels. Note the central banded regions and the two higher spikes from the rows that bound them.
Mitigation
The best mitigation is during observation planning: banding can be prevented by avoiding mixed aperture sizes within the same orbit. If a variety of aperture sizes are necessary, the observations should be sequenced from largest to smallest aperture sizes.
Some early dark reference files exhibited banding which imprinted the feature onto science images during the calibration process. Observations retrieved from the archive are automatically reprocessed with the latest calibration files (which are now band-free), so simply re-retrieving one's observations from MAST may solve the problem. If recalibration does not resolve the problem, it may be possible to subtract the features as an additional 'sky' component.
-
WFC3 Data Handbook
- • Acknowledgments
- • What's New in This Revision
- Preface
- Chapter 1: WFC3 Instruments
- Chapter 2: WFC3 Data Structure
- Chapter 3: WFC3 Data Calibration
- Chapter 4: WFC3 Images: Distortion Correction and AstroDrizzle
- Chapter 5: WFC3 UVIS Sources of Error
- Chapter 6: WFC3 UVIS Charge Transfer Efficiency - CTE
-
Chapter 7: WFC3 IR Sources of Error
- • 7.1 WFC3 IR Error Source Overview
- • 7.2 Gain
- • 7.3 WFC3 IR Bias Correction
- • 7.4 WFC3 Dark Current and Banding
- • 7.5 Blobs
- • 7.6 Detector Nonlinearity Issues
- • 7.7 Count Rate Non-Linearity
- • 7.8 IR Flat Fields
- • 7.9 Pixel Defects and Bad Imaging Regions
- • 7.10 Time-Variable Background
- • 7.11 IR Photometry Errors
- • 7.12 References
- Chapter 8: Persistence in WFC3 IR
- Chapter 9: WFC3 Data Analysis
- Chapter 10: WFC3 Spatial Scan Data


