2.2 Comparison of WFC and UVIS
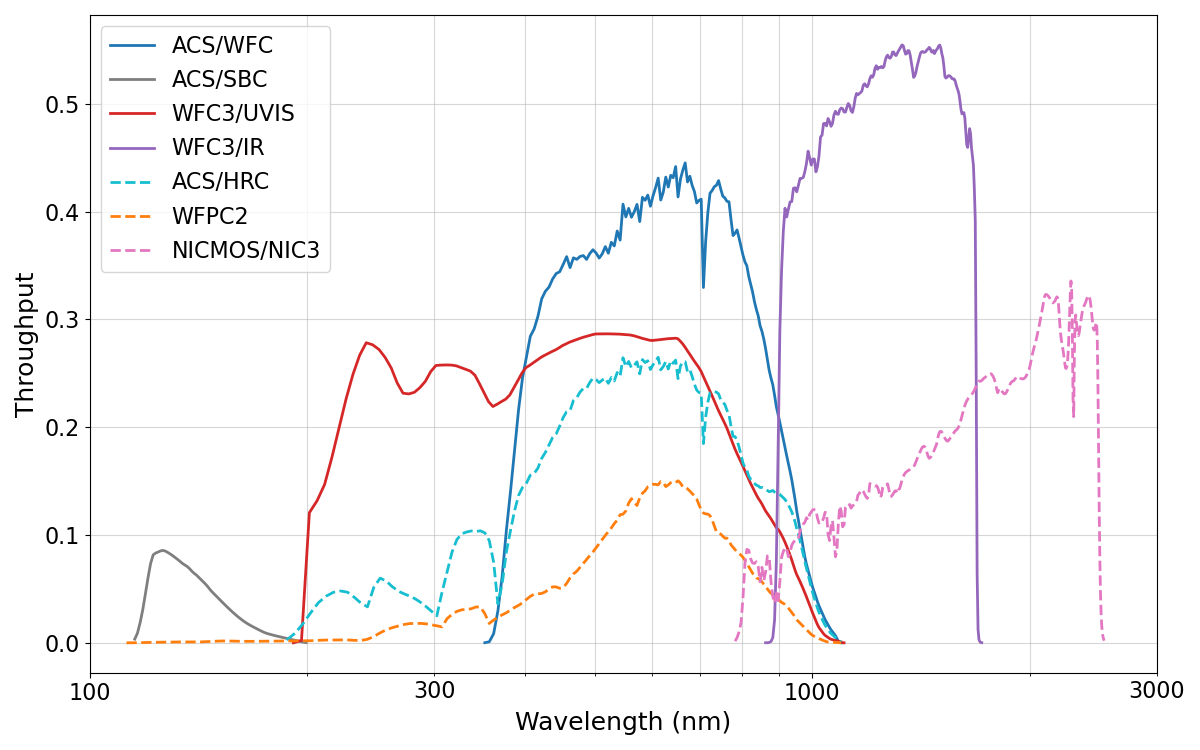
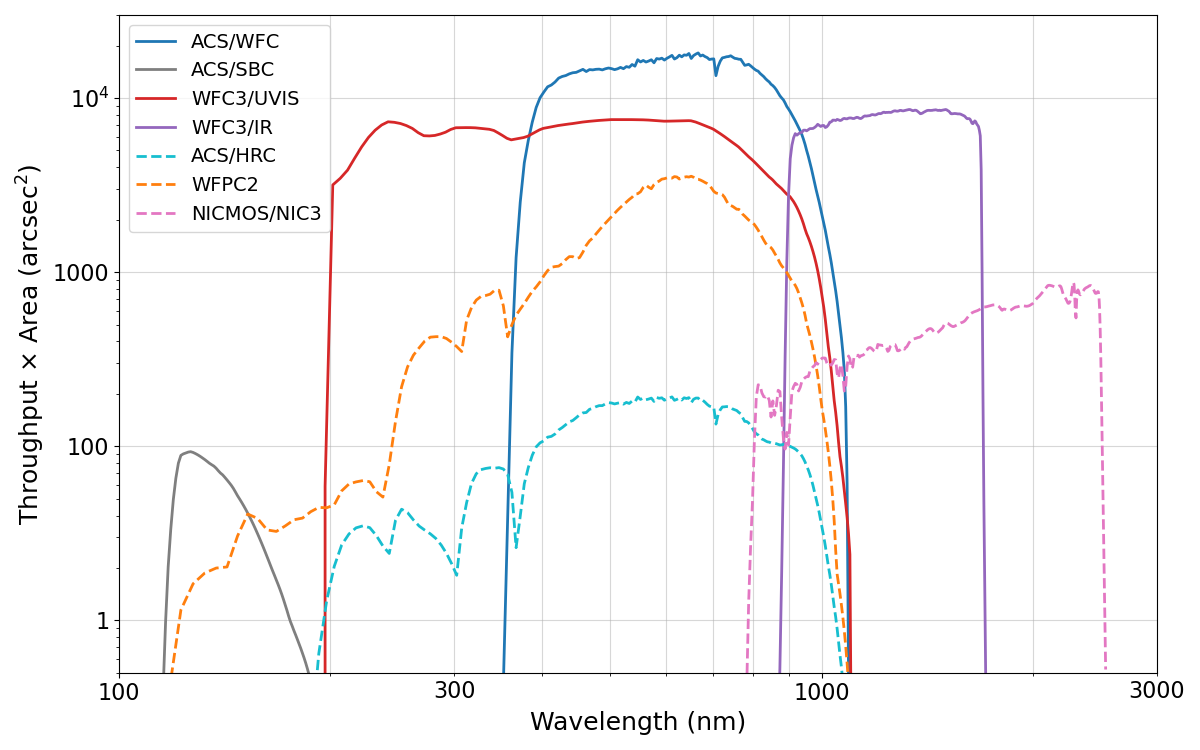
The UVIS channel of the Wide Field Camera 3 complements ACS/WFC over wavelengths ~3700 Å to 10,000 Å. Observers must determine which instrument is more appropriate for their science from the perspectives of field of view, pixel size, throughput, and filter availability. Table 2.2, Figure 2.1 and Figure 2.2 show these characteristics for each instrument. See also Figures 5.8 (limiting magnitude for point sources) and 5.9 (limiting magnitude for extended sources). ACS/WFC has a larger pixel scale (0.05 arcsec/pixel) than WFC3/UVIS (0.04 arcsec/pixel), so the field of view of ACS/WFC (202 × 202 arcsec2) is considerably larger than that of WFC3/UVIS (162 × 162 arcsec2). WFC3/UVIS may therefore be preferred if angular resolution is more important than field of view. On the other hand, ACS/WFC is more sensitive than WFC3/UVIS at wavelengths longward of ~4000 Å, so ACS/WFC is recommended if greater sensitivity at red wavelengths is important. Due to the trapped radiation environment of HST, both ACS/WFC and WFC3/UVIS suffer from similar charge transfer efficiency (CTE) losses at this point in their lifetimes. See Section 4.3.8 for details. It is also possible to use both ACS/WFC and WFC3/UVIS in parallel. The separation of the two cameras is ~360" (see Figure 3.1).
Table 2.2: Comparison of wavelength coverage, pixel scales, and fields of view of ACS and WFC3/UVIS. HRC is no longer available. More information can be found at the SIAF website.
Instrument | Wavelength | Average Pixel size (arcsec) | Field of View (arcsec2) |
| WFC3 UVIS | 200–1000 | 0.04 | 162 × 162 |
| ACS WFC | 370–1100 | 0.05 | 202 × 202 |
| ACS HRC | 200–1100 | 0.028 × 0.025 | 29 × 25 |
| ACS SBC | 115–170 | 0.034 × 0.030 | 35 × 31 |
-
ACS Instrument Handbook
- • Acknowledgments
- • Change Log
- • Chapter 1: Introduction
- Chapter 2: Considerations and Changes After SM4
- Chapter 3: ACS Capabilities, Design and Operations
- Chapter 4: Detector Performance
- Chapter 5: Imaging
- Chapter 6: Polarimetry, Coronagraphy, Prism and Grism Spectroscopy
-
Chapter 7: Observing Techniques
- • 7.1 Designing an ACS Observing Proposal
- • 7.2 SBC Bright Object Protection
- • 7.3 Operating Modes
- • 7.4 Patterns and Dithering
- • 7.5 A Road Map for Optimizing Observations
- • 7.6 CCD Gain Selection
- • 7.7 ACS Apertures
- • 7.8 Specifying Orientation on the Sky
- • 7.9 Parallel Observations
- • 7.10 Pointing Stability for Moving Targets
- Chapter 8: Overheads and Orbit-Time Determination
- Chapter 9: Exposure-Time Calculations
-
Chapter 10: Imaging Reference Material
- • 10.1 Introduction
- • 10.2 Using the Information in this Chapter
-
10.3 Throughputs and Correction Tables
- • WFC F435W
- • WFC F475W
- • WFC F502N
- • WFC F550M
- • WFC F555W
- • WFC F606W
- • WFC F625W
- • WFC F658N
- • WFC F660N
- • WFC F775W
- • WFC F814W
- • WFC F850LP
- • WFC G800L
- • WFC CLEAR
- • HRC F220W
- • HRC F250W
- • HRC F330W
- • HRC F344N
- • HRC F435W
- • HRC F475W
- • HRC F502N
- • HRC F550M
- • HRC F555W
- • HRC F606W
- • HRC F625W
- • HRC F658N
- • HRC F660N
- • HRC F775W
- • HRC F814W
- • HRC F850LP
- • HRC F892N
- • HRC G800L
- • HRC PR200L
- • HRC CLEAR
- • SBC F115LP
- • SBC F122M
- • SBC F125LP
- • SBC F140LP
- • SBC F150LP
- • SBC F165LP
- • SBC PR110L
- • SBC PR130L
- • 10.4 Geometric Distortion in ACS
- • Glossary