7.5 MAMA Operation and Feasibility Considerations
7.5.1 MAMA Saturation—Overflowing the 16 Bit Buffer
The MAMA is a photon-counting detector: as each event is recorded, the buffer memory for the corresponding pixel is incremented by one integer. The buffer memory stores values as 16 bit integers; hence the maximum number it can accommodate is 65,536 counts per pixel in a given ACCUM mode observation. When accumulated counts per pixel exceed this number, the values will wrap, i.e., the memory resets to 0. As an example, if you are counting at 25 counts/s/pix, you will reach the MAMA "accumulation" limit in ~44 minutes.
Keep accumulated counts/pix below this value by breaking individual exposures into multiple identical exposures (see also Section 11.2.4), each of which is short enough that fewer than 65,536 counts are accumulated per pixel. There is no read noise for MAMA observations, so no penalty is paid in lost signal-to-noise ratio when exposures are split. There is only a small overhead for each MAMA exposure (Chapter 9). The total count limit does not apply when using the MAMAs in TIME-TAG mode (see Section 11.1 Basic Operating Modes).
When using ACCUM mode, keep the accumulated counts per pixel below 65,536, by breaking single exposures into multiple exposures, as needed.
7.5.2 MAMA Darks
The STIS MAMA detectors have intrinsically very low dark currents. Dark currents measured during ground testing were less than 10 counts/s for the FUV-MAMA and less than 30 counts/s for the NUV-MAMA over the whole detector. For the FUV-MAMA, this exceptionally low dark current was initially achieved on orbit. For the NUV-MAMA, charged particle impacts on the MgF2 faceplate cause a higher background that resulted in a dark current of 800–2000 counts/s, varying both with temperature and the thermal history of the detector. This particular phenomenon is not present for the FUV-MAMA, but the dark current for that detector now also varies with time, temperature and position on the detector. The different dark current behaviors of the detectors are discussed in more detail below, and up-to-date information can be found on the Monitoring page of the STIS website. We split the discussion of the NUV dark current into before and after servicing mission 4 (SM4) where the electronics were switched and STIS become operational again.
NUV-MAMA Dark Current Before SM4
Most of the dark current in the NUV-MAMA comes from phosphorescence of impurities in the MgF2 detector faceplate. A simple model of the phenomenon was developed by Jenkins and Kimble that envisions a population of impurity sites each having three levels: (1) a ground state, (2) an excited energy level which can decay immediately to the ground state, and (3) a meta-stable level that is at an energy slightly below the one that can emit radiation. The meta-stable states are initially populated by charged particle impacts that mostly occur during passages through the South Atlantic Anomaly (SAA). Hours or days later, the electrons trapped in these meta-stable states are thermally excited to an unstable upper level and then emit a photon as they decay to the ground state. This thermal excitation rate is proportional to exp(−ΔE/kT), where ΔE is the energy difference between the levels, T is temperature of the detector and k is the Boltzmann's constant. The behavior of the count rate vs. temperature leads to an estimate of 1.1 eV for ΔE.
While this temperature dependent function does a good job of predicting the short term response of the NUV dark current to temperature changes, the longer term response is more complex. In equilibrium, the number of decays will match the number of excitation events. A sudden temperature increase would then result in an initial rapid increase in the dark rate, as the meta-stable states are more easily depopulated at higher temperatures. However, after several days, the population of meta-stable states would reach a new equilibrium, resulting in a dark rate that, while higher than the equilibrium rate was at the cooler temperature, is significantly lower than the short term response to the same temperature increase. The predicted large temporary increases in the dark rate were observed after the initial STIS installation, and also after Servicing Mission 3a (see Figure 7.19).
Figure 7.19: The NUV-MAMA Dark Rate as Measured from Dark Monitor Exposures Between 1997 and 2004.
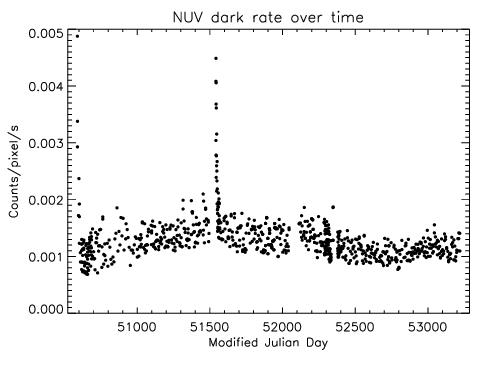
Note the large, but temporary, increases in the dark rate after initial installation of STIS and after SM3a (near MJD 51500), when the detector was turned back on after being cold for several weeks. Also note the long term fluctuations in the mean dark current.
During the last nine months of STIS operations prior to the failure in August 2004, the typical NUV-MAMA dark current ranged between 8 × 10⁻⁴ and 1.6 × 10⁻³ counts/pix/s (Figure 7.20). Changes in the low earth orbit radiation environment affect the rate at which the meta-stable impurity states are populated. For Cycle 17 planning purposes we had guessed that the equilibrium STIS/NUV-MAMA dark current would be 10% higher than it was during 2003–2004; which implied a range of dark count rate values between 8.5 ×10⁻⁴ and 1.7 x 10⁻³ counts/pix/s. However, as we will see in the next section (NUV-MAMA Dark Current after SM4), this drastically underestimated the actual dark rate seen after SM4.
Figure 7.20: NUV Dark Current vs. OM2CAT Temperature Between November 2003 and August 2004.
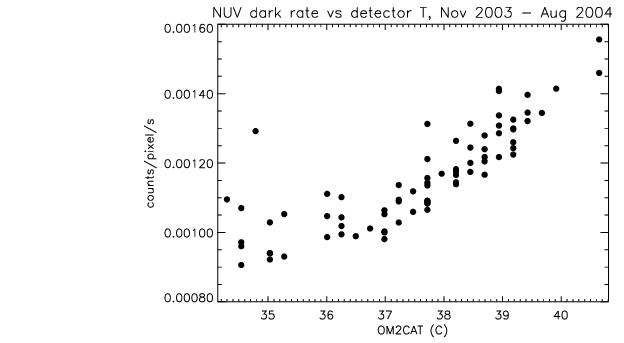
To predict the NUV dark current and subtract it as part of standard processing, the calstis pipeline used a simple temperature dependent relation:
darkrate = norm · 1.805 × 10²⁰ · exp(−12211.8/max(T,Tmin))
Both norm and Tmin are slowly varying functions of time that are empirically adjusted to give a good match to the observed dark rate, and which are tabulated in the temperature dependent dark correction table (TDCTAB) reference file. The temperature for a given observation is taken from the OM2CAT telemetry value, which is included in the extension header of each MAMA observation. This approach usually predicts the dark rate with 5 to 10% accuracy, although the error in individual cases may be substantially larger.
Because 99% of the NUV-MAMA dark current is due to photons hitting the detector, it is appropriate to apply the flat field prior to subtracting the dark current. The dark current varies slowly across the face of the detector, being about 1.25 times higher near the lower left corner (AXIS1, AXIS2 < 300) than at the center. This shape varies with time and temperature enough that subtraction of the scaled dark reference may leave a residual, spatially varying dark current. This is easiest to remove by fitting a low-order two-dimensional function to the background vs. pixel position.
NUV-MAMA Dark Current after SM4
After the Side-2 failure in 2004, STIS was in safe mode with only the survival heaters powered. During this period, the MAMA tubes were at an average temperature of 3.8° C, much lower than the normal operational temperature range of about 29° C to 34° C. We therefore expected to see a temporary increase in the dark current after the post-SM4 recovery of the MAMA tubes due to the increased population of meta-stable states at the colder safe-mode temperature. Detailed modeling led us to expect that the peak dark count rate would not be too much bigger than that seen after SM3a where the MAMAs had been off for about three months. We also expected that any excess would decline with a e-folding time of a week or so, as had been seen previously. This would have allowed the NUV-MAMA dark rate to return to the previous operational range of between 0.0009 and 0.0017 counts/pix/s within about a month of the STIS recovery after SM4.
Figure 7.21: NUV-MAMA Dark Current after SM4.
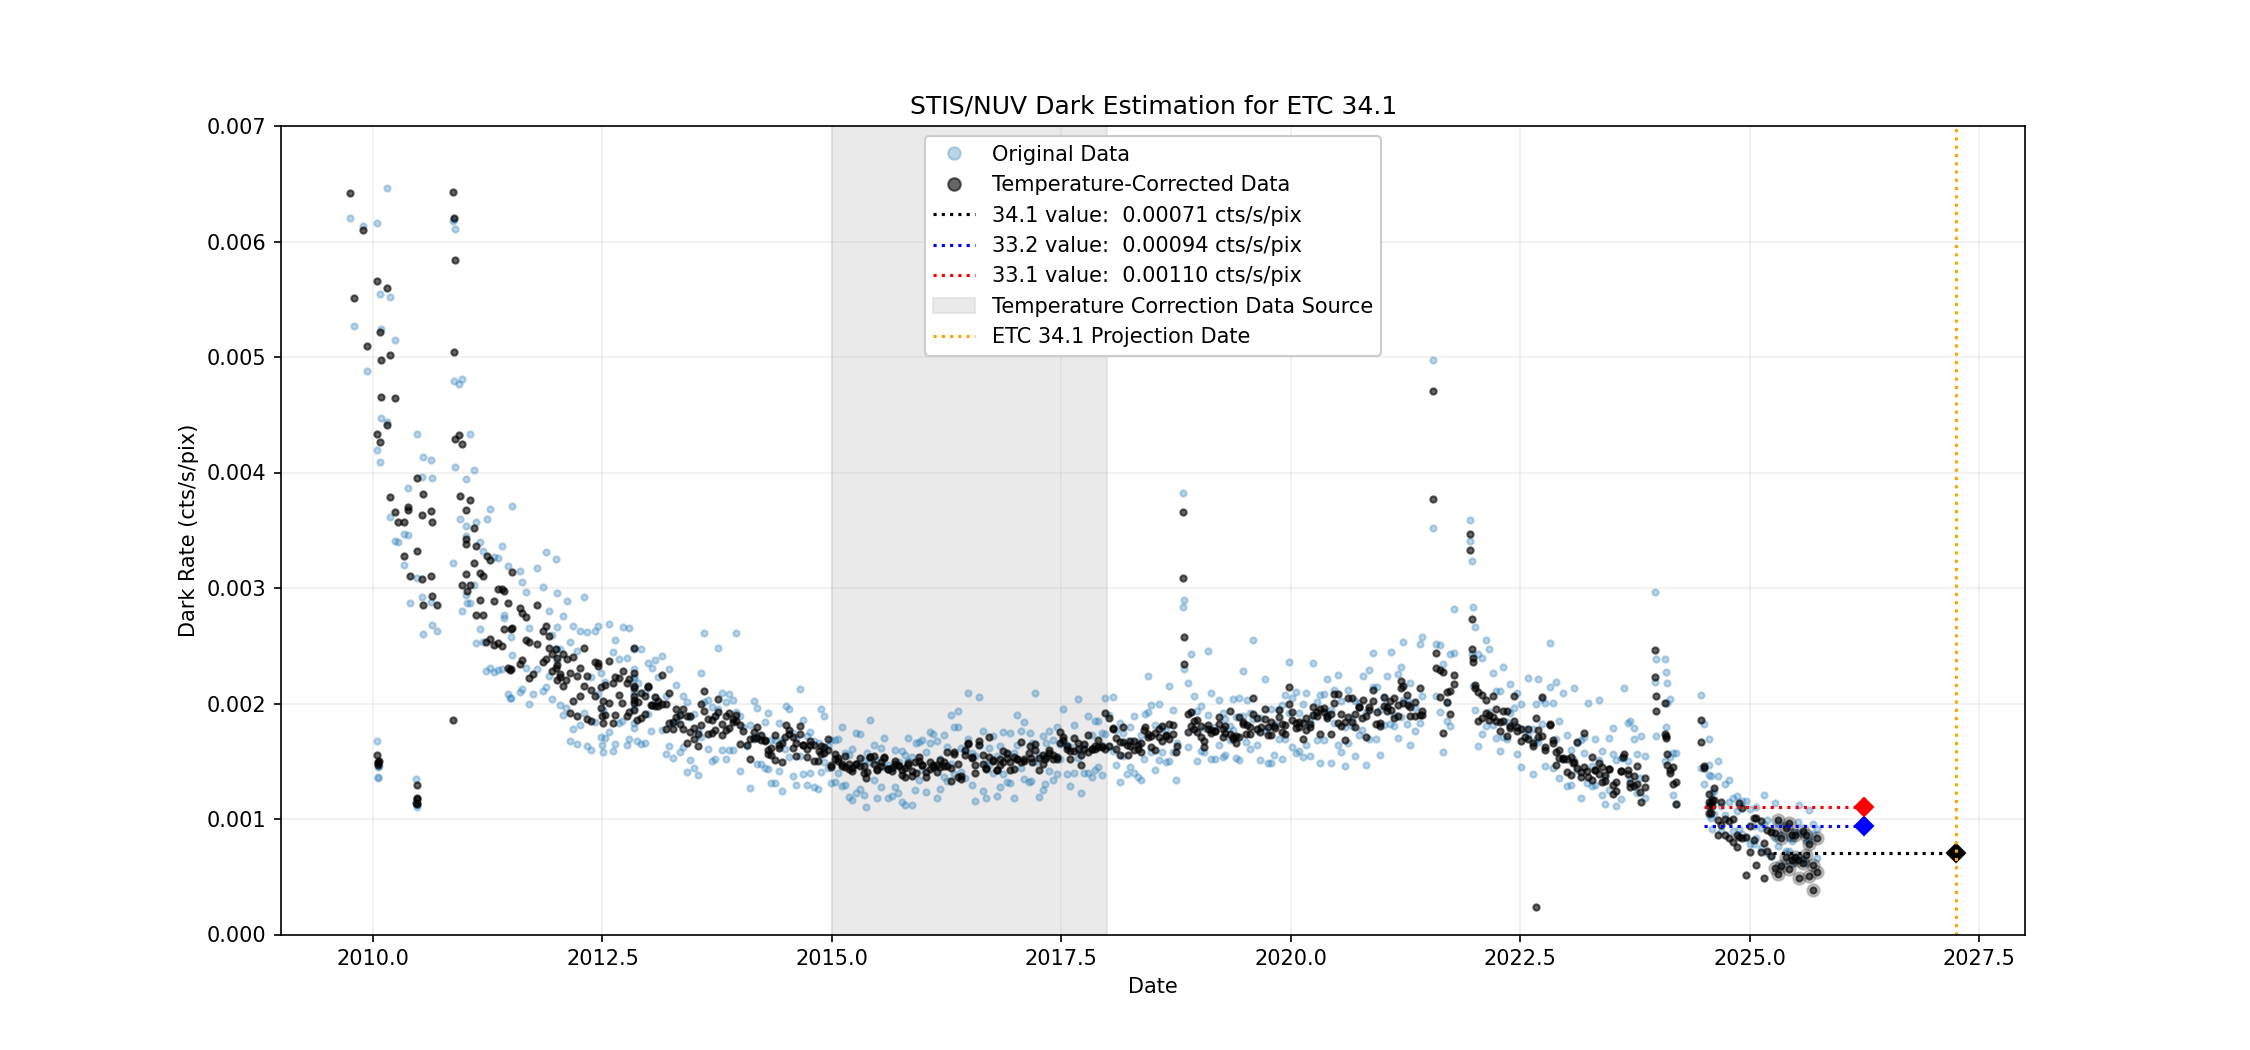
STIS NUV dark current from 2010 to 2025 with estimations for ETC 34.1
For NUV-MAMA data obtained after SM4, an updated relation has been derived to account for both long-term and short-term variations (see STIS ISR 2013-01 for details). The average dark count rate at a given date and detector temperature is estimated as
| \begin{align} count\_rate = & A1 \cdot \exp{(-(D-DATE0)/D1)} + A2 \cdot \exp{(-(D-DATE0)/D2)} \\ &+ TA + TB \cdot (\mathtt{OM2CAT} - TEMP0) + TC \cdot (\mathtt{OM2CAT} - TEMP0)^2 \end{align} |
where D is the Modified Julian Date (MJD) of the observation, DATE0 is the (MJD) starting date of each time segment of the TDCTAB, and TEMP0 is the reference temperature set to 38 ˚C. A1, A2, D1, D2, TA, TB, and TC are the fit parameters that are listed in the TDCTAB along with DATE0 and TEMP0. Once the count\_rate is calculated for a given exposure using the equation above, the scale factor is determined by dividing count\_rate by the mean dark rate of the dark reference image (DARKFILE). The resulting scale factor is then applied to the DARKFILE before the dark subtraction is performed.
FUV-MAMA Dark Current
The FUV-MAMA dark current is substantially lower than that of the NUV-MAMA. Initially, values as low as 7 counts/s across the face of the detector (7 × 10⁻⁶ counts/pix/s) could be routinely expected. However, there is also an intermittent glow that covers a large fraction of the detector (see Figure 7.22). The source of the dark current is not phosphorescence, but is intrinsic to the micro-channel plate array (it was seen in ground testing). This glow can substantially increase the dark current over a large fraction of the detector, and this leads to count rates of up to 300 counts/s integrated across the face of the detector.
An example of the dark current variation across the detector can be seen in Figure 7.22, which is the sum of a number of 1380-second dark frames taken during periods of high dark current. The dark current in the lower right quadrant appears to be stable to within 10% over time. The dark current in the upper left quadrant varies with time and temperature. The total dark current can be approximated by the sum of a constant dark current plus a "glow" image, scaled to the net rate in the upper left quadrant.
Figure 7.22: Dark Current Variation Across FUV-MAMA Detector.
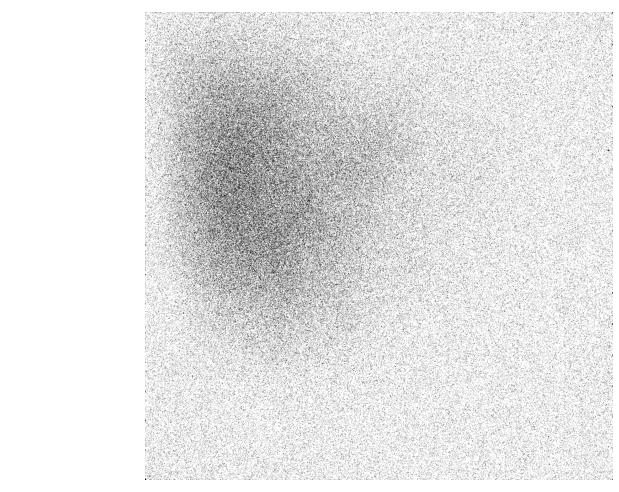
The region in the upper left quadrant has the higher dark current.
Figure 7.23: Post SM-4 FUV-MAMA Dark Monitor Measurements obtained between Jun. 9 and Oct. 1, 2009.
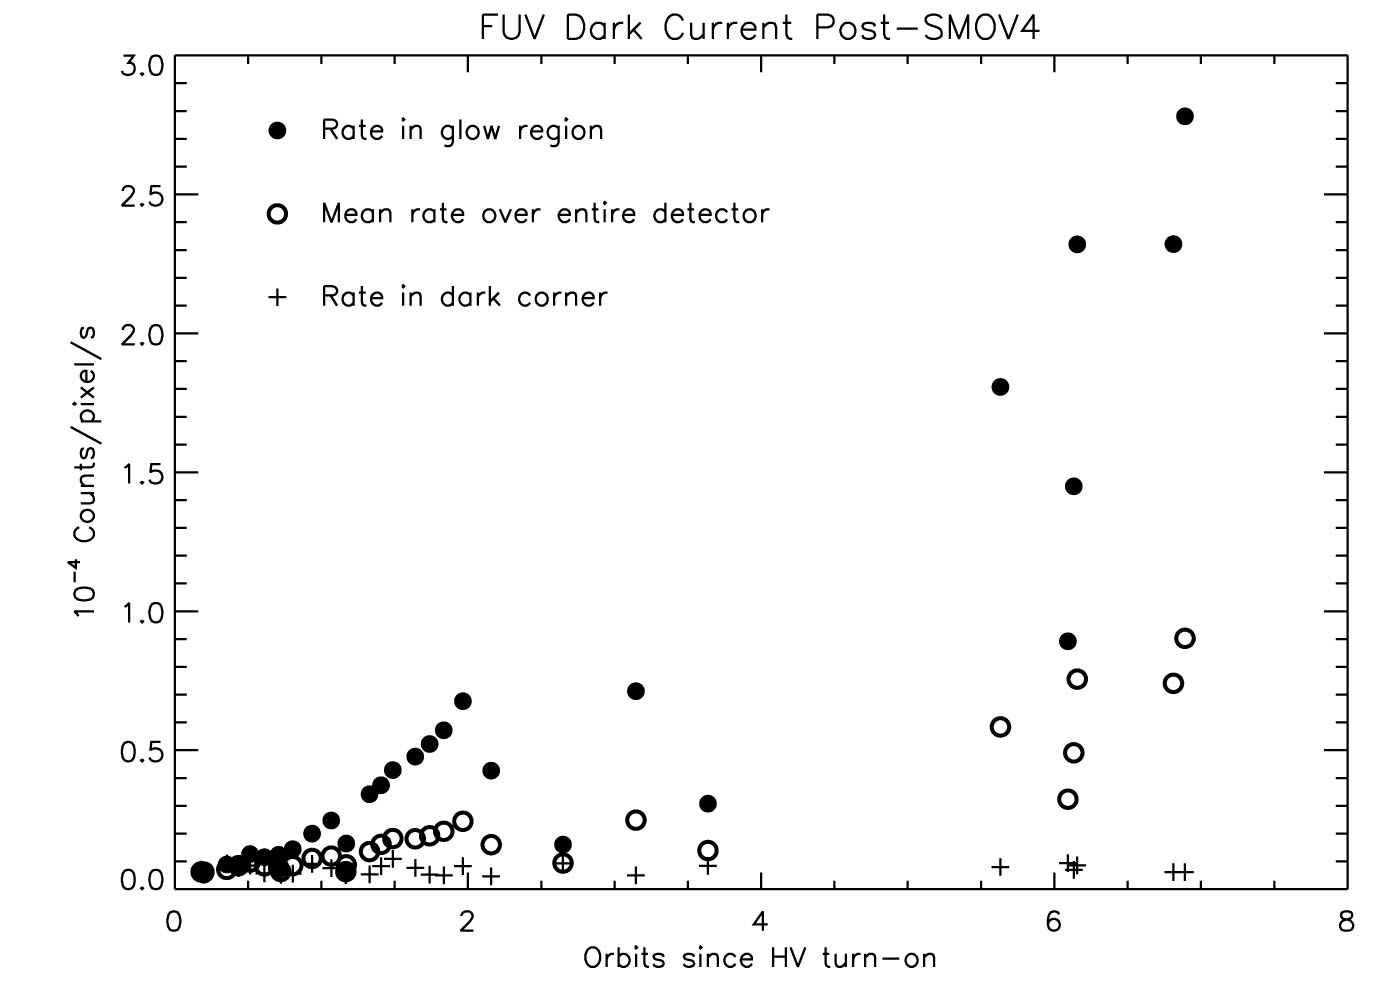
The average count rate for a region in the upper left of the FUV detector that is centered on the bright glow, (pixels [200:400,600:800]), is plotted as a function of the time since the detector high voltage was turned on (filled circles). Also shown is the mean rate for the whole detector (open circles), and the mean rate in the dark corner (pluses), delimited by the subarray [900:1000,10:110].
Figure 7.24: FUV-MAMA Long-Term Dark Current after SM4.
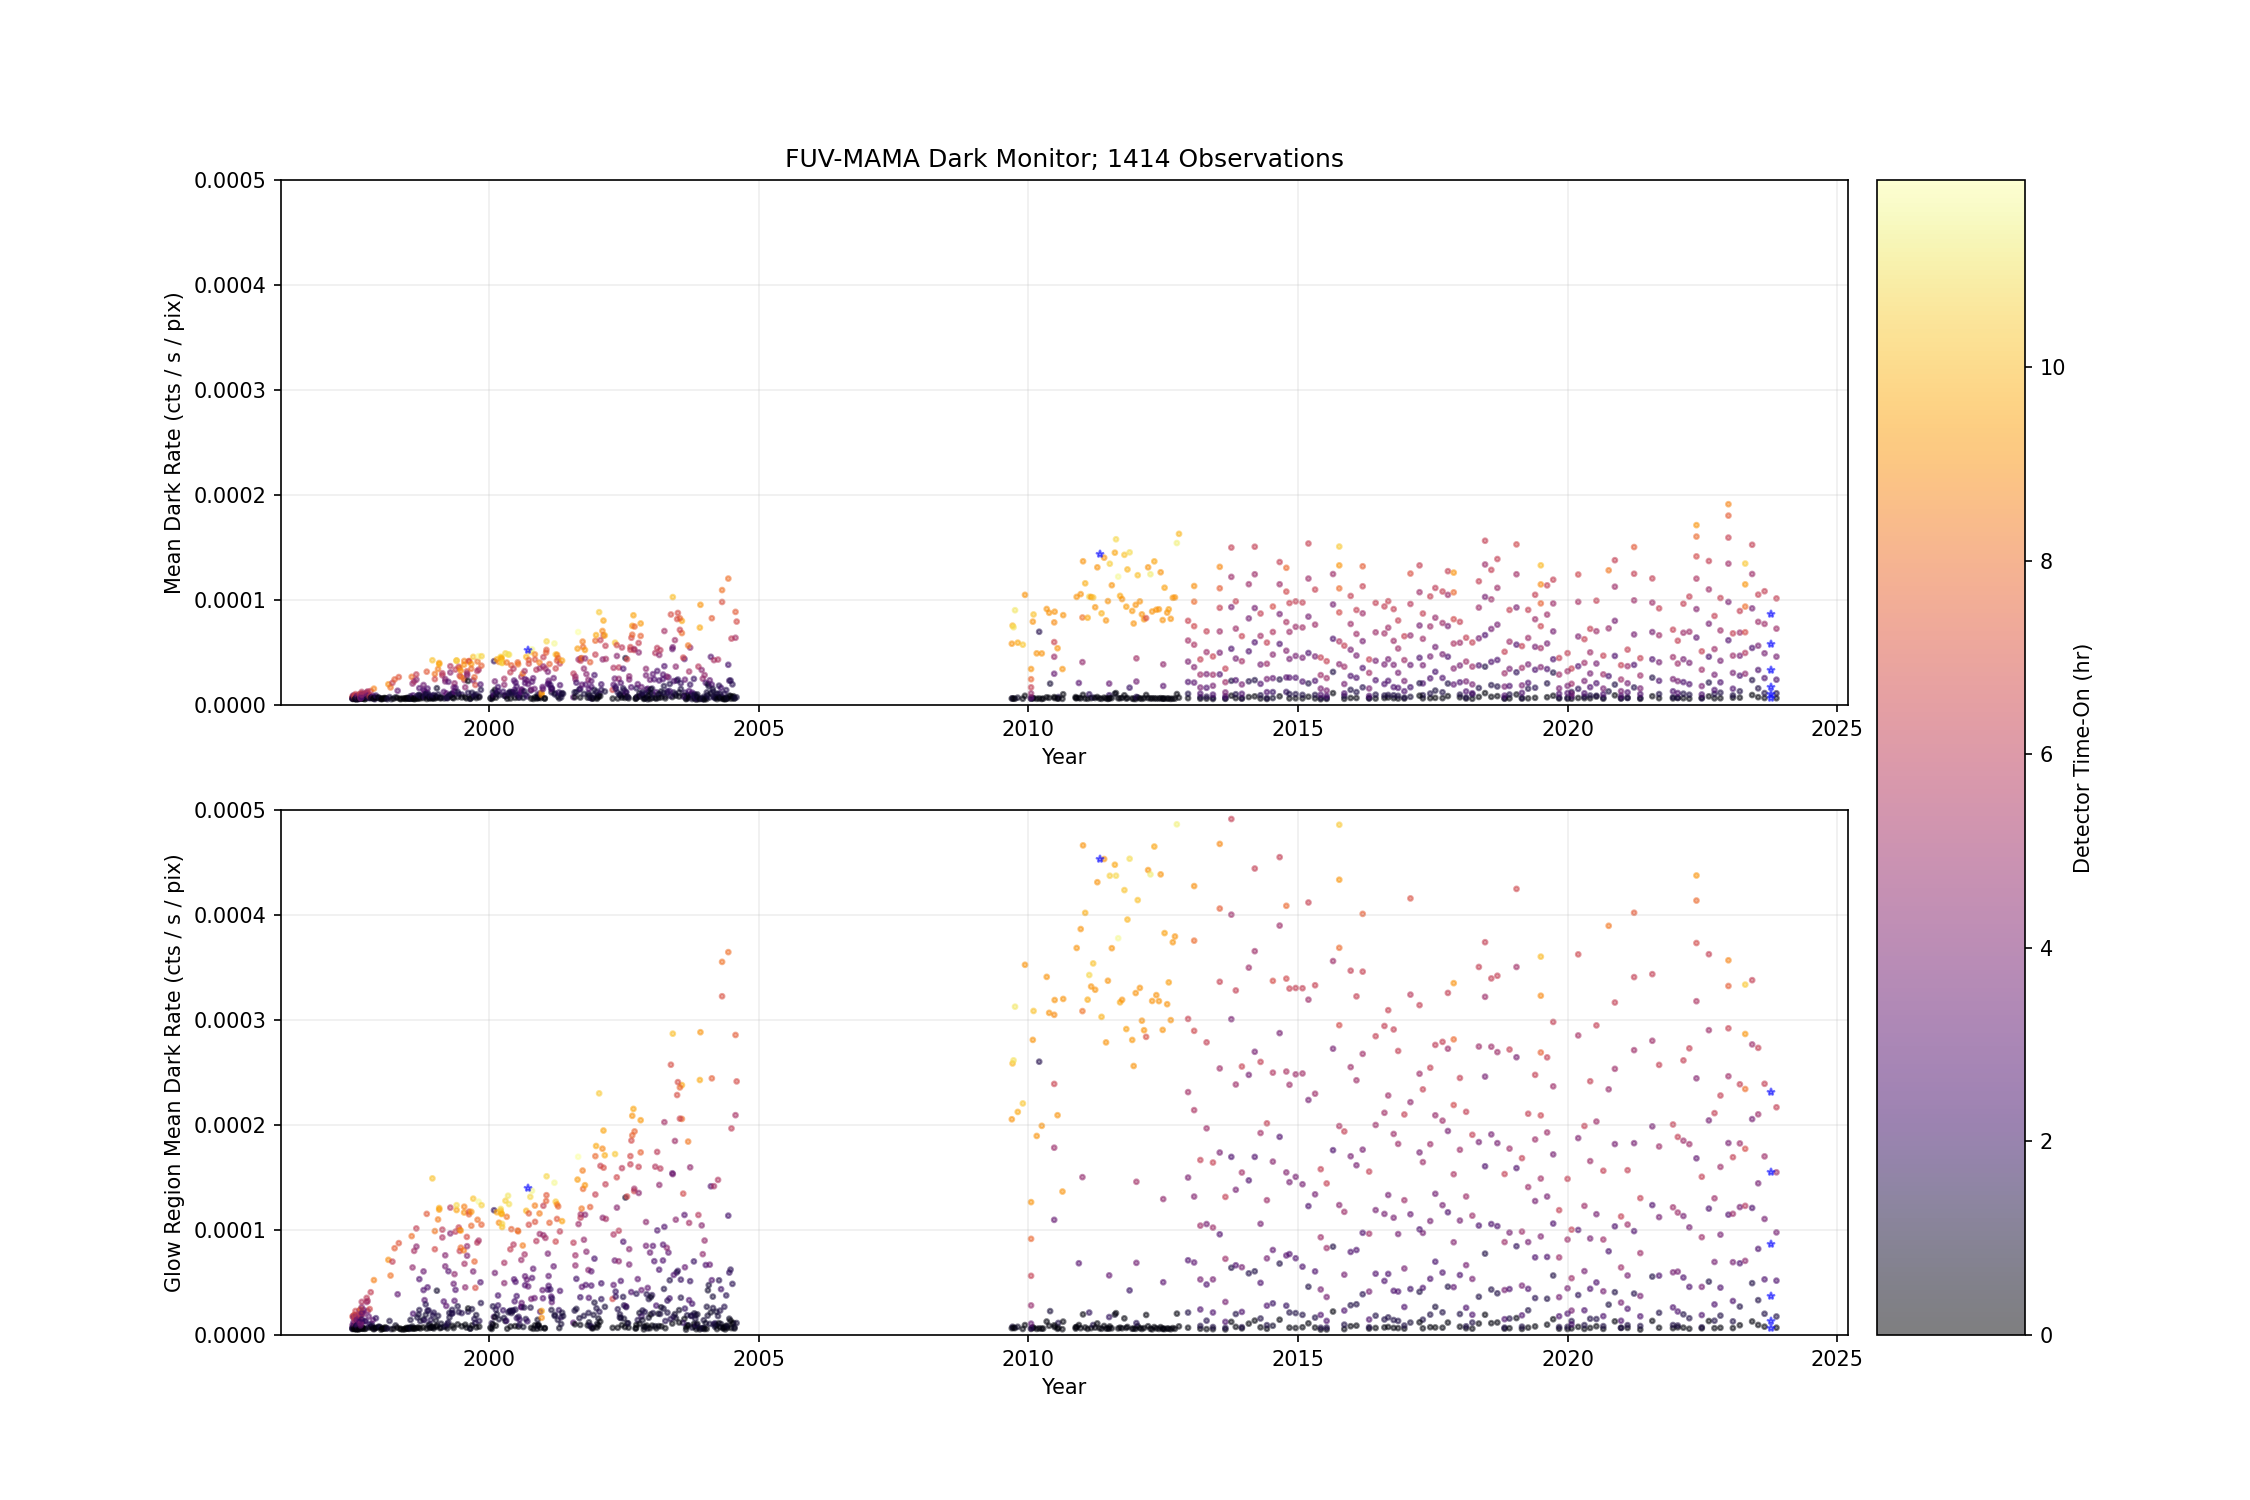
For Cycle 32 planning purposes, we recommend assuming that in the center of the glow region the mean dark current will start with a value near 3.0 × 10⁻⁵ counts/pix/s at the beginning of each SAA-free block of orbits, but will then increase at a rate of about 6 × 10⁻⁵ counts/pix/s/HST-orbit, reaching peak values as high as 5 × 10⁻⁴ counts/pix/s. In the dark corner of the detector, the count rate will remain very low, with a rate near 3.0 × 10⁻⁵ counts/pix/s. The STIS ETC currently defaults to 7.5 × 10⁻⁵ counts/pix/s, as representative of the expected mean rate averaged over the whole detector in the first 2-3 orbits. While the ETC can only reflect the average of the dark current rate, the STIS FUV dark current rate in particular exhibits tremendous variations with the position on the detector. STIS/FUV-MAMA users whose observations are sensitive to dark current (e.g., faint targets) are strongly encouraged to read the corresponding ETC documentation to assess the feasibility of their observations and better constrain the exposure time needed to achieve the required accuracy.
The count rates discussed above refer to the native MAMA detector pixels. When comparing to ETC results these values need to be scaled by the number of pixels included in an extracted spectral "pixel" or resolution element. For observers of bright targets, even the highest FUV-MAMA dark rates will have a negligible impact on data quality. For observers of very faint targets, there are a number of possible mitigation strategies. For spectra of faint point sources, the observer should consider whether one of the COS FUV channels might be a better choice, as these have both much higher overall throughput and much lower detector background than comparable STIS modes. If STIS spectral observations are needed (e.g., to provide higher spatial resolution in the cross dispersion direction), the dark rate can also be minimized by putting the source near the bottom of the FUV-MAMA detector below the worst of the extra detector glow. The "D1" aperture positions are intended for this purpose (see Section 4.2.3). If neither of these strategies is adequate, the proposers should contact the HST Help Desk to discuss whether it may be practical to schedule their observations immediately after the detector high voltage has been ramped up, when the intrinsic detector background is lowest. Because of the need to schedule STIS MAMA operations around the South Atlantic Anomaly (SAA), in practice, the FUV-MAMA detector is usually turned on only one time per day, and there is usually only about one orbit per day available where a detector background close to 1 × 10⁻⁵ c/s/pixel can be expected, so it may not be possible to satisfy all such requests. Justification for this scheduling constraint must be provided under the Special Requirements section of the the Phase I proposal.
Time-varying dark current for the FUV-MAMA is not currently subtracted by the pipeline. Some "average glow" images are available for off-line reduction to reduce the effects of the glow region. Users should contact the HST Help Desk to obtain access to these images.
Because the dark current is so low in the MAMA detectors, a typical STIS FUV-MAMA observation will have less than one count/pix from the dark. It is good to keep this in mind when reducing the data, as various standard measures of background (the median for example) are not good estimates when the data are quantized into just a few values. The best way to estimate the background is to identify hot pixels using the standard reference files, then use an unclipped mean for the remaining pixels in a source-free region of the image.
7.5.3 MAMA Signal-to-Noise Ratio Limitations
MAMA detectors are capable of delivering signal-to-noise ratios (S/N) of the order of 100:1 per spectral resolution element or even higher. Tests in orbit have demonstrated that such high S/N is possible with STIS (Kaiser et al., 1998, Proc. SPIE, 3356, 415; Gilliland, STIS ISR 1998-16.)
High S/N observations of several standard stars were obtained during STIS commissioning, and they were reduced with flats obtained during preflight testing of the detectors. Signal-to-noise ratios of 125 and 150 per spectral resolution element (for an 11 pixel extraction height in the cross dispersion direction) were achieved for the FUV- and NUV-MAMA observations, respectively; see Chapter 12 for a more detailed discussion.
For targets observed at a fixed position on the detector, the signal-to-noise ratio is limited by systematic uncertainties in the small-scale spatial and spectral response of the detector. The MAMA flats show a fixed pattern that is a combination of several effects including beating between the MCP array and the anode pixel array, variations in the charge-cloud structure at the anode, and low-level capacitive cross-coupling between the fine anode elements. Intrinsic pixel-to-pixel variations are 3.9% and 2.8% rms for the FUV- and NUV-MAMA, respectively, in 1024 × 1024 pixel format. In the highres 2048 × 2048 format (Section 3.2.1) the intrinsic variations are much larger. This fixed pattern appears to be stable at the 1–2% level.
The structure of the flat may vary slightly for different modes due to different incidence angles of the incoming photons on the microchannel-plate pores. A possible example of this is shown in Figure 7.25, where for an echelle E140H observation, the measured fluxes in the overlapping spectral range of two adjacent orders are displayed. The individual orders show broad features with widths of 10 to 30 pixels and amplitudes of 2 to 4% that are not reproduced in the other order at the same wavelengths. No corresponding features appear in the flat fields at these locations. These features also appear to be very sensitive to the exact placement of the spectrum on the detector, as other high signal-to-noise observations at the same CENWAVE setting do not show them. At wavelengths that are not covered by multiple spectral orders, the only way to distinguish this kind of detector artifact from a weak feature in the target spectrum is to use some kind of dithering to place the feature at multiple locations on the detector (see Section 12.5.1).
Figure 7.25: Flat-Field Features in a MAMA Spectrum.
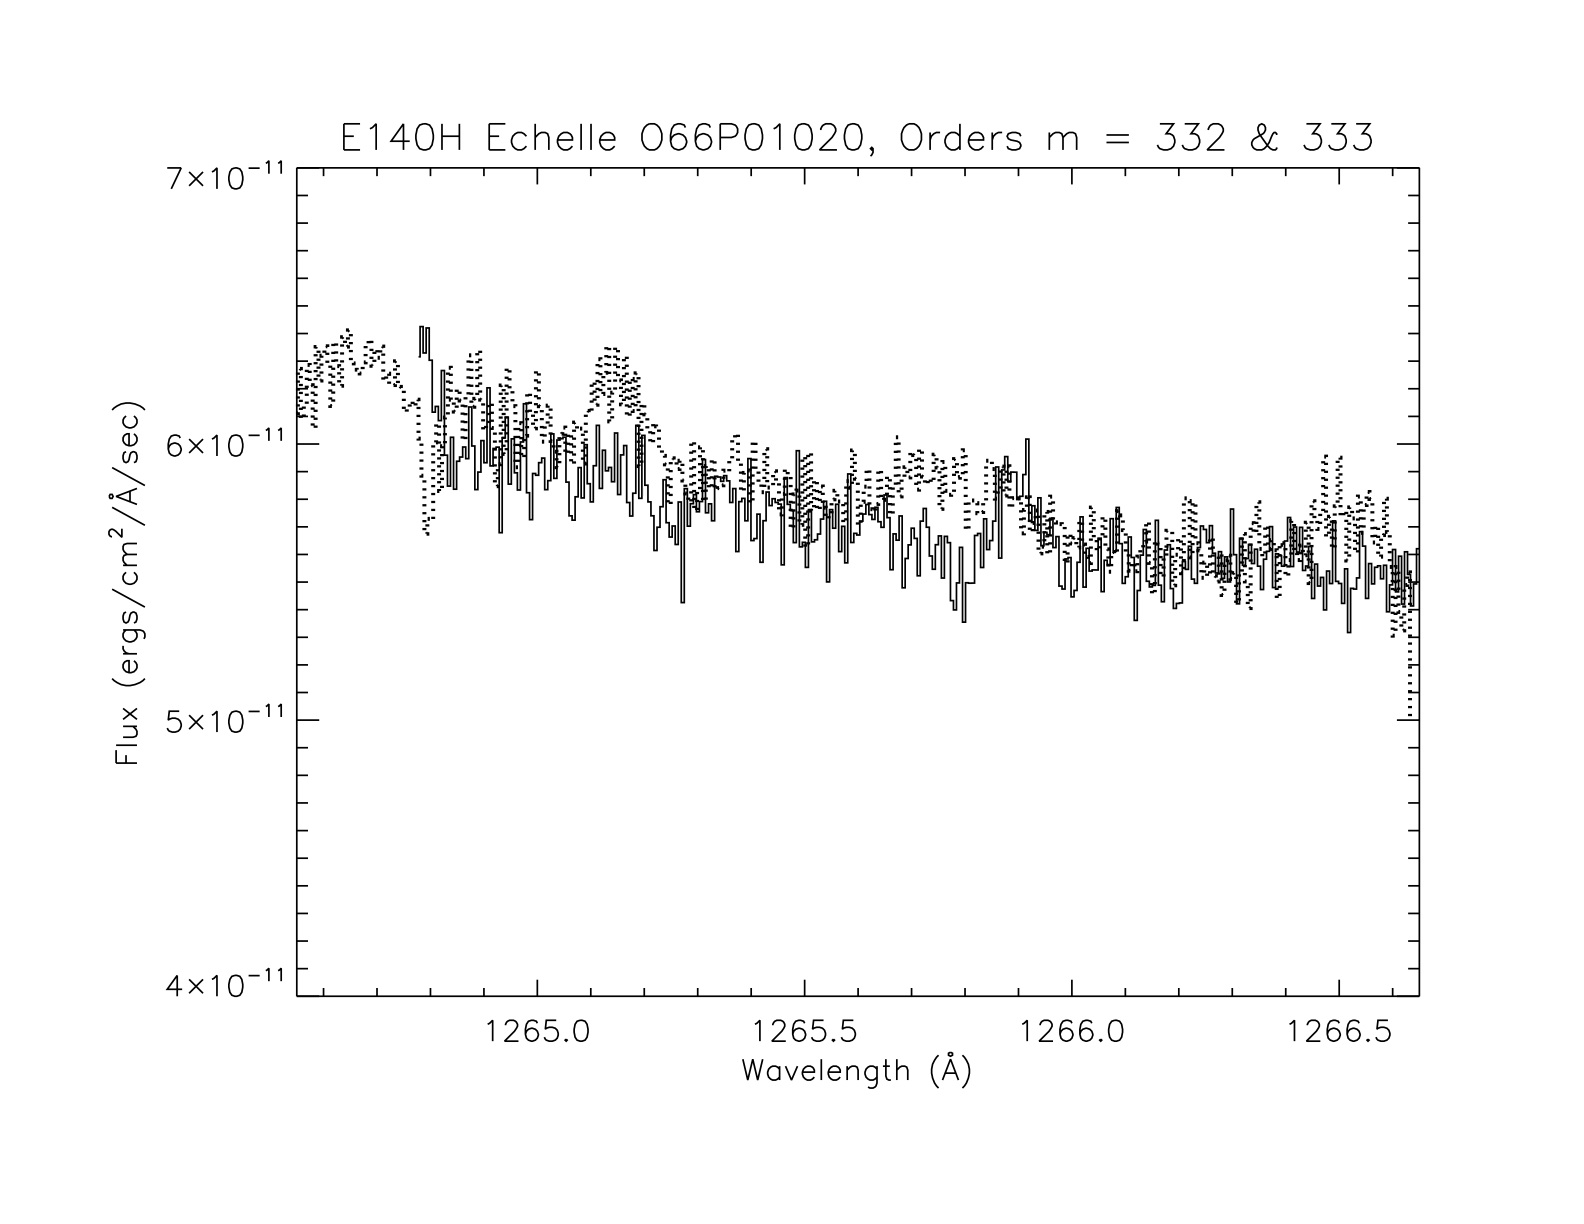
The STIS echelle E140H spectrum dataset O66P01020 of HD 24534 is shown for the wavelength range covering the overlap between spectral orders m = 332 (solid line) and m = 333 (dotted line). A number of weak features appear in only one of the two spectral orders, indicating that these are detector artifacts rather than real features in the stellar spectrum.
FP-SPLIT slits, or use multiple CENWAVE settings with overlapping wavelength ranges; for first-order mode observations, they may wish to dither the target along the slit.Since MAMA observations can be binned in post-observation data processing with no additional signal-to-noise price, the option to obtain MAMA observations with unequal binning (e.g., BINAXIS1=1, BINAXIS2=2) was disabled starting in Cycle 8.
7.5.4 MAMA Nonlinearity
Global
The MAMA detectors exhibit nonlinearity (photon incidence rate not equal to photon count rate) greater than 5% at global (across the entire detector) count rates of order 200,000 counts/s. The nonlinearity can be approximately corrected in post-observation data processing for rates up to ~285,000 counts/s. The MAMA detectors (plus processing software) are not able to count reliably at rates exceeding 285,000 count/s. For this reason and to protect the detectors from damage, observations at such high rates are not allowed (see Section 7.7).
Local
The MAMA detectors remain linear to better than 1% in their counting up to ~220 counts/s/pix for the FUV-MAMA and 340 counts/s/pix for the NUV-MAMA. At higher rates, they experience local (at a given pixel) nonlinearity. The nonlinearity effect is image dependent—that is, the nonlinearity observed at a given pixel depends on the photon rate affecting neighboring pixels. This property makes it impossible to correct reliably for the local nonlinearity in post-observation data processing. In addition, the MAMA detectors are subject to damage at high local count rates (see Section 7.7).
-
STIS Instrument Handbook
- • Acknowledgments
- Chapter 1: Introduction
-
Chapter 2: Special Considerations for Cycle 34
- • 2.1 Impacts of Reduced Gyro Mode on Planning Observations
- • 2.2 STIS Performance Changes Pre- and Post-SM4
- • 2.3 New Capabilities for Cycle 34
- • 2.4 Use of Available-but-Unsupported Capabilities
- • 2.5 Choosing Between COS and STIS
- • 2.6 Scheduling Efficiency and Visit Orbit Limits
- • 2.7 MAMA Scheduling Policies
- • 2.8 Prime and Parallel Observing: MAMA Bright-Object Constraints
- • 2.9 STIS Snapshot Program Policies
- Chapter 3: STIS Capabilities, Design, Operations, and Observations
- Chapter 4: Spectroscopy
- Chapter 5: Imaging
- Chapter 6: Exposure Time Calculations
- Chapter 7: Feasibility and Detector Performance
-
Chapter 8: Target Acquisition
- • 8.1 Introduction
- • 8.2 STIS Onboard CCD Target Acquisitions - ACQ
- • 8.3 Onboard Target Acquisition Peakups - ACQ PEAK
- • 8.4 Determining Coordinates in the International Celestial Reference System (ICRS) Reference Frame
- • 8.5 Acquisition Examples
- • 8.6 STIS Post-Observation Target Acquisition Analysis
- Chapter 9: Overheads and Orbit-Time Determination
- Chapter 10: Summary and Checklist
- Chapter 11: Data Taking
-
Chapter 12: Special Uses of STIS
- • 12.1 Slitless First-Order Spectroscopy
- • 12.2 Long-Slit Echelle Spectroscopy
- • 12.3 Time-Resolved Observations
- • 12.4 Observing Too-Bright Objects with STIS
- • 12.5 High Signal-to-Noise Ratio Observations
- • 12.6 Improving the Sampling of the Line Spread Function
- • 12.7 Considerations for Observing Planetary Targets
- • 12.8 Special Considerations for Extended Targets
- • 12.9 Parallel Observing with STIS
- • 12.10 Coronagraphic Spectroscopy
- • 12.11 Coronagraphic Imaging - 50CORON
- • 12.12 Spatial Scans with the STIS CCD
-
Chapter 13: Spectroscopic Reference Material
- • 13.1 Introduction
- • 13.2 Using the Information in this Chapter
-
13.3 Gratings
- • First-Order Grating G750L
- • First-Order Grating G750M
- • First-Order Grating G430L
- • First-Order Grating G430M
- • First-Order Grating G230LB
- • Comparison of G230LB and G230L
- • First-Order Grating G230MB
- • Comparison of G230MB and G230M
- • First-Order Grating G230L
- • First-Order Grating G230M
- • First-Order Grating G140L
- • First-Order Grating G140M
- • Echelle Grating E230M
- • Echelle Grating E230H
- • Echelle Grating E140M
- • Echelle Grating E140H
- • PRISM
- • PRISM Wavelength Relationship
-
13.4 Apertures
- • 52X0.05 Aperture
- • 52X0.05E1 and 52X0.05D1 Pseudo-Apertures
- • 52X0.1 Aperture
- • 52X0.1E1 and 52X0.1D1 Pseudo-Apertures
- • 52X0.2 Aperture
- • 52X0.2E1, 52X0.2E2, and 52X0.2D1 Pseudo-Apertures
- • 52X0.5 Aperture
- • 52X0.5E1, 52X0.5E2, and 52X0.5D1 Pseudo-Apertures
- • 52X2 Aperture
- • 52X2E1, 52X2E2, and 52X2D1 Pseudo-Apertures
- • 52X0.2F1 Aperture
- • 0.2X0.06 Aperture
- • 0.2X0.2 Aperture
- • 0.2X0.09 Aperture
- • 6X0.2 Aperture
- • 0.1X0.03 Aperture
- • FP-SPLIT Slits 0.2X0.06FP(A-E) Apertures
- • FP-SPLIT Slits 0.2X0.2FP(A-E) Apertures
- • 31X0.05ND(A-C) Apertures
- • 0.2X0.05ND Aperture
- • 0.3X0.05ND Aperture
- • F25NDQ Aperture
- 13.5 Spatial Profiles
- 13.6 Line Spread Functions
- • 13.7 Spectral Purity, Order Confusion, and Peculiarities
- • 13.8 MAMA Spectroscopic Bright Object Limits
-
Chapter 14: Imaging Reference Material
- • 14.1 Introduction
- • 14.2 Using the Information in this Chapter
- 14.3 CCD
- 14.4 NUV-MAMA
-
14.5 FUV-MAMA
- • 25MAMA - FUV-MAMA, Clear
- • 25MAMAD1 - FUV-MAMA Pseudo-Aperture
- • F25ND3 - FUV-MAMA
- • F25ND5 - FUV-MAMA
- • F25NDQ - FUV-MAMA
- • F25QTZ - FUV-MAMA, Longpass
- • F25QTZD1 - FUV-MAMA, Longpass Pseudo-Aperture
- • F25SRF2 - FUV-MAMA, Longpass
- • F25SRF2D1 - FUV-MAMA, Longpass Pseudo-Aperture
- • F25LYA - FUV-MAMA, Lyman-alpha
- • 14.6 Image Mode Geometric Distortion
- • 14.7 Spatial Dependence of the STIS PSF
- • 14.8 MAMA Imaging Bright Object Limits
- Chapter 15: Overview of Pipeline Calibration
- Chapter 16: Accuracies
-
Chapter 17: Calibration Status and Plans
- • 17.1 Introduction
- • 17.2 Ground Testing and Calibration
- • 17.3 STIS Installation and Verification (SMOV2)
- • 17.4 Cycle 7 Calibration
- • 17.5 Cycle 8 Calibration
- • 17.6 Cycle 9 Calibration
- • 17.7 Cycle 10 Calibration
- • 17.8 Cycle 11 Calibration
- • 17.9 Cycle 12 Calibration
- • 17.10 SM4 and SMOV4 Calibration
- • 17.11 Cycle 17 Calibration Plan
- • 17.12 Cycle 18 Calibration Plan
- • 17.13 Cycle 19 Calibration Plan
- • 17.14 Cycle 20 Calibration Plan
- • 17.15 Cycle 21 Calibration Plan
- • 17.16 Cycle 22 Calibration Plan
- • 17.17 Cycle 23 Calibration Plan
- • 17.18 Cycle 24 Calibration Plan
- • 17.19 Cycle 25 Calibration Plan
- • 17.20 Cycle 26 Calibration Plan
- • 17.21 Cycle 27 Calibration Plan
- • 17.22 Cycle 28 Calibration Plan
- • 17.23 Cycle 29 Calibration Plan
- • 17.24 Cycle 30 Calibration Plan
- • 17.25 Cycle 31 Calibration Plan
- • 17.26 Cycle 32 Calibration Plan
- • 17.27 Cycle 33 Calibration Plan
- Appendix A: Available-But-Unsupported Spectroscopic Capabilities
- • Glossary