4.2 First-Order Long-Slit Spectroscopy
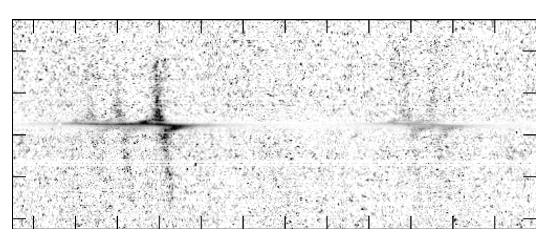
STIS first-order mode long-slit spectroscopy has a wide observing range from the near-infrared (NIR) through the optical and into the UV. Figure 4.6 shows an early STIS result measuring the black hole mass in the nucleus of a nearby galaxy.
II], and [S II] emission lines in the inner gaseous disk. The continuum has been subtracted from the data, and they have been renormalized. (Figure courtesy of Gary Bower and Richard Green, see also Bower et al. 1998, ApJ, 492, L111).4.2.1 Gratings for First-Order Spectroscopy
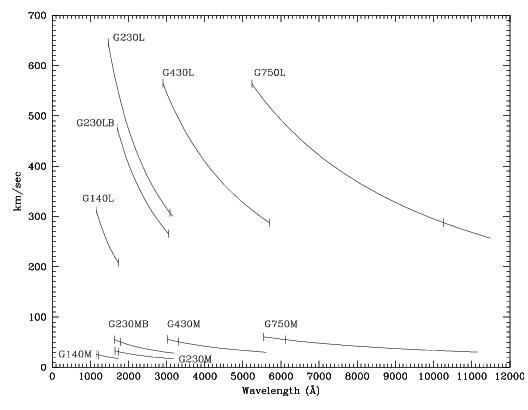
There are 10 first-order gratings available for long-slit spectroscopy, providing resolving powers of ~500–17,000 from the UV at 1150 Å through the NIR at ~10,000 Å. The wavelength coverage and kinematic resolution of the first-order gratings are summarized in Figure 4.7. Briefly:
- For resolutions of ~500 km/s use:
- G140L at 1150–1700 Å.
- G230L (MAMA) or G230LB (CCD) at 1600–3100 Å.
- G430L at 2900–5700 Å.
- G750L at 5250–10,300 Å.
- For resolutions of ~50 km/s use:
- G140M at 1150–1700 Å.
- G230M (MAMA) or G230MB (CCD) at 1650–3100 Å.
- G430M at 3050–5600 Å.
- G750M at 5450–10,100 Å.
4.2.2 Slits for First-Order Spectroscopy
Supported for use with the first-order gratings are long slits of widths 0.05, 0.1, 0.2, 0.5 and 2.0 arcseconds (in the dispersion direction), and lengths of 52 arcseconds (as projected on the CCD detector) or 25 arcseconds (as projected on the MAMA detectors) for the MAMA low-resolution, first-order gratings (G230L and G140L) and 28 arcseconds for the MAMA intermediate-resolution, first-order gratings (G230M and G140M).1 Note that the 0.1 arcsecond width matches the 2 pixel resolution of the CCD, while the 0.05 arcsecond width does so for the MAMAs, providing maximum spectral resolution. The 0.2 arcsecond-wide slit is the general utility slit used most often; it provides a good compromise between resolution and throughput. Programs requiring accurate absorption line measurements in continuum sources should always use slits of widths ≤0.2 arcsecond, since for larger apertures the spectral purity is significantly degraded by the telescope plus instrumental point spread function (PSF); see Section 13.7. Finally, we expect the wider 0.5 and 2.0 arcsecond slits to be used predominantly in photon-starved UV observations of extended sources, but provide them for use in the optical as well to assure that line-ratio studies with coverage from the UV to the optical can sample the same physical region on the sky. Additionally, they are the most photometric slits as their throughput is least affected by centering and telescope breathing. Of course, observations of extended sources with wide slits will have correspondingly degraded spectral resolutions (see Table 13.41 and Table 13.42).
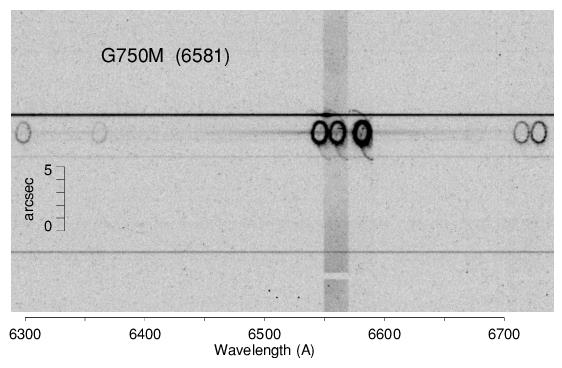
The first-order gratings can also be used "slitless" to obtain two-dimensional spectra of targets, or pseudo "images." Slitless spectroscopic data will not be fully calibrated by the STScI pipeline, and it will require directed post-observation data processing by the user, as ambiguous overlap of wavelengths from different parts of sources can occur in the image (see Section 12.1). Figure 4.8 shows an example of the use of the 52X2 slit with the G750M grating to obtain such a series of emission line images of SN1987A.
I], Hα, [N II], and [S II]. Diffuse Hα emission from the LMC fills the 52 × 2 slit, and broad Hα emission from the SN is also visible. The continua of stars produce the horizontal bands. The image shown is a 950 × 450 subsection of the 1024 × 1024 image. (Figure courtesy of Jason Pun and George Sonneborn, see also Sonneborn et al. 1998, ApJ, 492, L139).FUV-MAMA first-order modes, the projection of the slit image on the detector has deliberately been shifted by ~110-140 low-resolution pixels (or ~3.25 arcseconds) below center (versus the above center offset used prior to March 15, 1999), to avoid having the spectrum fall on the shadow of the repeller wire (see also Section 7.6 and Section 11.1.2). This shift applies to all data taken with the G140L and G140M gratings, regardless of the aperture used.Note also that the monthly offsetting of MAMA first-order spectral modes can additionally shift the projection of the spectrum on the detector by up to ~±40 low-resolution AXIS2 pixels (about 1 arcsecond). See Section 7.6 for further discussion. Beginning in Cycle 30, users can request disabling the monthly offsets as an available-but-unsupported mode for those programs requiring the strictest control of instrument systematics.
The 0.2X0.2 aperture is now supported for use with all first-order gratings. This is intended to be used for observations where a long slit might allow light from another target into the aperture, thereby creating either contamination problems or bright object concerns. Note, however, that the use of such a short slit will make background subtraction more difficult, especially at wavelengths where airglow lines are important.
4.2.3 STIS Pseudo-Aperture Positions
A number of "pseudo-aperture" positions have been defined for STIS spectroscopy, which allow a target to be placed at positions other than the geometrical center of the aperture without the need to specify a POS TARG. These include the E1 and E2 positions, which place the target closer to the CCD readout to minimize losses due to charge transfer inefficiency (CTI), and the D1 aperture positions, which can be used to place a faint target near the bottom of the FUV-MAMA detector, where the dark current is significantly reduced. Note that the E1 positions may be used with any first-order STIS CCD grating. The E2 positions may only be used with G750M and G750L. The D1 positions may only be used with the G140L and G140M gratings, except for the 52X0.1D1 and 52X0.05D1 positions, which are also supported for CCD ACQ/PEAK observations.
Here we describe these pseudo-aperture locations and their intended purposes. Note that all of these pseudo-apertures define new positions within existing apertures. As a result, the APERTURE keyword in the headers of the archived data will contain the name of the parent aperture, while the PROPAPER keyword will contain the aperture name specified in the Phase II proposal. For example, if the Phase II proposal requests the 52X0.1D1 position, the APERTURE keyword will be set to 52X0.1, while the PROPAPER keyword will be 52X0.1D1.
E1 Aperture Positions to Decrease CTE Loss
As the STIS CCD detector has accumulated radiation damage over time, the Charge Transfer Efficiency (CTE) has decreased (see Section 7.3.7). For faint sources observed near the center of the CCD detector, this can result in the loss of 18% or more of the detected signal during the readout. Since the amount of these CTE losses depends on both the observed signal and background count, they can significantly affect the shape of a measured spectrum. The STIS pipeline currently corrects for CTE losses using an empirical correction described in STIS ISR 2006-03. CTE also results in a value for the effective dark current that is about 60% larger at the center of the detector than it is near the E1 positions (see Figure 7.8). To combat these effects, the STIS team has also created a stand-alone software package to apply pixel-based CTE loss corrections to CCD data. More information can be found in STIS ISRs 2015-04 and 2015-05, Section 7.3.9, and the CTE correction webpage. At present, these pixel-based corrections are not automatically applied in the STScI STIS data pipeline.
CTE effects can also be significantly ameliorated by moving the location of the source image on the detector closer to the amplifier, thereby reducing the number of parallel transfers that occur during the readout. To this end, so-called E1 aperture positions (52X0.05E1, 52X0.1E1, 52X0.2E1, 52X0.5E1, and 52X2E1) have been defined near row 900 on the STIS CCD detector for use with the STIS first-order gratings. The use of these aperture positions is strongly recommended for the observation of faint sources. For high signal-to-noise observations of bright targets we recommend continuing to use the regular aperture positions near the center of the detector. Extensive calibration observations were performed during Cycles 11 and 12 to ensure that the calibration at the E1 aperture positions is of the same quality as it is for sources observed at the usual location on the STIS CCD. There are on-going flux monitoring programs continue to obtain spectra at E1 to track any changes. Further information regarding the use of the E1 aperture positions can be found in Section 7.3.8.
E2 Aperture Positions for Better Fringe Flats
In 1999, the E1 aperture positions were introduced to allow first-order CCD spectra to be positioned at row 900 near the CCD readout amplifier, where the Charge Transfer Efficiency (CTE) is higher than at the standard positions. This works well; however, for G750L and G750M spectra taken near row 900, the fringe flats have to be done using the 52X0.1 aperture rather than the 0.3X0.09 aperture, which is usually used for fringe flats near the center of the detector (see Section 11.2.3 for a more detailed discussion of infrared [IR] fringe flats). Unfortunately, the 52X0.1 slit is shifted by about one pixel in the dispersion direction from the centers of the wider long slits. This misalignment reduces the accuracy of fringe correction.
To address this, we have defined three E2 aperture locations: 52X0.2E2, 52X0.5E2, and 52X2E2. When these apertures are specified, the target is placed off-center in the slit, at a position coincident with the 52X0.1E1 aperture. This improves the match between the fringes in the target and lamp spectra. Be aware, however, that the 52X0.2E2 aperture position is offset sufficiently from the physical center of the aperture that there will be noticeable changes in the aperture throughput and line-spread function.
These E2 aperture positions should only be used for ACCUM exposures with the G750L or G750M gratings when fringe flats with the 52X0.1 aperture are also being done. If a peakup is desired before using the E2 apertures, the peakup should be done using the 52X0.1E1 aperture.
D1 Aperture Positions for Low FUV Dark Current
The FUV-MAMA suffers from an irregular dark glow that varies unpredictably in intensity. When this glow is absent, the typical dark rate of the FUV-MAMA detector is about 6 × 10⁻⁶ counts/pix/s. When the glow is strong, it can enhance the dark current to as much as 1 × 10⁻⁴ counts/pix/s over a large fraction of the detector. For first-order spectra, the best way to minimize this extra dark current is to put the target at a location on the detector where the extra dark current is small.
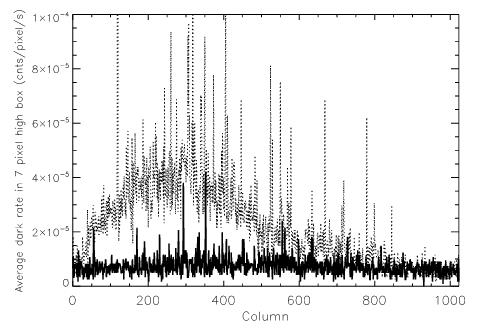
For first-order spectra of faint sources less than about 1 arcsecond in angular extent, we recommend that this be done by placing the target several arcseconds above the bottom edge of the FUV-MAMA detector. Since for the G140L and G140M the regular aperture positions are normally projected about 3.25 arcseconds below the center (in order to avoid the shadow of the FUV-MAMA repeller wire), an additional displacement is required in the cross-dispersion, or y, direction. This can reduce the extra dark current by up to a factor of 6 (see Figure 4.9). For G140L observations, the default D1 position will place the spectrum about 2.7 arcseconds above the bottom edge of the detector. The monthly offsetting of the spectral location (see Section 7.6) will shift this by as much as ±1 arcsecond. Because of the larger cross dispersion plate scale of the G140M, variations of the default spectral position for different G140M CENWAVE values, and the monthly spectral offsetting, G140M spectra taken at the D1 aperture positions will be located 3 to 5 arcseconds above the bottom edge of the FUV-MAMA detector.
Note that the background subtraction might be more difficult due to the proximity to the edge of the detector, depending on the extent of the target. Therefore, use of this position is recommended only for objects sufficiently faint that the FUV-MAMA dark current is the major limitation on the achievable accuracy.
The D1 apertures listed in the Table 4.3 are supported for first-order spectroscopic ACCUM or TIME-TAG observations with the G140L and G140M. The 52X0.1D1 and 52X0.05D1 apertures are also supported for CCD ACQ/PEAK observations. Note that the 25MAMAD1, F25QTZD1, and F25SRF2D1 aperture locations are intended only for first-order FUV-MAMA slitless spectroscopy. Users who wish to offset faint imaging targets to avoid the worst of the FUV dark current should look at Figure 7.21 or consult with a STIS Instrument Scientist via the Help Desk.
FUV-MAMA mean dark current (dotted line) as a function of the detector column number (in a seven pixel high extraction box near the standard extraction position located 3 arcseconds below the detector center) is compared with that in a box near the D1 pseudo-aperture position 6.8 arcseconds further down (solid line). The data used are an average of 125 dark monitor exposures, each of 1380 seconds, taken between May 2003 and August 2004. This illustrates the typical reduction in the dark current affecting first-order spectra that will result from putting the target 2 arcseconds above the bottom of the detector.Sensitivity Differences at the Pseudo-Aperture Positions
The throughputs at the E1 and D1 pseudo-apertures, as functions of wavelength, are generally similar to those at the corresponding nominal (central) positions. However, there is some vignetting of the gratings that changes the overall system throughput slightly with varying position along the long slits. At the E1 positions, the overall low-dispersion throughputs are decreased by 2–3%, while at the D1 position the G140L throughput is increased by 2–7%. For the medium-resolution grating G140M at the D1 position, the throughput changes are ~3% at 1272Å and ~±10% at 1567Å (see ISR 2022-06). Other G140M CENWAVE values are expected to have throughput differences comparable to the 3-10% range measured for those two settings. Since these throughput changes do not depend on the wavelength alone, but also on the grating and the position on the detector, they are handled in the pipeline calibration by the use of low-order flat fields (LFLT files) rather than by a change in the aperture throughput curve. Note, however, that only G140L has this throughput variation corrected by its LFLT file. The LFLT files for G140M modes are currently single valued (value = 1.0) everywhere.
The throughput of the 52X2E2 and 52X0.5E2 positions are similar to that of the corresponding E1 positions. For the 52X0.2E2 aperture, the throughput is about 20% lower than for the 52X0.2E1 position.
Table 4.3: Gratings Supported with STIS Pseudo-aperture Positions.
Pseudo-aperture | Science Gratings | Supported Peak-up Elements |
|---|---|---|
| CCD first-order | CCD first-order, CCD Mirror |
| CCD first-order | CCD first-order, CCD Mirror |
| CCD first-order | none (52X0.1E1 recommended) |
| CCD first-order | none |
| CCD first-order | none |
|
| none ( |
|
| none |
|
| none |
|
| CCD first-order, CCD Mirror |
|
| CCD first-order, CCD Mirror |
|
| none |
|
| none |
|
| none |
|
| none |
|
| none |
|
| none |
4.2.4 Detailed First-Order Spectroscopic Information
The properties of each of the first-order gratings are described in detail, grating by grating, in Chapter 13; see the first column of Table 4.1 for links to the appropriate page for each grating.
The detailed properties of the long slits (e.g., throughputs and line spread as functions of wavelength), plate scales, and encircled energies for the first-order gratings are presented under Section 13.4, Section 13.5, and Section 13.6.
1 The MAMA first-order modes have varying spatial plate scales; see Chapter 13.
-
STIS Instrument Handbook
- • Acknowledgments
- Chapter 1: Introduction
-
Chapter 2: Special Considerations for Cycle 33
- • 2.1 Impacts of Reduced Gyro Mode on Planning Observations
- • 2.2 STIS Performance Changes Pre- and Post-SM4
- • 2.3 New Capabilities for Cycle 33
- • 2.4 Use of Available-but-Unsupported Capabilities
- • 2.5 Choosing Between COS and STIS
- • 2.6 Scheduling Efficiency and Visit Orbit Limits
- • 2.7 MAMA Scheduling Policies
- • 2.8 Prime and Parallel Observing: MAMA Bright-Object Constraints
- • 2.9 STIS Snapshot Program Policies
- Chapter 3: STIS Capabilities, Design, Operations, and Observations
- Chapter 4: Spectroscopy
- Chapter 5: Imaging
- Chapter 6: Exposure Time Calculations
- Chapter 7: Feasibility and Detector Performance
-
Chapter 8: Target Acquisition
- • 8.1 Introduction
- • 8.2 STIS Onboard CCD Target Acquisitions - ACQ
- • 8.3 Onboard Target Acquisition Peakups - ACQ PEAK
- • 8.4 Determining Coordinates in the International Celestial Reference System (ICRS) Reference Frame
- • 8.5 Acquisition Examples
- • 8.6 STIS Post-Observation Target Acquisition Analysis
- Chapter 9: Overheads and Orbit-Time Determination
- Chapter 10: Summary and Checklist
- Chapter 11: Data Taking
-
Chapter 12: Special Uses of STIS
- • 12.1 Slitless First-Order Spectroscopy
- • 12.2 Long-Slit Echelle Spectroscopy
- • 12.3 Time-Resolved Observations
- • 12.4 Observing Too-Bright Objects with STIS
- • 12.5 High Signal-to-Noise Ratio Observations
- • 12.6 Improving the Sampling of the Line Spread Function
- • 12.7 Considerations for Observing Planetary Targets
- • 12.8 Special Considerations for Extended Targets
- • 12.9 Parallel Observing with STIS
- • 12.10 Coronagraphic Spectroscopy
- • 12.11 Coronagraphic Imaging - 50CORON
- • 12.12 Spatial Scans with the STIS CCD
-
Chapter 13: Spectroscopic Reference Material
- • 13.1 Introduction
- • 13.2 Using the Information in this Chapter
-
13.3 Gratings
- • First-Order Grating G750L
- • First-Order Grating G750M
- • First-Order Grating G430L
- • First-Order Grating G430M
- • First-Order Grating G230LB
- • Comparison of G230LB and G230L
- • First-Order Grating G230MB
- • Comparison of G230MB and G230M
- • First-Order Grating G230L
- • First-Order Grating G230M
- • First-Order Grating G140L
- • First-Order Grating G140M
- • Echelle Grating E230M
- • Echelle Grating E230H
- • Echelle Grating E140M
- • Echelle Grating E140H
- • PRISM
- • PRISM Wavelength Relationship
-
13.4 Apertures
- • 52X0.05 Aperture
- • 52X0.05E1 and 52X0.05D1 Pseudo-Apertures
- • 52X0.1 Aperture
- • 52X0.1E1 and 52X0.1D1 Pseudo-Apertures
- • 52X0.2 Aperture
- • 52X0.2E1, 52X0.2E2, and 52X0.2D1 Pseudo-Apertures
- • 52X0.5 Aperture
- • 52X0.5E1, 52X0.5E2, and 52X0.5D1 Pseudo-Apertures
- • 52X2 Aperture
- • 52X2E1, 52X2E2, and 52X2D1 Pseudo-Apertures
- • 52X0.2F1 Aperture
- • 0.2X0.06 Aperture
- • 0.2X0.2 Aperture
- • 0.2X0.09 Aperture
- • 6X0.2 Aperture
- • 0.1X0.03 Aperture
- • FP-SPLIT Slits 0.2X0.06FP(A-E) Apertures
- • FP-SPLIT Slits 0.2X0.2FP(A-E) Apertures
- • 31X0.05ND(A-C) Apertures
- • 0.2X0.05ND Aperture
- • 0.3X0.05ND Aperture
- • F25NDQ Aperture
- 13.5 Spatial Profiles
- 13.6 Line Spread Functions
- • 13.7 Spectral Purity, Order Confusion, and Peculiarities
- • 13.8 MAMA Spectroscopic Bright Object Limits
-
Chapter 14: Imaging Reference Material
- • 14.1 Introduction
- • 14.2 Using the Information in this Chapter
- 14.3 CCD
- 14.4 NUV-MAMA
-
14.5 FUV-MAMA
- • 25MAMA - FUV-MAMA, Clear
- • 25MAMAD1 - FUV-MAMA Pseudo-Aperture
- • F25ND3 - FUV-MAMA
- • F25ND5 - FUV-MAMA
- • F25NDQ - FUV-MAMA
- • F25QTZ - FUV-MAMA, Longpass
- • F25QTZD1 - FUV-MAMA, Longpass Pseudo-Aperture
- • F25SRF2 - FUV-MAMA, Longpass
- • F25SRF2D1 - FUV-MAMA, Longpass Pseudo-Aperture
- • F25LYA - FUV-MAMA, Lyman-alpha
- • 14.6 Image Mode Geometric Distortion
- • 14.7 Spatial Dependence of the STIS PSF
- • 14.8 MAMA Imaging Bright Object Limits
- Chapter 15: Overview of Pipeline Calibration
- Chapter 16: Accuracies
-
Chapter 17: Calibration Status and Plans
- • 17.1 Introduction
- • 17.2 Ground Testing and Calibration
- • 17.3 STIS Installation and Verification (SMOV2)
- • 17.4 Cycle 7 Calibration
- • 17.5 Cycle 8 Calibration
- • 17.6 Cycle 9 Calibration
- • 17.7 Cycle 10 Calibration
- • 17.8 Cycle 11 Calibration
- • 17.9 Cycle 12 Calibration
- • 17.10 SM4 and SMOV4 Calibration
- • 17.11 Cycle 17 Calibration Plan
- • 17.12 Cycle 18 Calibration Plan
- • 17.13 Cycle 19 Calibration Plan
- • 17.14 Cycle 20 Calibration Plan
- • 17.15 Cycle 21 Calibration Plan
- • 17.16 Cycle 22 Calibration Plan
- • 17.17 Cycle 23 Calibration Plan
- • 17.18 Cycle 24 Calibration Plan
- • 17.19 Cycle 25 Calibration Plan
- • 17.20 Cycle 26 Calibration Plan
- • 17.21 Cycle 27 Calibration Plan
- • 17.22 Cycle 28 Calibration Plan
- • 17.23 Cycle 29 Calibration Plan
- • 17.24 Cycle 30 Calibration Plan
- • 17.25 Cycle 31 Calibration Plan
- • 17.26 Cycle 32 Calibration Plan
- Appendix A: Available-But-Unsupported Spectroscopic Capabilities
- • Glossary


