5.1 Imaging Overview
STIS can be used to obtain images of undispersed light in the optical and ultraviolet (UV). When STIS is used in imaging mode, the appropriate clear or filtered aperture on the slit wheel is rotated into position, and a mirror on the Mode Selection Mechanism (MSM) is moved into position (see Figure 3.1).
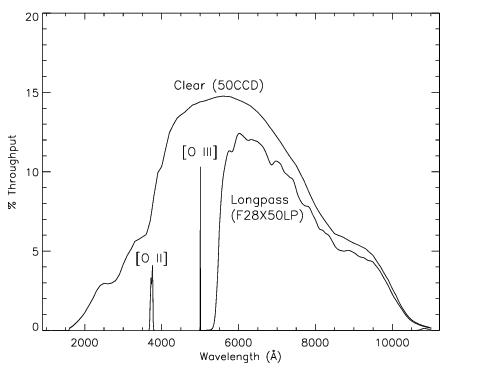
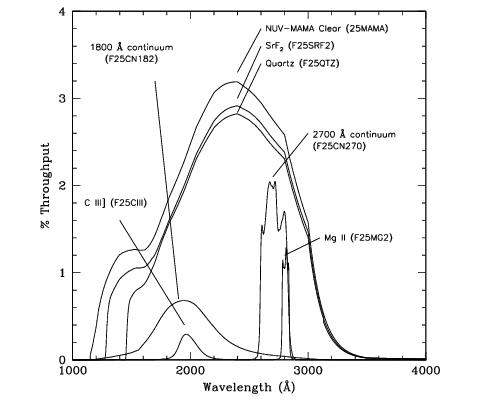
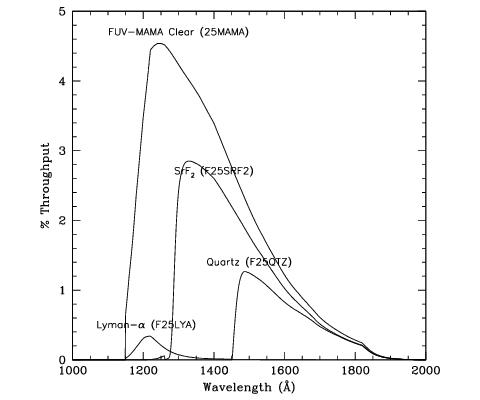
Table 5.1 provides a complete summary of the clear and filtered apertures available for imaging with each detector. In Figure 5.5 through Figure 5.13 we show the integrated system throughputs.
Table 5.1: STIS Imaging Capabilities
| Aperture Name | Filter | Pivot Wavelength1 (λc in Å) | FWHM2 (Δλ in Å) | Field of View (arcsec2) | Detector |
|---|---|---|---|---|---|
Visible - plate scale ~ 0.05078 arcseconds per pixel 3 | |||||
Clear | 5852 | 4410 | 52 × 52 |
| |
Optical longpass | 7229 | 2722 | 28 × 524 |
| |
[O | 50065 | 6 | 28 × 526 |
| |
[O | 3737 | 62 | 28 × 527 |
| |
Clear + | 5852 | 4410 | 52 × 52 |
| |
Ultraviolet - plate scale ~0.0246 arcseconds per pixel 8 | |||||
Clear | 2250 | 1202 | 25 × 25 |
| |
UV near longpass | 2365 | 995 | 25 × 25 |
| |
UV far longpass | 2299 | 1128 | 25 × 25 |
| |
Mg | 2802 | 45 | 25 × 25 |
| |
Continuum ~2700 Å | 2709 | 155 | 25 × 25 |
| |
C | 1989 | 173 | 25 × 25 |
| |
Continuum ~1800 Å | 1981 | 514 | 25 × 25 |
| |
Lyman-α | 1221 | 72 | 25 × 25 |
| |
Neutral-Density-Filtered Imaging 9 | |||||
ND=10–1 | 1150–10,300 Å | 13.4 × 9.7 |
| ||
ND=10–3 | 1150–10,300 Å | 25 × 25 |
| ||
ND=10–5 | 1150–10,300 Å | 25 × 25 |
| ||
1 See Section 14.2.1 for definition of pivot wavelength.
2 See Section 14.2.1 for definition of FWHM.
3 The CCD plate scales differ by ~1% in the AXIS1 and AXIS2 directions. See Section 14.6.
4 AXIS2=Y is 28 arcsec; AXIS1=X is 52 arcsec. See Figure 3.2 and Figure 11.1.
5 Values given for the F28X50OIII filter exclude the effects of this filter's red leak.
6 AXIS2=Y is 28 arcsec; AXIS1=X is 52 arcsec. See Figure 3.2 and Figure 11.1.
7 AXIS2=Y is 28 arcsec; AXIS1=X is 52 arcsec. See Figure 3.2 and Figure 11.1.
8 The MAMA plate scales differ by ~1% in AXIS1 and AXIS2 directions. FUV-MAMA uses different mirrors in filtered vs. unfiltered modes; the filtered mode plate scale has 0.3% more arcsec/pixel. See Section 14.6.
9 The neutral density filters with the CCD detector can only be used as available-but-unsupported apertures.
5.1.1 Caveats for STIS Imaging
There are several important points about imaging with STIS that should be kept in mind:
- The filters are housed in the slit wheel, and while they are displaced from the focal plane, they are not far out of focus. This location means that imperfections (e.g., scratches, pinholes, etc.) in the filters can cause artifacts in the images. These features do not directly flat-field out because the projection of the focal plane on the detector shifts from image to image due to the nonrepeatability of the MSM's placement of the mirror (careful post-processing may be able to account for registration errors).
- The quality of the low-order flat fields for the MAMA imaging modes limits the photometric accuracy obtained over the full field of view (see Section 16.1).
- The focus varies across the field of view for imaging modes, with the optical performance degrading by ~40% at the edges of the field of view for the MAMA detectors and by ~30% for the CCD (see Section 14.7).
- STIS CCD imaging slightly undersamples the intrinsic PSF. The use of dithering (see Section 11.3) to fully sample the intrinsic spatial resolution and to cope with flat-field variations and other detector nonuniformities may be useful for many programs.
- Two of the STIS narrow-band filters (
F28X50OIIIandF25MGII) have substantial red leaks (see Figure 5.5 and Figure 5.11, respectively). - The STIS CCD will have far more "hot" pixels and a much higher dark current than the newer CCDs.
- Programs requiring high photometric precision at low count levels with the CCD should use
GAIN=1; programs at high count levels should useGAIN=4. AtGAIN=4the CCD exhibits a modest read noise pattern that is correlated on scales of tens of pixels. (See Section 7.2.10.) - At wavelengths longward of ~9000 Å, internal scattering in the STIS CCD produces an extended PSF halo (see Section 7.2.8). Note that the ACS WFC CCDs have a front-side metallization that mitigates a similar problem in that camera, while the WFC3 CCD does not exhibit this problem.
- The dark current in the MAMA detectors varies with time and temperature, and in the
FUV-MAMAit also varies strongly with position, although it is far lower overall than in theNUV-MAMA(see the discussion of Section 7.5.2). - The repeller wire in the
FUV-MAMAdetector (see Section 7.4) leaves a 5-pixel-wide shadow that runs from approximately pixel (0, 543) to (1024, 563) in a slightly curved line. The exact position of the wire varies with the optical element used. - The Charge Transfer Efficiency (CTE) of the STIS CCD is decreasing with time. The effects of the CTE decline are most serious for the lower rows of the detector and for faint sources with low background levels. For further details see Section 7.3.7.
5.1.2 Throughputs and Limiting Magnitudes
In Figure 5.1, Figure 5.2, and Figure 5.3, we show the throughputs (where the throughput is defined as the end-to-end effective area divided by the geometric area of a filled, unobstructed, 2.4 meter aperture) of the full set of available filters for the CCD, the NUV-MAMA, and the FUV-MAMA, respectively.
NUV-MAMA Clear and Filtered Imaging Mode Throughputs.
Limiting Magnitudes
In Table 5.2 below, we give the A0V star V magnitude reached during a one-hour integration that produces a signal-to-noise ratio of 10 integrated over the number of pixels needed to encircle 80% of the PSF flux. The sensitivities adopted here are our best estimate for August 2008. The observations are assumed to take place under average zodiacal background and low earth-shine conditions. These examples are for illustrative purposes only and the reader should be aware that for dim objects, the exposure times can be highly dependent on the specific background conditions. For instance, if a 26.7 magnitude A star were observed under high zodiacal light and high earth shine, the exposure time required to reach signal-to-noise of 10 with CCD clear would be twice as long as the one stated in Table 5.2.
Table 5.2: Limiting A Star V Magnitudes
Detector | Filter | Magnitude | Filter | Magnitude |
|---|---|---|---|---|
CCD | Clear | 26.7 | [O | 21.3 |
CCD | Longpass | 25.8 | [O | 20.5 |
| Clear | 23.9 | ||
| Longpass quartz | 24.1 | Longpass SrF2 | 24.1 |
| C | 19.4 | 1800 Å continuum | 21.5 |
| Mg | 20.5 | 2700 Å continuum3 | 22.2 |
| Clear | 20.5 | Lyman-α | 16.0 |
| Longpass quartz | 21.8 | Longpass SrF2 | 21.6 |
1 This filter has substantial red leaks see Section 5.2.4.
2 This filter has substantial red leaks see Mg II: F25MGII.
3 This filter has substantial red leaks see 2700 Å Continuum: F25CN270.
5.1.3 Signal-To-Noise Ratios
In Chapter 14 we present, for each imaging mode, plots of exposure time versus magnitude to achieve a desired signal-to-noise ratio. These plots, which are referenced in the individual imaging mode sections that follow, are useful for getting an idea of the exposure time one would need to accomplish one's scientific objectives. More detailed estimates can be made either by using the sensitivities given in Chapter 14 or by using the STIS Imaging Exposure Time Calculator (ETC).
5.1.4 Saturation
Both CCD and MAMA imaging observations are subject to saturation at high total accumulated counts per pixel: the CCD due to the depth of the full well and the saturation limit of the gain amplifier for CCDGAIN=1; and the MAMAs due to the 16-bit format of the buffer memory (see Section 7.3.2 and Section 7.5.1). In Chapter 14, saturation levels as functions of source magnitude and exposure time are presented in the S/N plots for each imaging mode. STIS ISR 2015-06: STIS CCD Saturation Effects provides an in-depth analysis of the CCD saturation, in which it is found that the center of the detector has a full-well depth of 128,000 e– but drops off towards the sides. The top of the detector has a substantially higher full-well depth at ~160,000 e–, which can cause serial transfer artifacts.
5.1.5 Full-field Sensitivity
STIS ISR 2022-02 analyzes imaging from all three STIS detectors spanning 25 years to measure its full-field sensitivity (updating analysis presented in STIS ISR 2013-02). Residual magnitude trends of stars in standard stellar fields were derived and averaged to track if there were any residual time changes in photometry following an initial time-dependent sensitivity correction in the CALSTIS pipeline. Results from STIS ISR 2022-02 are roughly consistent with those from STIS ISR 2013-02 measured over the same time period (1997 to 2012), and show magnitude trends are within the target ∼ 1% STIS flux calibration accuracy (e.g., Bohlin et al. 2019). We observe stronger negative magnitude trends (i.e., sources appearing brighter with time) when including more recent data. This implies that the TDS models are over-correcting the data which could mean that the loss of imaging sensitivity is slowing at a more rapid rate than the spectroscopic TDS models predict, as determined independently for all three STIS detectors. However, we note that these trends are still within the quoted 5% photometry errors for STIS (see Section 16.1). We also measure point spread functions for each image and find no significant trends in their full-width-half-max values with time for any detector.
-
STIS Instrument Handbook
- • Acknowledgments
- Chapter 1: Introduction
-
Chapter 2: Special Considerations for Cycle 33
- • 2.1 Impacts of Reduced Gyro Mode on Planning Observations
- • 2.2 STIS Performance Changes Pre- and Post-SM4
- • 2.3 New Capabilities for Cycle 33
- • 2.4 Use of Available-but-Unsupported Capabilities
- • 2.5 Choosing Between COS and STIS
- • 2.6 Scheduling Efficiency and Visit Orbit Limits
- • 2.7 MAMA Scheduling Policies
- • 2.8 Prime and Parallel Observing: MAMA Bright-Object Constraints
- • 2.9 STIS Snapshot Program Policies
- Chapter 3: STIS Capabilities, Design, Operations, and Observations
- Chapter 4: Spectroscopy
- Chapter 5: Imaging
- Chapter 6: Exposure Time Calculations
- Chapter 7: Feasibility and Detector Performance
-
Chapter 8: Target Acquisition
- • 8.1 Introduction
- • 8.2 STIS Onboard CCD Target Acquisitions - ACQ
- • 8.3 Onboard Target Acquisition Peakups - ACQ PEAK
- • 8.4 Determining Coordinates in the International Celestial Reference System (ICRS) Reference Frame
- • 8.5 Acquisition Examples
- • 8.6 STIS Post-Observation Target Acquisition Analysis
- Chapter 9: Overheads and Orbit-Time Determination
- Chapter 10: Summary and Checklist
- Chapter 11: Data Taking
-
Chapter 12: Special Uses of STIS
- • 12.1 Slitless First-Order Spectroscopy
- • 12.2 Long-Slit Echelle Spectroscopy
- • 12.3 Time-Resolved Observations
- • 12.4 Observing Too-Bright Objects with STIS
- • 12.5 High Signal-to-Noise Ratio Observations
- • 12.6 Improving the Sampling of the Line Spread Function
- • 12.7 Considerations for Observing Planetary Targets
- • 12.8 Special Considerations for Extended Targets
- • 12.9 Parallel Observing with STIS
- • 12.10 Coronagraphic Spectroscopy
- • 12.11 Coronagraphic Imaging - 50CORON
- • 12.12 Spatial Scans with the STIS CCD
-
Chapter 13: Spectroscopic Reference Material
- • 13.1 Introduction
- • 13.2 Using the Information in this Chapter
-
13.3 Gratings
- • First-Order Grating G750L
- • First-Order Grating G750M
- • First-Order Grating G430L
- • First-Order Grating G430M
- • First-Order Grating G230LB
- • Comparison of G230LB and G230L
- • First-Order Grating G230MB
- • Comparison of G230MB and G230M
- • First-Order Grating G230L
- • First-Order Grating G230M
- • First-Order Grating G140L
- • First-Order Grating G140M
- • Echelle Grating E230M
- • Echelle Grating E230H
- • Echelle Grating E140M
- • Echelle Grating E140H
- • PRISM
- • PRISM Wavelength Relationship
-
13.4 Apertures
- • 52X0.05 Aperture
- • 52X0.05E1 and 52X0.05D1 Pseudo-Apertures
- • 52X0.1 Aperture
- • 52X0.1E1 and 52X0.1D1 Pseudo-Apertures
- • 52X0.2 Aperture
- • 52X0.2E1, 52X0.2E2, and 52X0.2D1 Pseudo-Apertures
- • 52X0.5 Aperture
- • 52X0.5E1, 52X0.5E2, and 52X0.5D1 Pseudo-Apertures
- • 52X2 Aperture
- • 52X2E1, 52X2E2, and 52X2D1 Pseudo-Apertures
- • 52X0.2F1 Aperture
- • 0.2X0.06 Aperture
- • 0.2X0.2 Aperture
- • 0.2X0.09 Aperture
- • 6X0.2 Aperture
- • 0.1X0.03 Aperture
- • FP-SPLIT Slits 0.2X0.06FP(A-E) Apertures
- • FP-SPLIT Slits 0.2X0.2FP(A-E) Apertures
- • 31X0.05ND(A-C) Apertures
- • 0.2X0.05ND Aperture
- • 0.3X0.05ND Aperture
- • F25NDQ Aperture
- 13.5 Spatial Profiles
- 13.6 Line Spread Functions
- • 13.7 Spectral Purity, Order Confusion, and Peculiarities
- • 13.8 MAMA Spectroscopic Bright Object Limits
-
Chapter 14: Imaging Reference Material
- • 14.1 Introduction
- • 14.2 Using the Information in this Chapter
- 14.3 CCD
- 14.4 NUV-MAMA
-
14.5 FUV-MAMA
- • 25MAMA - FUV-MAMA, Clear
- • 25MAMAD1 - FUV-MAMA Pseudo-Aperture
- • F25ND3 - FUV-MAMA
- • F25ND5 - FUV-MAMA
- • F25NDQ - FUV-MAMA
- • F25QTZ - FUV-MAMA, Longpass
- • F25QTZD1 - FUV-MAMA, Longpass Pseudo-Aperture
- • F25SRF2 - FUV-MAMA, Longpass
- • F25SRF2D1 - FUV-MAMA, Longpass Pseudo-Aperture
- • F25LYA - FUV-MAMA, Lyman-alpha
- • 14.6 Image Mode Geometric Distortion
- • 14.7 Spatial Dependence of the STIS PSF
- • 14.8 MAMA Imaging Bright Object Limits
- Chapter 15: Overview of Pipeline Calibration
- Chapter 16: Accuracies
-
Chapter 17: Calibration Status and Plans
- • 17.1 Introduction
- • 17.2 Ground Testing and Calibration
- • 17.3 STIS Installation and Verification (SMOV2)
- • 17.4 Cycle 7 Calibration
- • 17.5 Cycle 8 Calibration
- • 17.6 Cycle 9 Calibration
- • 17.7 Cycle 10 Calibration
- • 17.8 Cycle 11 Calibration
- • 17.9 Cycle 12 Calibration
- • 17.10 SM4 and SMOV4 Calibration
- • 17.11 Cycle 17 Calibration Plan
- • 17.12 Cycle 18 Calibration Plan
- • 17.13 Cycle 19 Calibration Plan
- • 17.14 Cycle 20 Calibration Plan
- • 17.15 Cycle 21 Calibration Plan
- • 17.16 Cycle 22 Calibration Plan
- • 17.17 Cycle 23 Calibration Plan
- • 17.18 Cycle 24 Calibration Plan
- • 17.19 Cycle 25 Calibration Plan
- • 17.20 Cycle 26 Calibration Plan
- • 17.21 Cycle 27 Calibration Plan
- • 17.22 Cycle 28 Calibration Plan
- • 17.23 Cycle 29 Calibration Plan
- • 17.24 Cycle 30 Calibration Plan
- • 17.25 Cycle 31 Calibration Plan
- • 17.26 Cycle 32 Calibration Plan
- Appendix A: Available-But-Unsupported Spectroscopic Capabilities
- • Glossary


