4.1 Overview
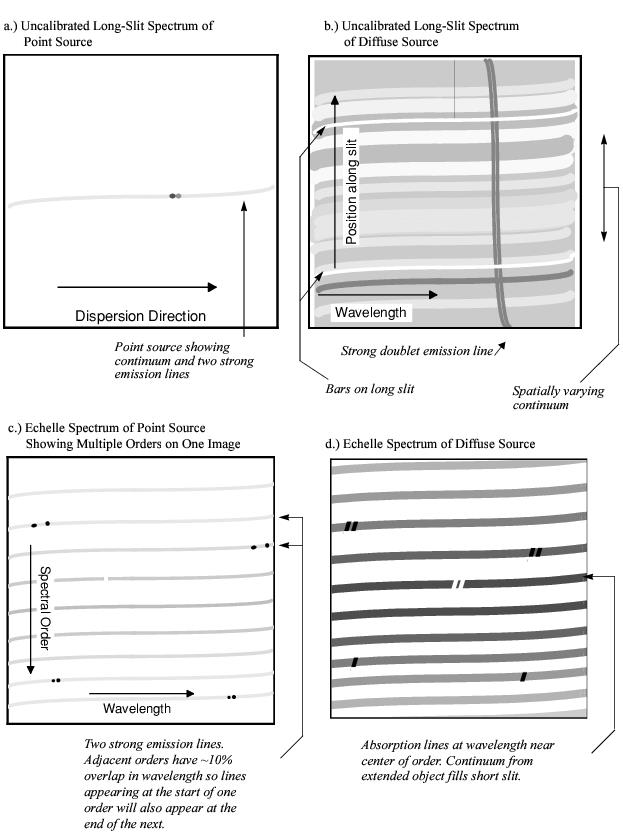
There are 15 spectroscopic modes which are summarized in Table 4.1 below. They comprise low- and intermediate-resolution first-order modes designed to be used with a complement of long slits over the entire wavelength range, and intermediate- and high-resolution echelle modes that have been optimized for point-source observations through short echelle slits and are available only in the ultraviolet (UV; see Figure 4.1).
Table 4.1: STIS Spectroscopic Capabilities.
Spectral Range (Å) | Spectral Resolution | ||||||||
Grating | Complete | Per Tilt | Scale Δλ | Resolving | No. Prime | Detector | |||
MAMA First-Order Spectroscopy | |||||||||
1150–1730 | 590 | 0.60 | 960–1440 | 1 |
|
|
| ||
1140–1740 | 55 | 0.05 | 11,400–17,400 | 12 |
| ||||
1570–3180 | 1616 | 1.58 | 500–1010 | 1 |
| ||||
1640–3100 | 90 | 0.09 | 9110–17,220 | 18 |
| ||||
CCD First-Order Spectroscopy | |||||||||
1680–3060 | 1380 | 1.35 | 620–1130 | 1 | CCD |
| |||
1640–3190 | 156 | 0.15 | 5470–10,630 | 11 | CCD | ||||
2900–5700 | 2800 | 2.73 | 530–1040 | 1 | CCD | ||||
3020–5610 | 286 | 0.28 | 5390–10,020 | 10 | CCD | ||||
5240–10,270 | 5030 | 4.92 | 530–1040 | 1 | CCD |
| |||
G750M | 5450–10,140 | 572 | 0.56 | 4870–9050 | 9 | CCD | |||
MAMA Echelle Spectroscopy | |||||||||
1144–1710 | 567 | λ/91,700 | 45,800 | 1 |
|
| |||
1140–1700 | 210 | λ/228,000 | 114,00011 | 3 |
|
| |||
1605–3110 | 800 | λ/60,000 | 30,000 | 2 |
|
| |||
1620–3150 | 267 | λ/228,000 | 114,00011 | 6 |
|
| |||
MAMA Prism Spectroscopy | |||||||||
1150–3620 | 2470 | 0.2–72 | 10–2500 | 1 |
|
| |||
1 See Section 13.6 for detailed estimates.
2 Number of exposures at distinct tilts needed to cover spectral range of grating with 10% wavelength overlap between adjacent settings.
3 For a complete list of supported and available-but-unsupported apertures for each grating, see Table A.1.
4 Naming convention gives dimensions of slit in arcseconds. E.g., 52X0.1 indicates the slit is 52 arcsec long perpendicular to the dispersion direction and 0.1 arcsec wide in the dispersion direction. The F (e.g., in 52X0.2F1) indicates a fiducial bar to be used for coronagraphic spectroscopy.
5 For MAMA first-order modes, only ~25 arcsec of a long slit's length projects on the detector. (See also Section 4.2.2.).
6 Full-aperture clear (50CCD or 25MAMA), longpass-filtered (F25QTZ or F25SRF2 in UV), and neutral-density-filtered slitless spectroscopy are also supported with the appropriate first-order and echelle gratings, as well as the PRISM.
7 The following slits are also supported for all echelle gratings. The 6X0.2 and 52X0.05 long slits are intended for use with extended emission line objects; order overlap must be considered when using these slits. Also the high S/N multi-slits 0.2X0.2FP(A–E) and 0.2X0.06FP(A–E) (see Chapter 12), the very narrow 0.1X0.03 slit for maximum spectral resolution, and the 0.2X0.05ND, 0.3X0.05ND, and 31X0.05ND(A–C) neutral density slits.
8 The 0.1X0.09 and 0.1X0.2 slits are supported with E230H only. F25MGII is supported with all NUV-MAMA gratings and the PRISM.
9 The 0.2X0.2 aperture is also supported with all first-order gratings. It is available-but-unsupported with the PRISM.
10 The F25SRF2 aperture can be used with the PRISM to filter out (geocoronal) Lyman-α emission.
11 Resolution of 200,000 or greater is possible when used with the 0.1X0.03 slit and special observing and data reduction techniques.
Figure 4.1: Sample Uncalibrated Spectral Images (distortion is exaggerated).
4.1.1 Throughputs
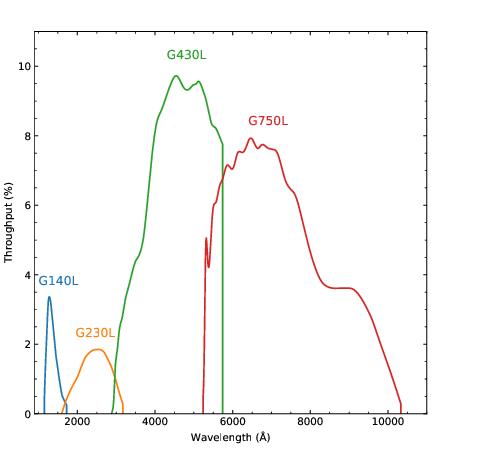
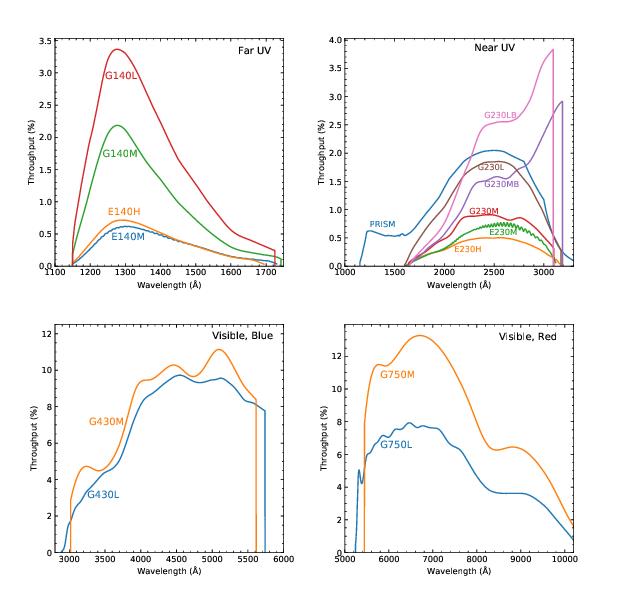
To illustrate the broad wavelength coverage provided by STIS and the relative throughputs achievable across STIS' wavelength regime, we show in Figure 4.2 the system throughput of the four low-resolution, first-order modes on a single plot (where the throughput is defined as the end-to-end effective area divided by the geometric area of a filled, unobstructed, 2.4 meter aperture). To allow you to judge the relative throughputs of different spectroscopic configurations, we plot in Figure 4.3 the efficiency of all grating modes for each of the four primary wavelength regimes on a common plot. These plots allow you to gauge the relative efficiencies of STIS in different configurations. Note, however, that these curves give the throughput at the time that STIS was initially calibrated (approximately 1997.7). Throughput changes, determined from monitoring observations since STIS was installed, are discussed in Sections 7.2.5 and 7.4.3. The throughput curves shown for the echelle modes trace the peak of the echelle blaze function for each order; throughputs near the ends of each order are lower by ~20 to 40%.
Figure 4.2: System Throughput of STIS' Low-Resolution, First-Order Grating Modes.
Figure 4.3: System Throughput of STIS' Grating Modes.
4.1.2 Limiting Magnitudes
In Table 4.2 below, we give the V magnitude for an A0V star that gives a signal-to-noise ratio of 10 in the continuum (per spectral resolution element around the peak of the grating response), in a 1 hour exposure, where we have integrated over the PSF in the direction perpendicular to the dispersion, and assumed the 52X0.2 slit for the first-order gratings and the 0.2X0.2 slit for the echelles. The adopted sensitivities are those estimated for August 2008.
Table 4.2: Limiting A0 V Star V Magnitudes.
Grating | Wavelength (Å) | Magnitude |
| 7000 | 20.8 |
| 7000 | 19.0 |
| 5500 | 20.8 |
| 5500 | 18.4 |
| 3000 | 18.3 |
| 3000 | 15.4 |
| 2600 | 18.4 |
| 2600 | 14.4 |
| 1350 | 16.7 |
| 1350 | 13.4 |
| 2700 | 13.2 |
| 2600 | 11.6 |
| 1400 | 10.7 |
| 1350 | 9.8 |
| 2300 (slitless) | 20.6 |
4.1.3 Saturation
Both CCD and MAMA observations are subject to saturation at high total accumulated counts/pix. The CCD can be saturated due to the saturation of the detector itself or of the gain amplifier for CCDGAIN=1. MAMA saturation can occur due to the 16-bit format of its memory buffer. The nature of the saturation for CCD and MAMA spectroscopic observations is described in Section 7.3.2 and Section 7.5.1, respectively.
4.1.4 MAMA Bright Object Limits
The MAMA detectors are subject to absolute bright object limits, above which targets cannot be observed.
We direct MAMA observers to the discussion presented in Section 7.7. For summary tables of bright object screening magnitudes for all spectroscopic modes, see Section 13.8. It is the observer’s responsibility to be sure that proposed observations do not exceed the MAMA bright object limits.
4.1.5 Scanned Gratings: Prime and Secondary (Tilt) Positions
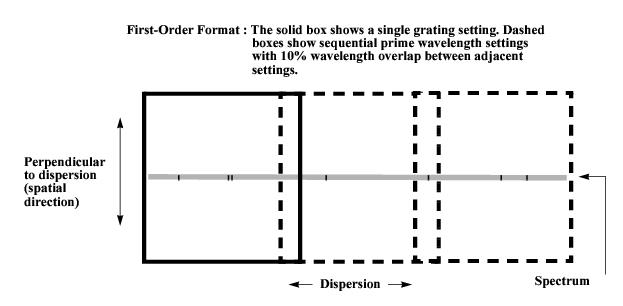
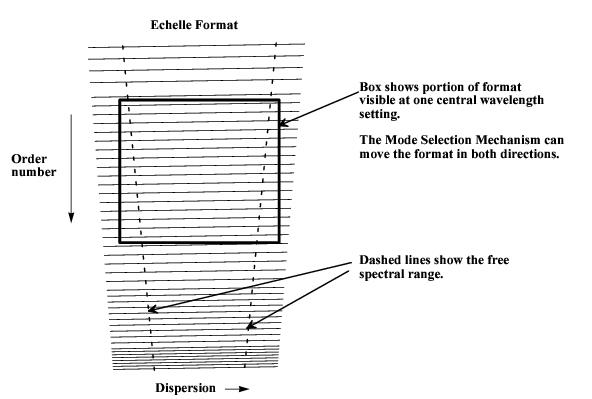
For the intermediate-resolution gratings and echelles (except E140M), only a portion of the full spectral range of the grating falls on the detector in any one exposure, and the gratings must be scanned (tilted) with a separate exposure taken at each tilt position, in order to cover the full spectral range (see Figure 4.4 and Figure 4.5 below). Accordingly, for these scanned gratings, the user may select a single exposure at a given wavelength, or a series of exposures at different wavelengths to cover a larger wavelength range. The user must choose either prime or secondary settings. The prime settings cover the full spectral range with 10% wavelength overlap between observations taken at adjacent settings. The secondary settings cover selected absorption or emission lines and may be more convenient to use in some applications. For the intermediate-resolution gratings, we expect the photometric and wavelength calibration accuracies to be higher for the prime settings than for most of the secondary settings, as calibrations for the latter are inferred from those taken at prime settings. Early in the operation of STIS, the photometric accuracies of the primary echelle settings were higher; however, for post-SM4 observations the photometric accuracies of the primary and secondary settings are comparable. The central wavelengths, and corresponding minimum and maximum wavelengths, are presented in the individual grating sections in Chapter 13.
Figure 4.4: Scanned First-Order Gratings.
Figure 4.5: Scanned Echelle Gratings.
4.1.6 Cross-Over Regions
In the near-ultraviolet (NUV), where the CCD has comparable sensitivity to the NUV-MAMA, you may want to consider using the G230LB or G230MB gratings with the CCD instead of the G230L and G230M gratings with the MAMA. You will get improved throughput down to at least 2500 Å, a larger slit length, and use of the CCD rather than the MAMA (see Figure 4.3 and Chapter 13). On the other hand, the CCD has read noise, cosmic ray sensitivity, hot pixels, and charge transfer efficiency losses. Also, for red objects, scattered light can be more of a problem with the red-sensitive CCD than with the solar-insensitive NUV-MAMA (see STIS ISR 2022-05). For a solar-type spectrum, CCD data at wavelengths shorter than 2100 Å are dominated by scattered light.
4.1.7 Neutral Density Slits for Spectroscopy
The use of the 31X0.05NDA, 31X0.05NDB, and 31X0.05NDC neutral density slits are supported with both the MAMA first order and echelle gratings. These slits are nominally 31 × 0.05 arcseconds in size, and have throughput reduction factors of roughly 6, 14, and 33, respectively, and are implemented in both APT and the STIS ETC. At this time their use with the PRISM remains "available-but-unsupported." Additional information can be found in 31X0.05ND(A-C) Apertures.
-
STIS Instrument Handbook
- • Acknowledgments
- Chapter 1: Introduction
-
Chapter 2: Special Considerations for Cycle 32
- • 2.1 STIS Repair and Return to Operations
- • 2.2 Summary of STIS Performance Changes Since 2004
- • 2.3 New Capabilities for Cycle 32
- • 2.4 Use of Available-but-Unsupported Capabilities
- • 2.5 Choosing Between COS and STIS
- • 2.6 Scheduling Efficiency and Visit Orbit Limits
- • 2.7 MAMA Scheduling Policies
- • 2.8 Prime and Parallel Observing: MAMA Bright-Object Constraints
- • 2.9 STIS Snapshot Program Policies
- Chapter 3: STIS Capabilities, Design, Operations, and Observations
- Chapter 4: Spectroscopy
- Chapter 5: Imaging
- Chapter 6: Exposure Time Calculations
- Chapter 7: Feasibility and Detector Performance
-
Chapter 8: Target Acquisition
- • 8.1 Introduction
- • 8.2 STIS Onboard CCD Target Acquisitions - ACQ
- • 8.3 Onboard Target Acquisition Peakups - ACQ PEAK
- • 8.4 Determining Coordinates in the International Celestial Reference System (ICRS) Reference Frame
- • 8.5 Acquisition Examples
- • 8.6 STIS Post-Observation Target Acquisition Analysis
- Chapter 9: Overheads and Orbit-Time Determination
- Chapter 10: Summary and Checklist
- Chapter 11: Data Taking
-
Chapter 12: Special Uses of STIS
- • 12.1 Slitless First-Order Spectroscopy
- • 12.2 Long-Slit Echelle Spectroscopy
- • 12.3 Time-Resolved Observations
- • 12.4 Observing Too-Bright Objects with STIS
- • 12.5 High Signal-to-Noise Ratio Observations
- • 12.6 Improving the Sampling of the Line Spread Function
- • 12.7 Considerations for Observing Planetary Targets
- • 12.8 Special Considerations for Extended Targets
- • 12.9 Parallel Observing with STIS
- • 12.10 Coronagraphic Spectroscopy
- • 12.11 Coronagraphic Imaging - 50CORON
- • 12.12 Spatial Scans with the STIS CCD
-
Chapter 13: Spectroscopic Reference Material
- • 13.1 Introduction
- • 13.2 Using the Information in this Chapter
-
13.3 Gratings
- • First-Order Grating G750L
- • First-Order Grating G750M
- • First-Order Grating G430L
- • First-Order Grating G430M
- • First-Order Grating G230LB
- • Comparison of G230LB and G230L
- • First-Order Grating G230MB
- • Comparison of G230MB and G230M
- • First-Order Grating G230L
- • First-Order Grating G230M
- • First-Order Grating G140L
- • First-Order Grating G140M
- • Echelle Grating E230M
- • Echelle Grating E230H
- • Echelle Grating E140M
- • Echelle Grating E140H
- • PRISM
- • PRISM Wavelength Relationship
-
13.4 Apertures
- • 52X0.05 Aperture
- • 52X0.05E1 and 52X0.05D1 Pseudo-Apertures
- • 52X0.1 Aperture
- • 52X0.1E1 and 52X0.1D1 Pseudo-Apertures
- • 52X0.2 Aperture
- • 52X0.2E1, 52X0.2E2, and 52X0.2D1 Pseudo-Apertures
- • 52X0.5 Aperture
- • 52X0.5E1, 52X0.5E2, and 52X0.5D1 Pseudo-Apertures
- • 52X2 Aperture
- • 52X2E1, 52X2E2, and 52X2D1 Pseudo-Apertures
- • 52X0.2F1 Aperture
- • 0.2X0.06 Aperture
- • 0.2X0.2 Aperture
- • 0.2X0.09 Aperture
- • 6X0.2 Aperture
- • 0.1X0.03 Aperture
- • FP-SPLIT Slits 0.2X0.06FP(A-E) Apertures
- • FP-SPLIT Slits 0.2X0.2FP(A-E) Apertures
- • 31X0.05ND(A-C) Apertures
- • 0.2X0.05ND Aperture
- • 0.3X0.05ND Aperture
- • F25NDQ Aperture
- 13.5 Spatial Profiles
- 13.6 Line Spread Functions
- • 13.7 Spectral Purity, Order Confusion, and Peculiarities
- • 13.8 MAMA Spectroscopic Bright Object Limits
-
Chapter 14: Imaging Reference Material
- • 14.1 Introduction
- • 14.2 Using the Information in this Chapter
- 14.3 CCD
- 14.4 NUV-MAMA
-
14.5 FUV-MAMA
- • 25MAMA - FUV-MAMA, Clear
- • 25MAMAD1 - FUV-MAMA Pseudo-Aperture
- • F25ND3 - FUV-MAMA
- • F25ND5 - FUV-MAMA
- • F25NDQ - FUV-MAMA
- • F25QTZ - FUV-MAMA, Longpass
- • F25QTZD1 - FUV-MAMA, Longpass Pseudo-Aperture
- • F25SRF2 - FUV-MAMA, Longpass
- • F25SRF2D1 - FUV-MAMA, Longpass Pseudo-Aperture
- • F25LYA - FUV-MAMA, Lyman-alpha
- • 14.6 Image Mode Geometric Distortion
- • 14.7 Spatial Dependence of the STIS PSF
- • 14.8 MAMA Imaging Bright Object Limits
- Chapter 15: Overview of Pipeline Calibration
- Chapter 16: Accuracies
-
Chapter 17: Calibration Status and Plans
- • 17.1 Introduction
- • 17.2 Ground Testing and Calibration
- • 17.3 STIS Installation and Verification (SMOV2)
- • 17.4 Cycle 7 Calibration
- • 17.5 Cycle 8 Calibration
- • 17.6 Cycle 9 Calibration
- • 17.7 Cycle 10 Calibration
- • 17.8 Cycle 11 Calibration
- • 17.9 Cycle 12 Calibration
- • 17.10 SM4 and SMOV4 Calibration
- • 17.11 Cycle 17 Calibration Plan
- • 17.12 Cycle 18 Calibration Plan
- • 17.13 Cycle 19 Calibration Plan
- • 17.14 Cycle 20 Calibration Plan
- • 17.15 Cycle 21 Calibration Plan
- • 17.16 Cycle 22 Calibration Plan
- • 17.17 Cycle 23 Calibration Plan
- • 17.18 Cycle 24 Calibration Plan
- • 17.19 Cycle 25 Calibration Plan
- • 17.20 Cycle 26 Calibration Plan
- • 17.21 Cycle 27 Calibration Plan
- • 17.22 Cycle 28 Calibration Plan
- • 17.23 Cycle 29 Calibration Plan
- • 17.24 Cycle 30 Calibration Plan
- • 17.25 Cycle 31 Calibration Plan
- Appendix A: Available-But-Unsupported Spectroscopic Capabilities
- • Glossary
