5.3 Ultraviolet Imaging with the MAMA Detectors
The filtered and clear apertures available for UV imaging are summarized in Table 5.1. Although there are only a small number of filters available, the solar-blind and solar-insensitive properties of the FUV-MAMA and NUV-MAMA detectors, respectively, coupled with their 25 × 25 arcsecond field of view, good spatial sampling, and ability to detect rapid variability, give STIS UV imaging capabilities that are complementary to those of ACS. The throughputs of the STIS MAMA imaging modes assumed for this Handbook are mostly based on on-orbit calibration observations.
Most figures and tables were updated for the Cycle 17 version of this Handbook using our best estimates of instrument performance for Cycle 17. Except where otherwise noted, we have not redone these figures and tables to take into account the modest changes expected between those projected values and the estimates for the current cycle. These throughputs are good to within 5% in the FUV and NUV.
The throughputs in the STIS ETC, the calibration reference files, as well as those used by Astropy's synphot package will continue to be updated as further analysis of the calibration data continues. As of the publication of this Handbook, the sensitivities used in those software packages are our best estimates for April 2025 (i.e., mid-Cycle 32).
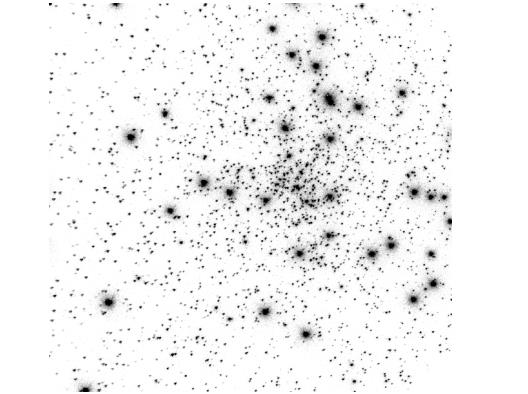
Figure 5.7 shows an example of MAMA imaging data of a globular cluster taken as part of the Cycle 7 calibration of STIS using the quartz filter and the NUV-MAMA.
NUV-MAMA Image of NGC 6681 Taken with the F25QTZ Filter.
5.3.1 Bright Object Limits
The MAMA detectors are subject to absolute bright object limits, above which targets cannot be observed. They are particularly stringent for the MAMA imaging modes (being as faint as V=20.3 for the clear modes), and apply to all sources illuminating the field of view.
We direct MAMA observers to Section 7.7 for a detailed discussion. For summary tables of absolute bright object screening magnitudes for the imaging modes, see Section 14.8.
It is the observers' responsibility to ensure that their observations do not exceed the MAMA bright object limits.
5.3.2 Optical Performance
The MAMA plate scale is ~0.0246 arcsec/pix in imaging mode, providing a good compromise between the sampling of the PSF in the UV and field of view. Chapter 14 shows encircled energies as a function of wavelength for MAMA imaging, and provides information on the geometric distortions of the images. The MAMA detector PSFs exhibit broad wings, which are substantially higher in the NUV-MAMA than the FUV-MAMA. Figure 7.16 shows sample detector PSFs for the MAMAs.
5.3.3 Unfiltered (Clear) MAMA Imaging: 25MAMA
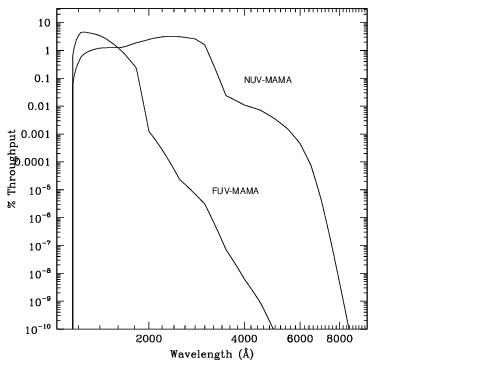
Each MAMA can be used with the 25MAMA clear aperture to image a 25 × 25 arcsecond field of view of the sky, providing the maximum throughput and wavelength coverage in the NUV and FUV as shown in Figure 5.2 and Figure 5.3. However, NUV-MAMA clear direct images will be slightly out of focus because the corresponding mirror on the MSM optimally focuses for using a filter. It is recommended that the F25SRF2 longpass filter (see Section 5.3.5) be used instead of 25MAMA (clear) for direct imaging with the NUV-MAMA. The same does not apply to the FUV-MAMA, which has separate MSM mirrors for clear and filtered imaging.
The sky background can be significant for unfiltered FUV-MAMA observations. The strongest contributor is the geocoronal Lyman-α line. Global count rates of several 104 counts/s over the whole detector are not unusual during daytime observations. The same applies to slitless FUV spectroscopy. For observations of large, UV-faint targets, where background subtraction becomes critical, unfiltered imaging may introduce significant noise. In addition, the background may be variable during long exposures. Longpass filtered imaging may be profitable in this case.
5.3.4 FUV Red Leak
Ground measurements of the FUV-MAMA quantum efficiency indicated that it dropped dramatically longward of ~2000 Å, which would have made it effectively solar blind, while the NUV-MAMA also showed a reduced response toward the red, longward of ~3500 Å (see Figure 5.9).
The ACS SBC (solar blind channel) has been known to have a significantly larger sensitivity to optical photons than pre-launch testing had indicated. Since the STIS FUV-MAMA is very similar in design to the ACS SBC, available data were scrutinized to determine whether a similar red leak existed for the STIS detector.
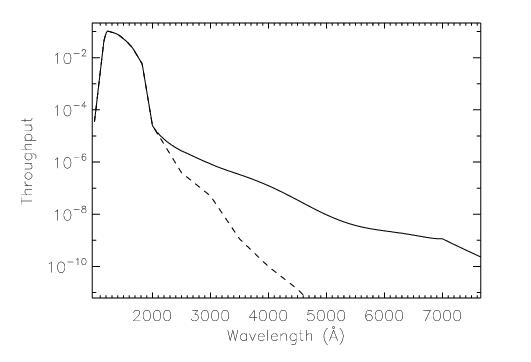
A good test case was a set of observations of Saturn where G140L, G230L, and FUV-MAMA SFR2 imaging observations were taken in the same visit. Comparison of the flux levels measured in these observations suggest that the optical throughput of the STIS FUV-MAMA detector, although still quite low, is indeed substantially higher than the pre-launch measurement. Based upon these observations and the estimated wavelength dependence of the optical throughput for the SBC, a preliminary revision to the FUV-MAMA imaging throughput curve has been devised (see Figure 5.8), and has been incorporated into the FUV-MAMA imaging throughput curves shown in Chapter 14. Note that this revision results in only trivial changes to the formal calculation of bandpass parameters, and should only affect FUV-MAMA imaging observations of very red objects.
FUV-MAMA Throughput Curve (solid line) is Compared to the Previous Estimate of the Throughput (dashed line).
Table 5.3 and Table 5.4 give the percentages of detected photons arising in the UV versus optical for observations of different stellar types with the clear MAMA imaging modes. The data for the FUV-MAMA include the effects of the estimated red leak.
NUV-MAMA Clear Imaging Modes.
FUV-MAMA Clear Imaging Mode.Stellar | Teff (K) | Log g | Percentage of | Percentage of |
|---|---|---|---|---|
O3 | 45,000 | 4.5 | 99.5 | 100.0 |
B0 | 30,000 | 4.0 | 99.4 | 100.0 |
A0 | 9,500 | 4.0 | 97.2 | 100.0 |
A5 | 8,250 | 4.0 | 82.6 | 99.9 |
F0 | 7,250 | 4.0 | 68.3 | 99.5 |
G0 | 6,000 | 4.5 | 31.2 | 72.7 |
K0 | 5,250 | 4.5 | 5.1 | 27.6 |
Table 5.4: Visible-Light Rejection of the NUV–MAMA Clear Imaging Mode.
Stellar Type | Teff (K) | Log g | Percentage of | Percentage of |
|---|---|---|---|---|
O3 | 45,000 | 4.5 | 97.9 | 100.0 |
B0 | 30,000 | 4.0 | 97.6 | 100.0 |
A0 | 9,500 | 4.0 | 93.0 | 99.9 |
A5 | 8,250 | 4.0 | 90.0 | 99.8 |
F0 | 7,250 | 4.0 | 85.0 | 99.7 |
G0 | 6,000 | 4.5 | 71.3 | 99.2 |
K0 | 5,250 | 4.5 | 56.9 | 97.7 |
5.3.5 Longpass-Filtered MAMA Imaging: F25SRF2 and F25QTZ
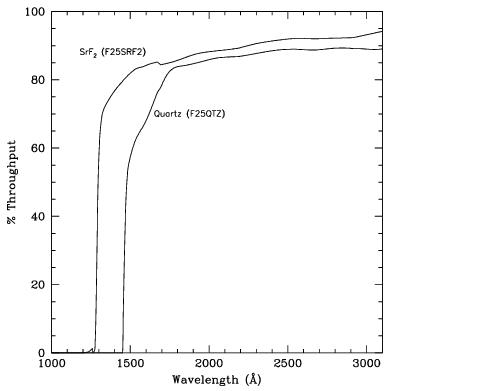
The integrated system throughputs of the two UV longpass filters when used with the NUV-MAMA and FUV-MAMA are shown in Figure 5.2 and Figure 5.3 (for sensitivities, signal-to-noise plots, and saturation plots of F25SRF2 see F25SRF2 - NUV-MAMA, Longpass and F25SRF2 - FUV-MAMA, Longpass and of F25QTZ see F25QTZ - NUV-MAMA, Longpass and F25QTZ - FUV-MAMA, Longpass). The filter (only) throughputs of these two filters are shown in Figure 5.10. These filters image a 25 × 25 arcsecond field of view. The cutoff wavelengths of F25SRF2 and F25QTZ were chosen to exclude a) geocoronal Lyman-α 1216 Å and b) O I 1302 Å triplet and O I] 1356 Å, respectively; use of these filters significantly reduces the total sky background in the UV. These filters can be used by themselves in imaging mode, or with the prism or any first-order UV grating in slitless spectroscopic observations, to reduce the background due to geocoronal emission (see Section 4.4 and Section 12.1). F25SRF2 images, combined with images taken in series with the FUV-MAMA/25MAMA clear, can also be used to obtain Lyman-α images (see Lyman Alpha: F25LYA and Clear-Minus-SRF2).
5.3.6 MAMA Narrow-Band-Filtered Imaging
The filters for MAMA imaging include:
- A narrow-band filter (
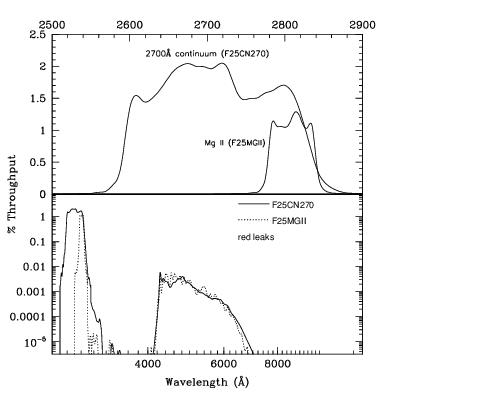
F25MGII) which images the magnesium doublet at 2796–2803 Å, and a matched medium-band continuum filter (F25CN270) centered at 2700 Å (for sensitivities, signal-to-noise plots, and saturation plots, see pages F25MGII - NUV-MAMA andF25CN270-NUV-MAMA). - A narrow-band filter (
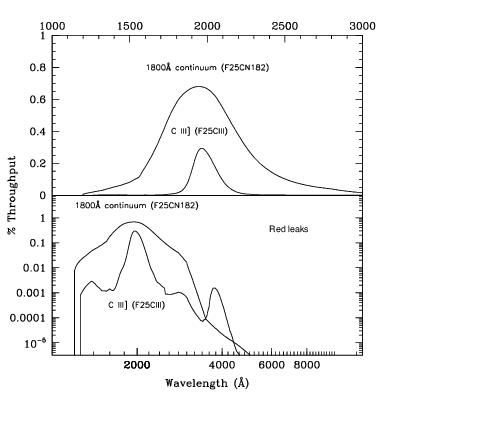
F25CIII) which images the semi-forbidden CIII] lines at 1907–1909 Å, among the strongest nebular (low-density) lines in the UV, and a matched medium-band continuum filter (F25CN182) centered at 1800 Å (for sensitivities, signal-to-noise plots, and saturation plots, seeF25CIII-NUV-MAMAforF25CIIIandF25CN182-NUV-MAMAforF25CN182). - A narrow-band filter (
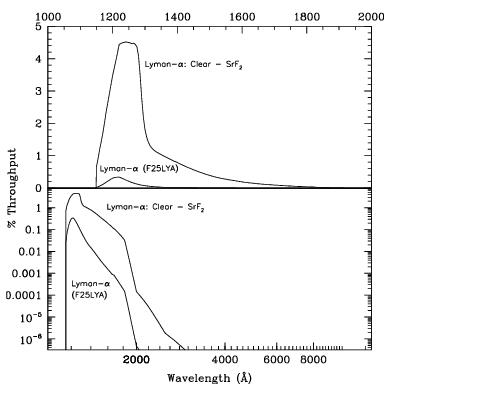
F25LYA) which images Lyman-α; this filter has a relatively low throughput, and we recommend that you consider, instead, obtaining twoFUV-MAMAimages, one through the25MAMAunfiltered aperture and a second with the SrF2 longpass filter. The difference of these two images will isolate Lyman-α with much higher throughput than theF25LYAfilter. Alternatively, the ACS SBC can be used with theF122Mfilter (for sensitivities, signal-to-noise plots, and saturation plots ofF25LYA, seeF25LYA-FUV-MAMA, Lyman-α).
II: F25MGII
The F25MGII filter images a 25 × 25 arcsecond field of view in the light of the doublet lines of Mg II (2796 and 2803 Å). Figure 5.11 shows the integrated system throughput (see also F25MGII - NUV-MAMA for sensitivities, signal-to-noise plots, and saturation plots). There is a substantial red leak in this filter starting at approximately 4200 Å and extending to at least 13,000 Å. For stellar spectral types O and B, less than 2% of the detected counts will be due to red leak. This percentage rises to 7% for an A0 star. For a K0 star, 75% of the counts will be due to red leak. The red leak for this filter is included in the passbands used by the STIS ETC and synphot. Observers are encouraged to use these tools to predict source and background count rates carefully.
F25CN270
The 2700 Å continuum filter images a 25 × 25 arcsecond field of view and can be used to measure the continuum for Mg II emission line images. The F25CN270 filter integrated system throughput is shown in Figure 5.11 (see also F25CN270 - NUV-MAMA for sensitivities, signal-to-noise plots, and saturation plots). There is a substantial red leak in this filter starting at approximately 4200 Å and extending to at least 12,000 Å. For a K0 star, roughly 40% of the detected counts will be due to red leak. The red leak for this filter is included in the passbands used by the STIS ETC and synphot. Observers are encouraged to use these tools to predict source and background count rates carefully.
III]: F25CIII
The F25CIII filter images a 25 × 25 arcsecond field of view in the light of C III] at 1907–1909 Å. The F25CIII integrated system throughput is shown in Figure 5.12 (see also F25CIII - NUV-MAMA for sensitivities, signal-to-noise plots, and saturation plots). The out-of-band suppression for this filter is fairly good.
III and F25CN182 Integrated System Throughputs.
1800 Å Continuum: F25CN182
The 1800 Å continuum filter images a 25 × 25 arcsecond field of view, and can be used to measure the continuum for C III] emission line images. The F25CN182 filter integrated system throughput is shown in Figure 5.12 (see also F25CN182 - NUV-MAMA for sensitivities, signal-to-noise plots, and saturation plots).
Lyman Alpha: F25LYA and Clear-Minus-SRF2
The F25LYA filter images a 25 × 25 arcsecond field of view and can be used to obtain emission line images in the light of Lyman-α. The F25LYA filter integrated system throughput is shown in Figure 5.13 (see also F25LYA - FUV-MAMA, Lyman-α for sensitivities, signal-to-noise plots, and saturation plots).
At the price of a slightly wider bandpass, and the need to take two exposures, Lyman-α can be isolated by taking one image with the clear (25MAMA) aperture and a second with the longpass (F25SRF2) filter and differencing the two. The integrated system throughput for this imaging sequence is appreciably higher than for the narrowband F25LYA filter, as shown in Figure 5.13.
-
STIS Instrument Handbook
- • Acknowledgments
- Chapter 1: Introduction
-
Chapter 2: Special Considerations for Cycle 33
- • 2.1 Impacts of Reduced Gyro Mode on Planning Observations
- • 2.2 STIS Performance Changes Pre- and Post-SM4
- • 2.3 New Capabilities for Cycle 33
- • 2.4 Use of Available-but-Unsupported Capabilities
- • 2.5 Choosing Between COS and STIS
- • 2.6 Scheduling Efficiency and Visit Orbit Limits
- • 2.7 MAMA Scheduling Policies
- • 2.8 Prime and Parallel Observing: MAMA Bright-Object Constraints
- • 2.9 STIS Snapshot Program Policies
- Chapter 3: STIS Capabilities, Design, Operations, and Observations
- Chapter 4: Spectroscopy
- Chapter 5: Imaging
- Chapter 6: Exposure Time Calculations
- Chapter 7: Feasibility and Detector Performance
-
Chapter 8: Target Acquisition
- • 8.1 Introduction
- • 8.2 STIS Onboard CCD Target Acquisitions - ACQ
- • 8.3 Onboard Target Acquisition Peakups - ACQ PEAK
- • 8.4 Determining Coordinates in the International Celestial Reference System (ICRS) Reference Frame
- • 8.5 Acquisition Examples
- • 8.6 STIS Post-Observation Target Acquisition Analysis
- Chapter 9: Overheads and Orbit-Time Determination
- Chapter 10: Summary and Checklist
- Chapter 11: Data Taking
-
Chapter 12: Special Uses of STIS
- • 12.1 Slitless First-Order Spectroscopy
- • 12.2 Long-Slit Echelle Spectroscopy
- • 12.3 Time-Resolved Observations
- • 12.4 Observing Too-Bright Objects with STIS
- • 12.5 High Signal-to-Noise Ratio Observations
- • 12.6 Improving the Sampling of the Line Spread Function
- • 12.7 Considerations for Observing Planetary Targets
- • 12.8 Special Considerations for Extended Targets
- • 12.9 Parallel Observing with STIS
- • 12.10 Coronagraphic Spectroscopy
- • 12.11 Coronagraphic Imaging - 50CORON
- • 12.12 Spatial Scans with the STIS CCD
-
Chapter 13: Spectroscopic Reference Material
- • 13.1 Introduction
- • 13.2 Using the Information in this Chapter
-
13.3 Gratings
- • First-Order Grating G750L
- • First-Order Grating G750M
- • First-Order Grating G430L
- • First-Order Grating G430M
- • First-Order Grating G230LB
- • Comparison of G230LB and G230L
- • First-Order Grating G230MB
- • Comparison of G230MB and G230M
- • First-Order Grating G230L
- • First-Order Grating G230M
- • First-Order Grating G140L
- • First-Order Grating G140M
- • Echelle Grating E230M
- • Echelle Grating E230H
- • Echelle Grating E140M
- • Echelle Grating E140H
- • PRISM
- • PRISM Wavelength Relationship
-
13.4 Apertures
- • 52X0.05 Aperture
- • 52X0.05E1 and 52X0.05D1 Pseudo-Apertures
- • 52X0.1 Aperture
- • 52X0.1E1 and 52X0.1D1 Pseudo-Apertures
- • 52X0.2 Aperture
- • 52X0.2E1, 52X0.2E2, and 52X0.2D1 Pseudo-Apertures
- • 52X0.5 Aperture
- • 52X0.5E1, 52X0.5E2, and 52X0.5D1 Pseudo-Apertures
- • 52X2 Aperture
- • 52X2E1, 52X2E2, and 52X2D1 Pseudo-Apertures
- • 52X0.2F1 Aperture
- • 0.2X0.06 Aperture
- • 0.2X0.2 Aperture
- • 0.2X0.09 Aperture
- • 6X0.2 Aperture
- • 0.1X0.03 Aperture
- • FP-SPLIT Slits 0.2X0.06FP(A-E) Apertures
- • FP-SPLIT Slits 0.2X0.2FP(A-E) Apertures
- • 31X0.05ND(A-C) Apertures
- • 0.2X0.05ND Aperture
- • 0.3X0.05ND Aperture
- • F25NDQ Aperture
- 13.5 Spatial Profiles
- 13.6 Line Spread Functions
- • 13.7 Spectral Purity, Order Confusion, and Peculiarities
- • 13.8 MAMA Spectroscopic Bright Object Limits
-
Chapter 14: Imaging Reference Material
- • 14.1 Introduction
- • 14.2 Using the Information in this Chapter
- 14.3 CCD
- 14.4 NUV-MAMA
-
14.5 FUV-MAMA
- • 25MAMA - FUV-MAMA, Clear
- • 25MAMAD1 - FUV-MAMA Pseudo-Aperture
- • F25ND3 - FUV-MAMA
- • F25ND5 - FUV-MAMA
- • F25NDQ - FUV-MAMA
- • F25QTZ - FUV-MAMA, Longpass
- • F25QTZD1 - FUV-MAMA, Longpass Pseudo-Aperture
- • F25SRF2 - FUV-MAMA, Longpass
- • F25SRF2D1 - FUV-MAMA, Longpass Pseudo-Aperture
- • F25LYA - FUV-MAMA, Lyman-alpha
- • 14.6 Image Mode Geometric Distortion
- • 14.7 Spatial Dependence of the STIS PSF
- • 14.8 MAMA Imaging Bright Object Limits
- Chapter 15: Overview of Pipeline Calibration
- Chapter 16: Accuracies
-
Chapter 17: Calibration Status and Plans
- • 17.1 Introduction
- • 17.2 Ground Testing and Calibration
- • 17.3 STIS Installation and Verification (SMOV2)
- • 17.4 Cycle 7 Calibration
- • 17.5 Cycle 8 Calibration
- • 17.6 Cycle 9 Calibration
- • 17.7 Cycle 10 Calibration
- • 17.8 Cycle 11 Calibration
- • 17.9 Cycle 12 Calibration
- • 17.10 SM4 and SMOV4 Calibration
- • 17.11 Cycle 17 Calibration Plan
- • 17.12 Cycle 18 Calibration Plan
- • 17.13 Cycle 19 Calibration Plan
- • 17.14 Cycle 20 Calibration Plan
- • 17.15 Cycle 21 Calibration Plan
- • 17.16 Cycle 22 Calibration Plan
- • 17.17 Cycle 23 Calibration Plan
- • 17.18 Cycle 24 Calibration Plan
- • 17.19 Cycle 25 Calibration Plan
- • 17.20 Cycle 26 Calibration Plan
- • 17.21 Cycle 27 Calibration Plan
- • 17.22 Cycle 28 Calibration Plan
- • 17.23 Cycle 29 Calibration Plan
- • 17.24 Cycle 30 Calibration Plan
- • 17.25 Cycle 31 Calibration Plan
- • 17.26 Cycle 32 Calibration Plan
- Appendix A: Available-But-Unsupported Spectroscopic Capabilities
- • Glossary
