7.4 The MAMA Detectors
7.4.1 MAMA Properties
There are two MAMA detectors: the STIS/FUV-MAMA provides coverage from 1150 to 1700 Å and the STIS/NUV-MAMA provides coverage from 1600 to 3100 Å (with some additional, but lower response below 1600 Å). The STIS MAMA detectors are photon-counting devices that process events serially. They can be used to take data in either an accumulate (ACCUM) mode in which a time-integrated image is produced, or in a time series (TIME-TAG) mode in which the detector location and time of arrival of each photon event are recorded as an event stream (see Section 11.1.2 and Section 11.1.3, respectively). The primary benefits afforded by the STIS MAMAs, in comparison with previous HST UV spectroscopic detectors such as those of the GHRS and FOS, are high spatial resolution, two-dimensional imaging over a relatively large field of view, and low background for point sources. The MAMA detector was developed by J. Timothy and R. Bybee for X-ray and UV imaging applications. The properties of the STIS MAMA detectors are summarized in Table 7.7 and described in detail in Timothy (2016).
Table 7.7: STIS MAMA Detector Characteristics.
Characteristic |
|
|
Photocathode | CsI | Cs2Te |
Wavelength range | 1150–1700 Å | 1600–3100 Å |
Pixel format | 1024 × 1024 | 1024 × 1024 |
Pixel size | 25 × 25 μm | 25 × 25 μm |
Image mode | 0.0245" × 0.0247" (clear) | 0.0245" × 0.0248" |
Field of view | 25.1" × 25.3" (clear) | 25.1" × 25.4" |
Quantum efficiency | 24% @ 1216 Å | 9% @ 2537 Å |
Dark count | 5 × 10⁻⁶ to 6 × 10⁻⁴ counts/s/pix | 0.001 to 0.002 counts/s/pix |
Global count rate | 285,000 counts/s | 285,000 counts/s |
~220 counts/s/pix | ~340 counts/s/pix |
1 Rate at which counting shows 10% deviation from linearity. These count rates are well above the bright object screening limits (see Section 7.7.2).
2 The MAMA Linearity reference file was changed to use the 1% deviation from linearity values of ~22 counts/s/pix (FUV-MAMA) and ~34 counts/s/pix (NUV-MAMA) in September 1999 to better handle saturated pixels with high count rates that were not being flagged using the 10% deviation from linearity values.
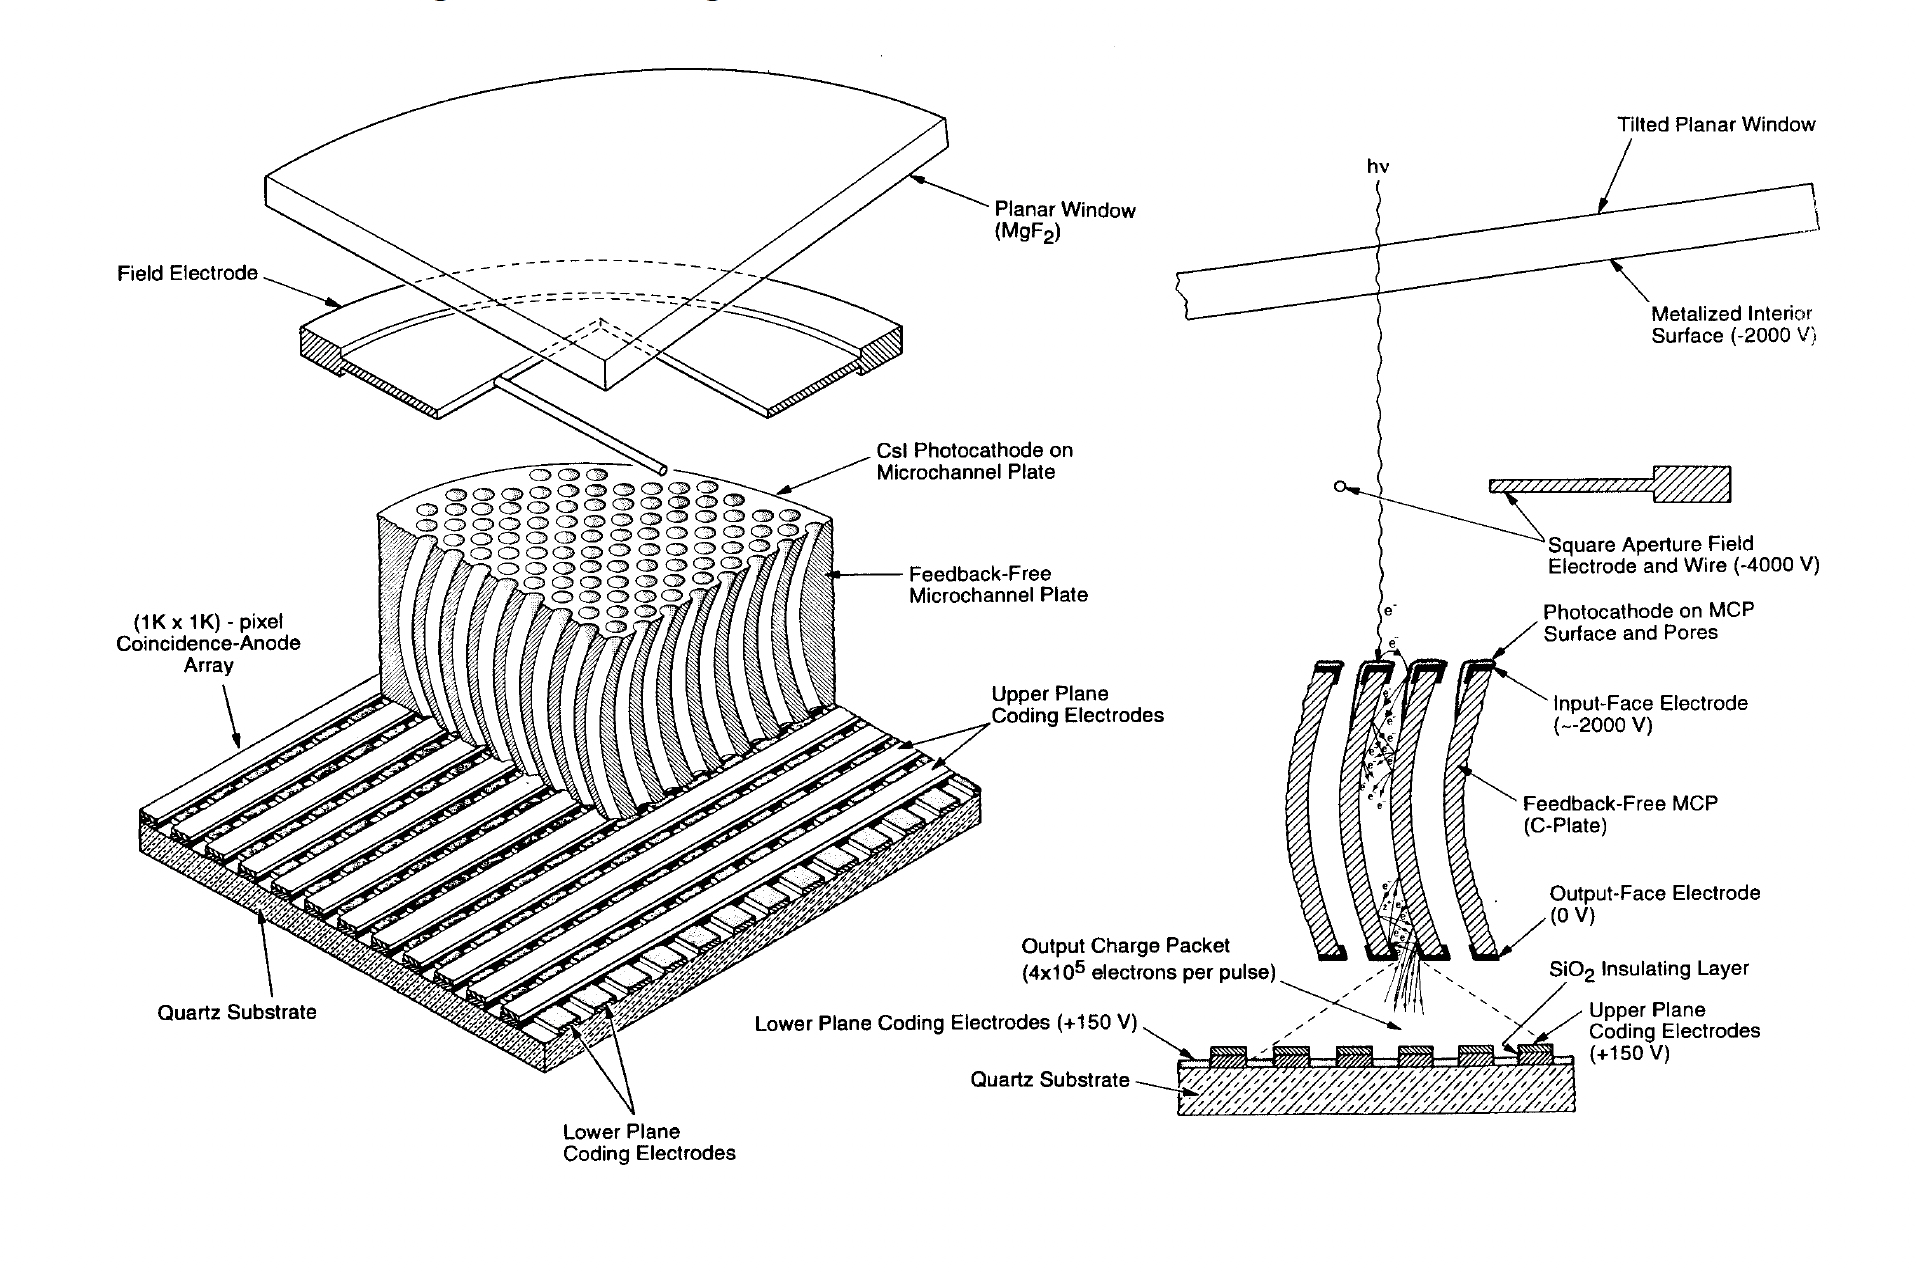
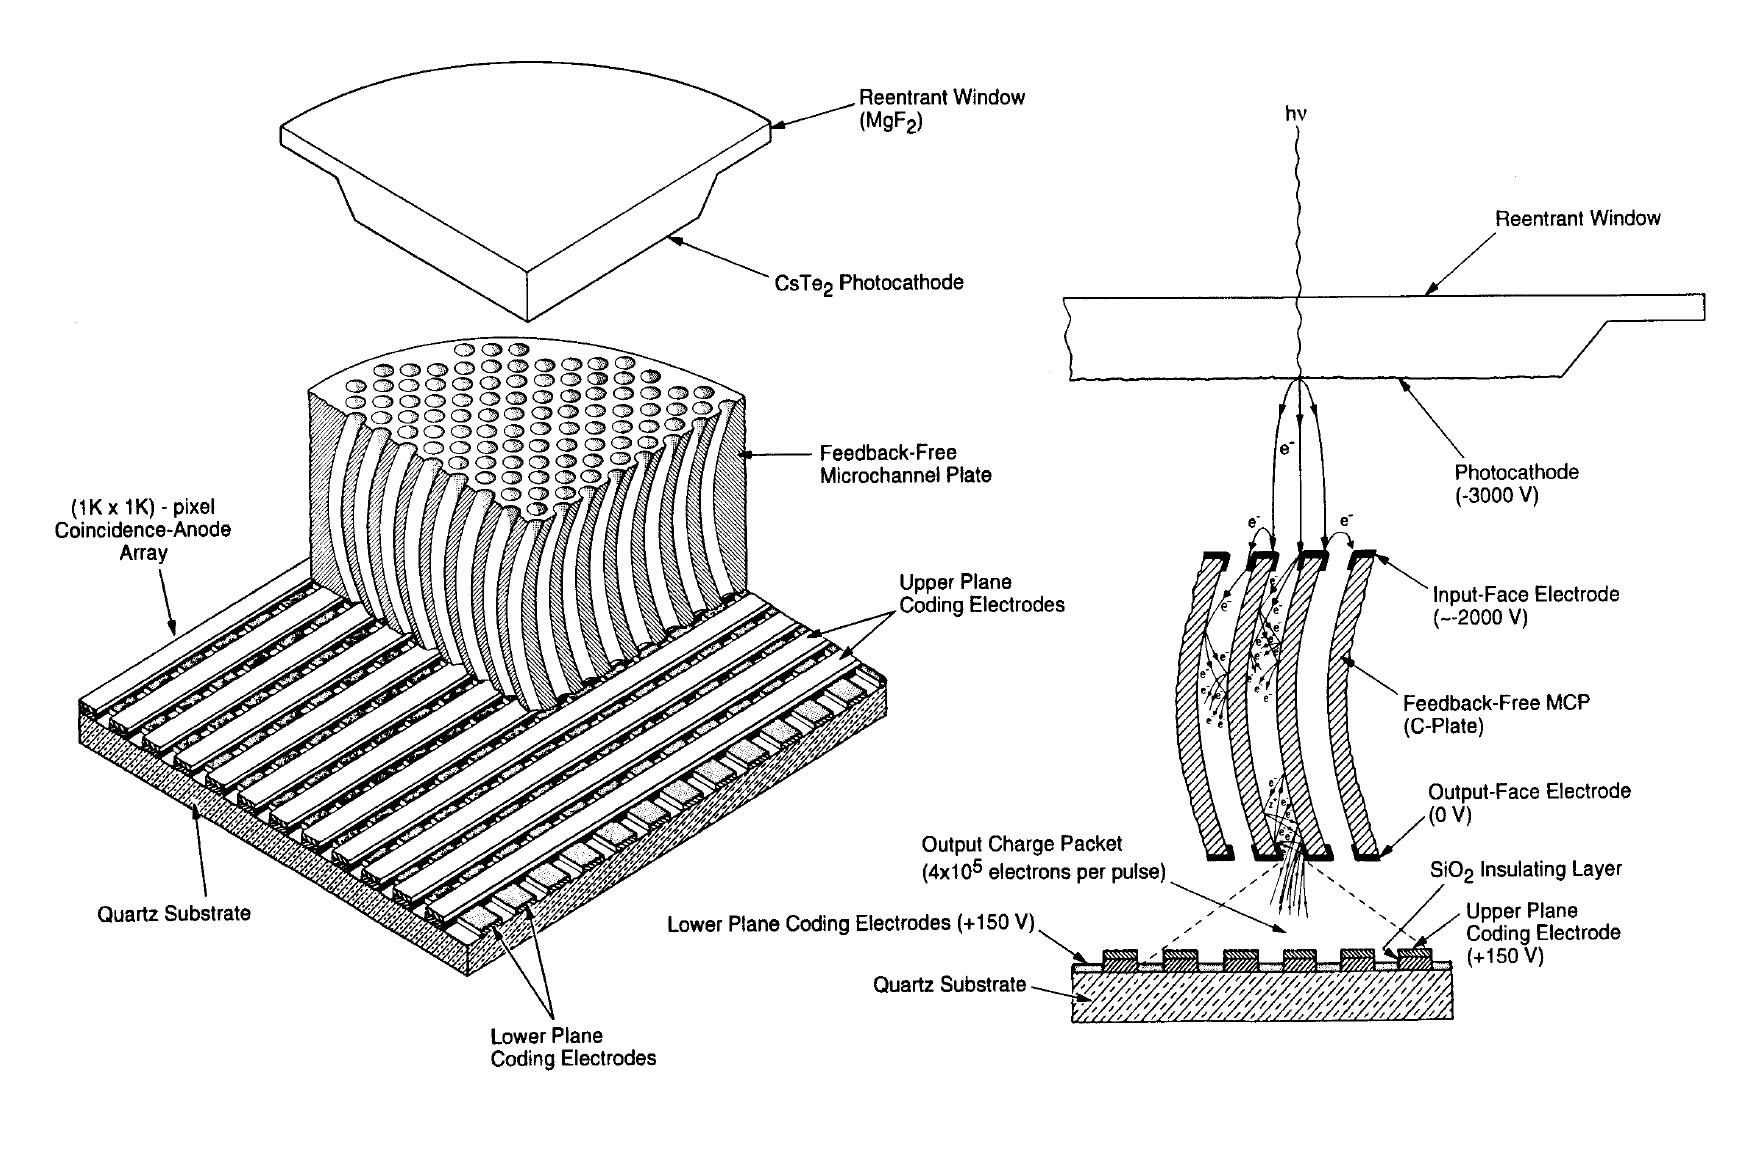
Figure 7.13 and Figure 7.14 illustrate the design of the FUV- and NUV-MAMA, respectively. A photocathode material is deposited on the front surface. The FUV-MAMA has an opaque CsI photocathode deposited directly on the face of the curved microchannel plate (MCP); the NUV-MAMA has a semi-transparent Cs2Te photocathode deposited on the back side of the detector's entrance window.
Target photons strike the photocathode, liberating single photoelectrons that pass into the microchannel plate (MCP). There they are multiplied to a pulse of ~4 × 10⁵ electrons. The pulse is recorded by an anode array behind the photocathode and detected by the MAMA electronics which process it, rejecting false pulses and determining the origin of the photon event on the detector.
The FUV-MAMA has a field electrode (repeller wire) which is used to repel electrons emitted away from the microchannel plate back into the channels. This provides an increase in quantum efficiency of the detector at the price of a small increase in the detector PSF halo. The repeller wire is normally on for FUV-MAMA observations (but see Section 7.4.4).
FUV-MAMA.
NUV-MAMA.
7.4.2 MAMA Spectral Response
The spectral responses of the unfiltered FUV- and NUV-MAMAs are illustrated in Figure 5.9. The peak photocathode response of the FUV-MAMA occurs at Lyman-α (1215.7 Å). Its spectral response is defined by the cutoff of the MgF2 window at 1150 Å at short wavelengths, and by the relatively steep decline of the CsI photocathode at long wavelengths. Out-of-band QE at longer wavelengths (>2000 Å) is <10–6 yielding excellent solar-blind performance. The NUV-MAMA spectral response has a relatively flat maximum (~10%) that encompasses 1800–2600 Å. The photocathode QE declines to ~4% at 3150 Å, while at longer wavelengths the out-of-band QE is ~10–4. (See also Section 5.3.3.)
7.4.3 MAMA Sensitivity
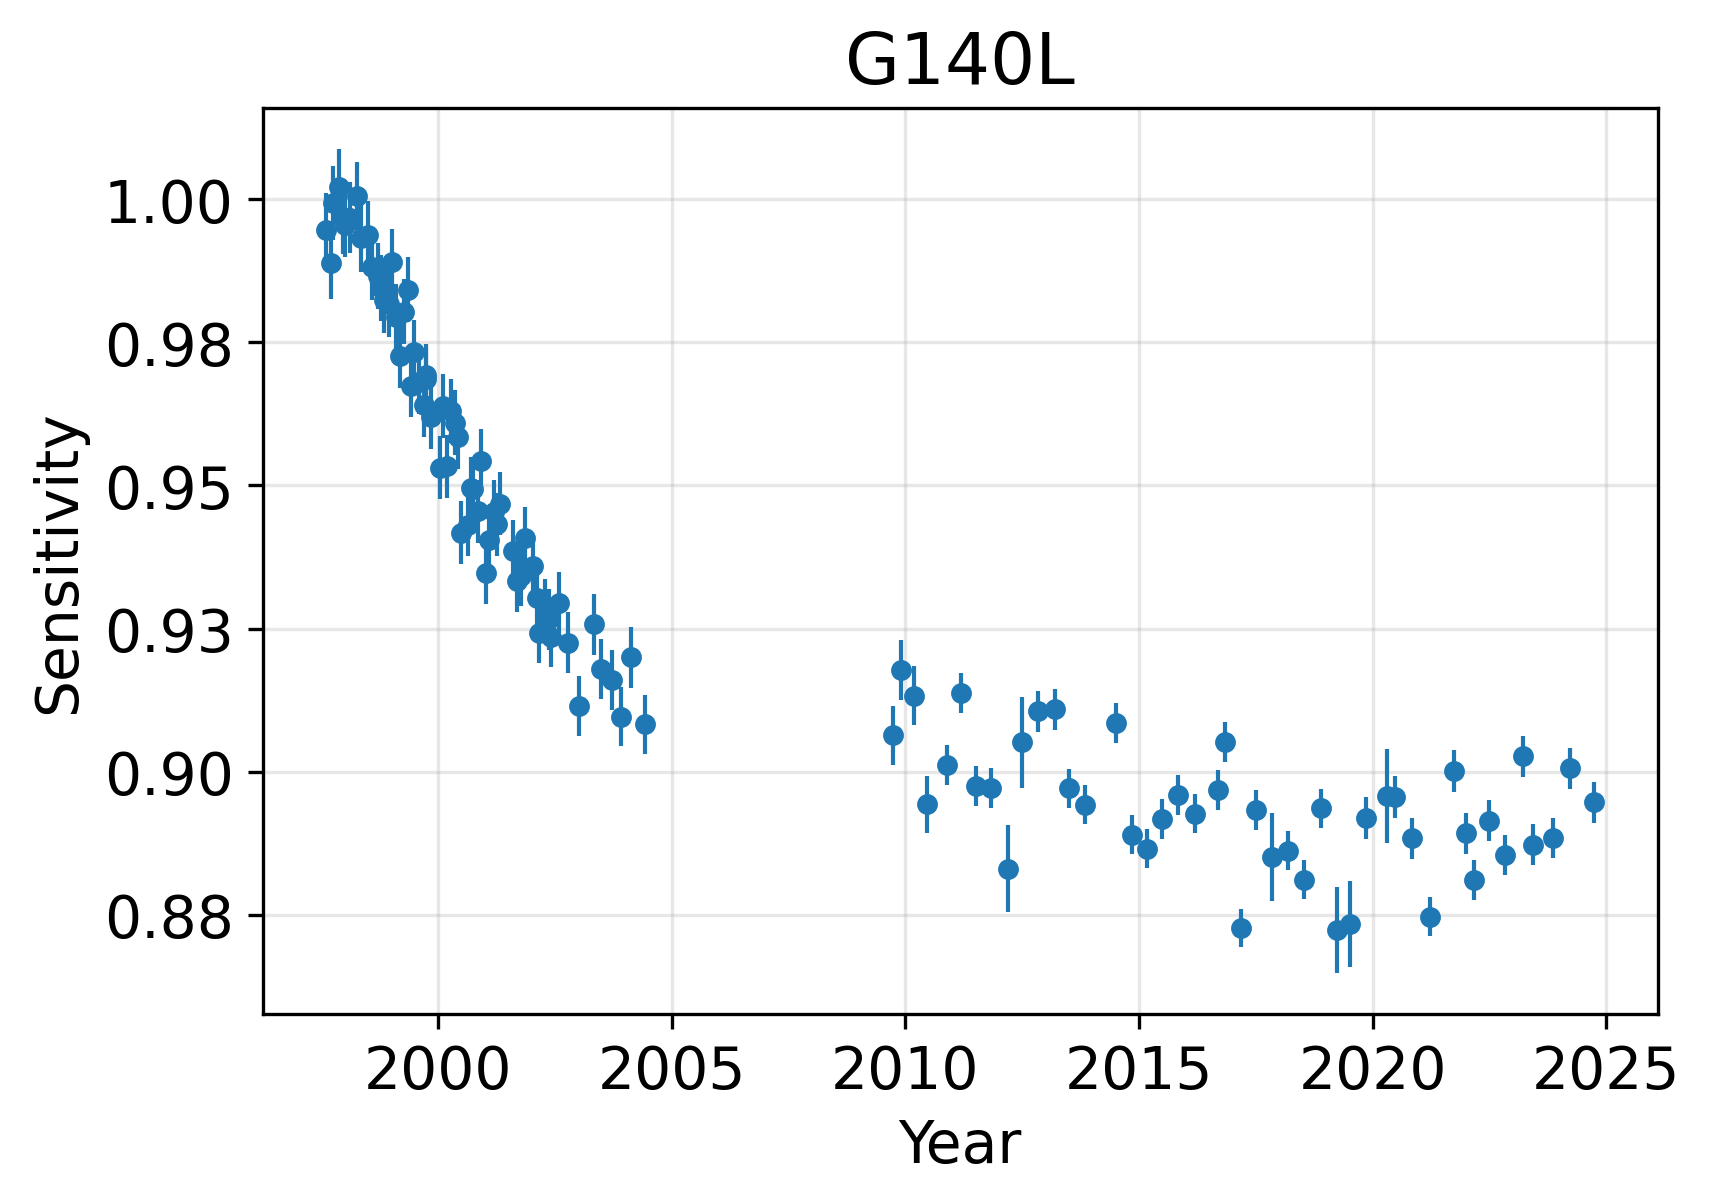
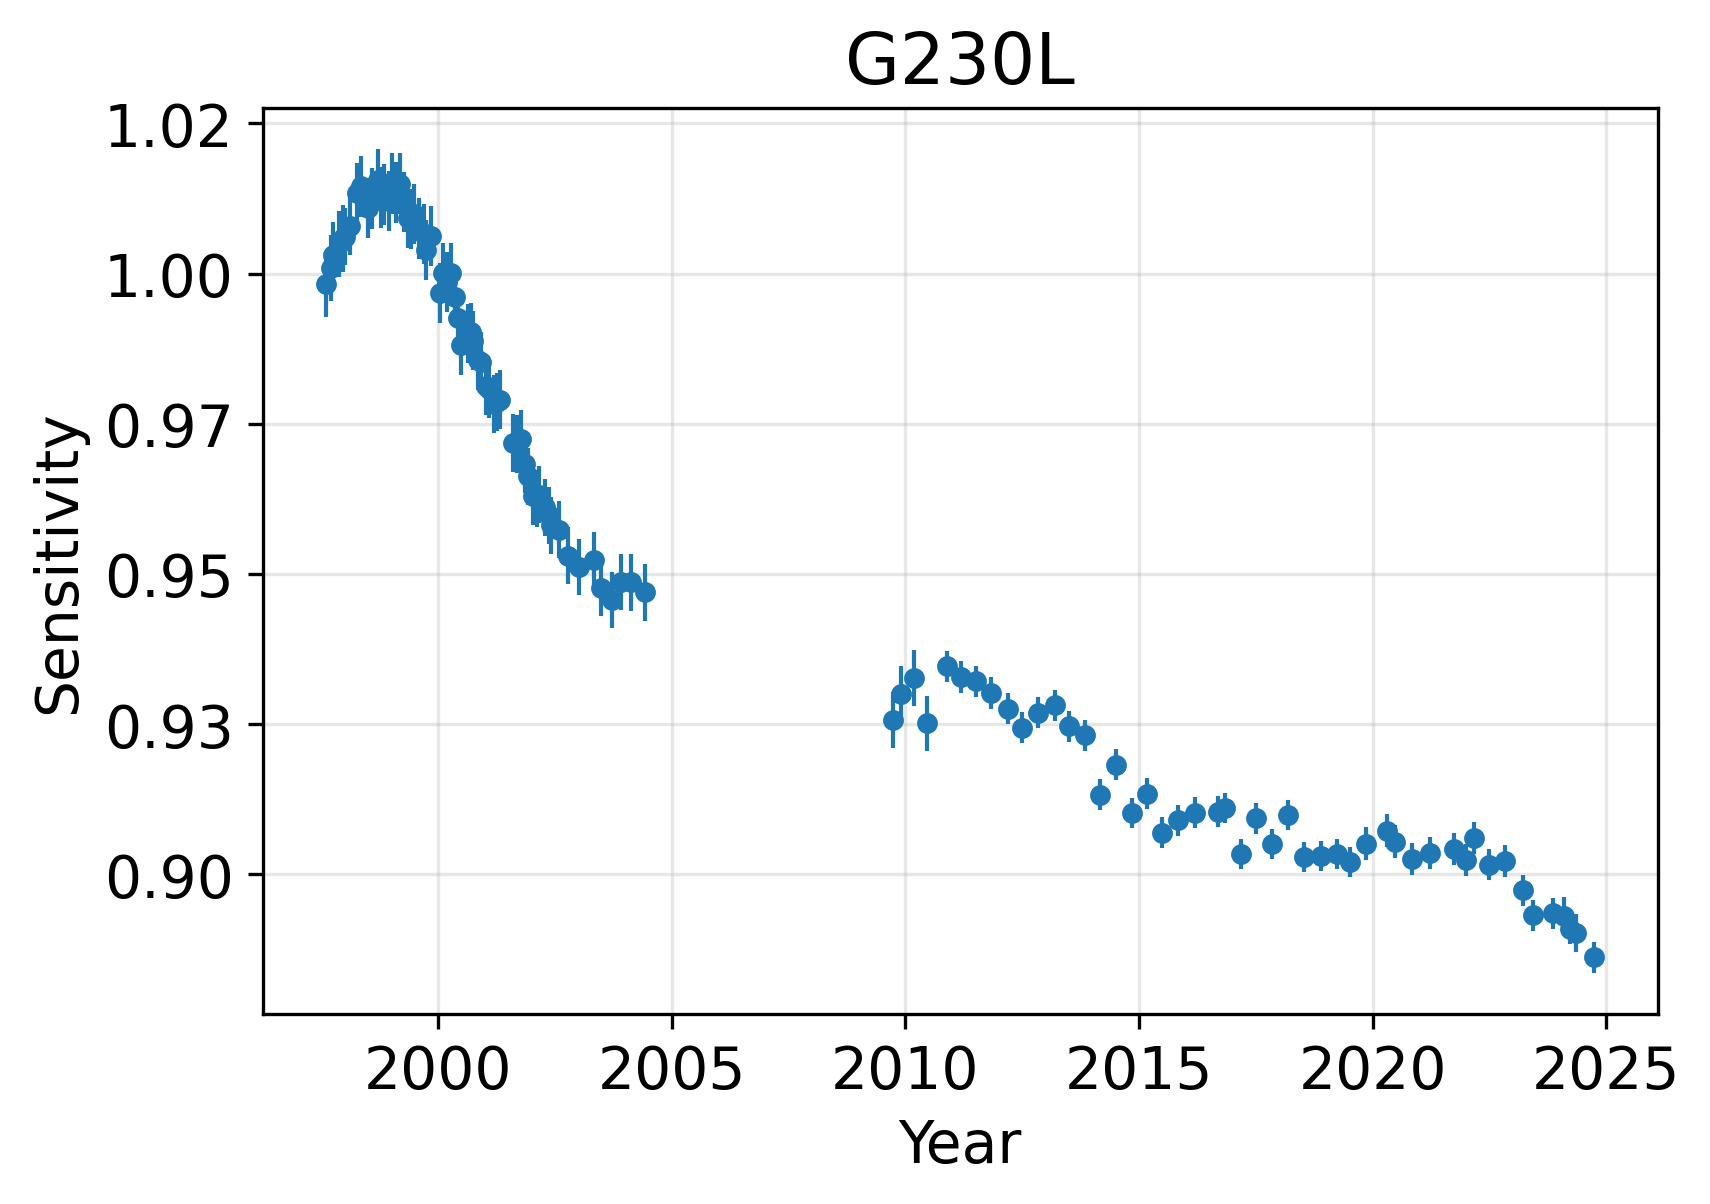
The STIS MAMA detector modes, similarly to those of the STIS CCD, suffer from changes in sensitivity that depend on wavelength, temperature, and time. A STIS Sensitivity Monitoring program similar to that aimed at characterizing the CCD behavior has been used to characterize the MAMAs (see Section 7.2 about the CCD program). The well-known sensitivity of the FUV-MAMA to temperature for the first-order mode G140L has been confirmed to be −0.32%/° C. No significant change with temperature for the NUV-MAMA first-order G230L mode has been registered. Following a correction for the temperature dependence, the sensitivities of the FUV first-order modes decrease linearly with time by wavelength-dependent amounts ranging up to a few percent per year. For the NUV first-order configurations, the sensitivities increased during the first 1.5 years of STIS operations and then began to drop, by wavelength-dependent amounts comparable to those in the FUV. There was a significant slow-down in the decline of the time-dependent sensitivity (TDS) of all STIS observational modes beginning in 2002. All detectors continued to decline during the years STIS was inoperative. For the STIS Echelle modes, the TDS corrections adopted are taken to be the same as for the corresponding low-order modes. New photometric throughput tables were created based on Cycle 17 data, and then were updated again in 2023 (July 2023 STAN). TDS corrections for all STIS spectra are implemented in the data reduction pipeline (see Section 15.1). Figure 7.15 shows the sensitivity trends for the STIS NUV and FUV MAMAs averaged over wavelength coverage. Note that sensitivity corrections are determined using discrete wavelength ranges within the overall wavelength coverage of a single low-resolution grating. Synphot and the ETC also include TDS corrections for STIS data. For Cycle 33, these default to the estimated throughputs for April, 2026.
G140L and G230L as a Function of Time.
7.4.4 Optical Performance
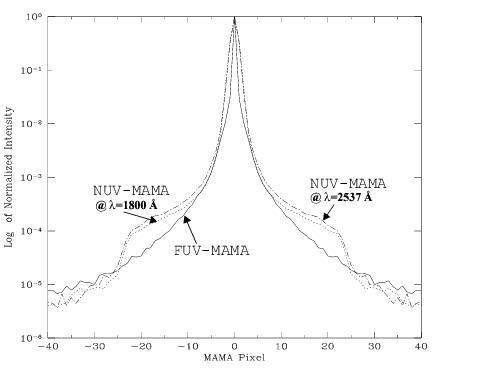
Both MAMAs exhibit low-level extended wings in their detector point spread functions (PSFs), with the NUV-MAMA PSF being considerably worse. Sample MAMA detector PSFs are shown in Figure 7.16. For those wishing to model their effect on absorption or emission line equivalent-width measurements or coronagraphic observations, the LSFs and detector PSFs are maintained on the STScI STIS website. Data for spectral modes LSFs can be found at:
http://www.stsci.edu/hst/instrumentation/stis/performance/spectral-resolution
Links to the plots of the imaging mode PSFs can be found in the table at:
http://www.stsci.edu/hst/instrumentation/stis/performance/image-quality.
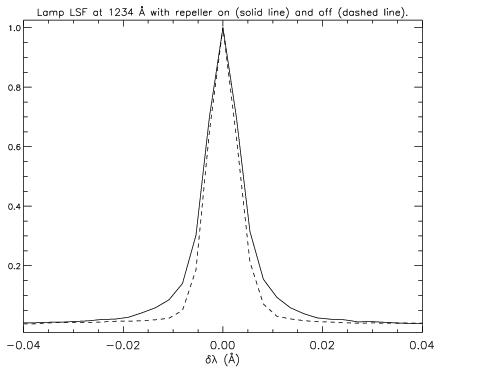
FUV-MAMA includes a repeller wire that establishes an electric field above the microchannel plate, to deflect forward-ejected photoelectrons back into the microchannel pores. The repeller wire is normally on for FUV-MAMA observations, but an improvement to the FUV-MAMA PSF (at the expense of a 35% decrease in sensitivity) can be made by disabling the high voltage to this wire. This procedure is only recommended for observations that use the E140H, and perhaps also the E140M, gratings when used with the 0.1X0.03 aperture (sometimes called the "Jenkins slit") for observations shortward of 1400 Å (see Section 3.1 on the smallest STIS apertures, caveat detailed in the footnote). In pre-launch testing, resolutions as high as R ~ 220,000 were obtained in observations of a mono-isotopic emission line lamp in highres mode, and R ~ 200,000 has been achieved on-orbit (e.g., Jenkins & Tripp 2001, ApJS, 137, 297). Figure 7.17 shows the effect of disabling the repeller voltage for the case of an observation of a line lamp with the E140H CENWAVE=1234 Å setting. Note that the main difference is not the FWHM of the central core, but a decrease in the intensity of the line wings.
Also note that, due to the large PSF of HST in imaging mode (currently 3.5 low-resolution pixels), there is no advantage in performing FUV-MAMA imaging observations with the repeller wire voltage turned off.
-
STIS Instrument Handbook
- • Acknowledgments
- Chapter 1: Introduction
-
Chapter 2: Special Considerations for Cycle 33
- • 2.1 Impacts of Reduced Gyro Mode on Planning Observations
- • 2.2 STIS Performance Changes Pre- and Post-SM4
- • 2.3 New Capabilities for Cycle 33
- • 2.4 Use of Available-but-Unsupported Capabilities
- • 2.5 Choosing Between COS and STIS
- • 2.6 Scheduling Efficiency and Visit Orbit Limits
- • 2.7 MAMA Scheduling Policies
- • 2.8 Prime and Parallel Observing: MAMA Bright-Object Constraints
- • 2.9 STIS Snapshot Program Policies
- Chapter 3: STIS Capabilities, Design, Operations, and Observations
- Chapter 4: Spectroscopy
- Chapter 5: Imaging
- Chapter 6: Exposure Time Calculations
- Chapter 7: Feasibility and Detector Performance
-
Chapter 8: Target Acquisition
- • 8.1 Introduction
- • 8.2 STIS Onboard CCD Target Acquisitions - ACQ
- • 8.3 Onboard Target Acquisition Peakups - ACQ PEAK
- • 8.4 Determining Coordinates in the International Celestial Reference System (ICRS) Reference Frame
- • 8.5 Acquisition Examples
- • 8.6 STIS Post-Observation Target Acquisition Analysis
- Chapter 9: Overheads and Orbit-Time Determination
- Chapter 10: Summary and Checklist
- Chapter 11: Data Taking
-
Chapter 12: Special Uses of STIS
- • 12.1 Slitless First-Order Spectroscopy
- • 12.2 Long-Slit Echelle Spectroscopy
- • 12.3 Time-Resolved Observations
- • 12.4 Observing Too-Bright Objects with STIS
- • 12.5 High Signal-to-Noise Ratio Observations
- • 12.6 Improving the Sampling of the Line Spread Function
- • 12.7 Considerations for Observing Planetary Targets
- • 12.8 Special Considerations for Extended Targets
- • 12.9 Parallel Observing with STIS
- • 12.10 Coronagraphic Spectroscopy
- • 12.11 Coronagraphic Imaging - 50CORON
- • 12.12 Spatial Scans with the STIS CCD
-
Chapter 13: Spectroscopic Reference Material
- • 13.1 Introduction
- • 13.2 Using the Information in this Chapter
-
13.3 Gratings
- • First-Order Grating G750L
- • First-Order Grating G750M
- • First-Order Grating G430L
- • First-Order Grating G430M
- • First-Order Grating G230LB
- • Comparison of G230LB and G230L
- • First-Order Grating G230MB
- • Comparison of G230MB and G230M
- • First-Order Grating G230L
- • First-Order Grating G230M
- • First-Order Grating G140L
- • First-Order Grating G140M
- • Echelle Grating E230M
- • Echelle Grating E230H
- • Echelle Grating E140M
- • Echelle Grating E140H
- • PRISM
- • PRISM Wavelength Relationship
-
13.4 Apertures
- • 52X0.05 Aperture
- • 52X0.05E1 and 52X0.05D1 Pseudo-Apertures
- • 52X0.1 Aperture
- • 52X0.1E1 and 52X0.1D1 Pseudo-Apertures
- • 52X0.2 Aperture
- • 52X0.2E1, 52X0.2E2, and 52X0.2D1 Pseudo-Apertures
- • 52X0.5 Aperture
- • 52X0.5E1, 52X0.5E2, and 52X0.5D1 Pseudo-Apertures
- • 52X2 Aperture
- • 52X2E1, 52X2E2, and 52X2D1 Pseudo-Apertures
- • 52X0.2F1 Aperture
- • 0.2X0.06 Aperture
- • 0.2X0.2 Aperture
- • 0.2X0.09 Aperture
- • 6X0.2 Aperture
- • 0.1X0.03 Aperture
- • FP-SPLIT Slits 0.2X0.06FP(A-E) Apertures
- • FP-SPLIT Slits 0.2X0.2FP(A-E) Apertures
- • 31X0.05ND(A-C) Apertures
- • 0.2X0.05ND Aperture
- • 0.3X0.05ND Aperture
- • F25NDQ Aperture
- 13.5 Spatial Profiles
- 13.6 Line Spread Functions
- • 13.7 Spectral Purity, Order Confusion, and Peculiarities
- • 13.8 MAMA Spectroscopic Bright Object Limits
-
Chapter 14: Imaging Reference Material
- • 14.1 Introduction
- • 14.2 Using the Information in this Chapter
- 14.3 CCD
- 14.4 NUV-MAMA
-
14.5 FUV-MAMA
- • 25MAMA - FUV-MAMA, Clear
- • 25MAMAD1 - FUV-MAMA Pseudo-Aperture
- • F25ND3 - FUV-MAMA
- • F25ND5 - FUV-MAMA
- • F25NDQ - FUV-MAMA
- • F25QTZ - FUV-MAMA, Longpass
- • F25QTZD1 - FUV-MAMA, Longpass Pseudo-Aperture
- • F25SRF2 - FUV-MAMA, Longpass
- • F25SRF2D1 - FUV-MAMA, Longpass Pseudo-Aperture
- • F25LYA - FUV-MAMA, Lyman-alpha
- • 14.6 Image Mode Geometric Distortion
- • 14.7 Spatial Dependence of the STIS PSF
- • 14.8 MAMA Imaging Bright Object Limits
- Chapter 15: Overview of Pipeline Calibration
- Chapter 16: Accuracies
-
Chapter 17: Calibration Status and Plans
- • 17.1 Introduction
- • 17.2 Ground Testing and Calibration
- • 17.3 STIS Installation and Verification (SMOV2)
- • 17.4 Cycle 7 Calibration
- • 17.5 Cycle 8 Calibration
- • 17.6 Cycle 9 Calibration
- • 17.7 Cycle 10 Calibration
- • 17.8 Cycle 11 Calibration
- • 17.9 Cycle 12 Calibration
- • 17.10 SM4 and SMOV4 Calibration
- • 17.11 Cycle 17 Calibration Plan
- • 17.12 Cycle 18 Calibration Plan
- • 17.13 Cycle 19 Calibration Plan
- • 17.14 Cycle 20 Calibration Plan
- • 17.15 Cycle 21 Calibration Plan
- • 17.16 Cycle 22 Calibration Plan
- • 17.17 Cycle 23 Calibration Plan
- • 17.18 Cycle 24 Calibration Plan
- • 17.19 Cycle 25 Calibration Plan
- • 17.20 Cycle 26 Calibration Plan
- • 17.21 Cycle 27 Calibration Plan
- • 17.22 Cycle 28 Calibration Plan
- • 17.23 Cycle 29 Calibration Plan
- • 17.24 Cycle 30 Calibration Plan
- • 17.25 Cycle 31 Calibration Plan
- • 17.26 Cycle 32 Calibration Plan
- Appendix A: Available-But-Unsupported Spectroscopic Capabilities
- • Glossary
