5.2 Optical CCD Imaging
The CCD imaging capability of STIS was designed primarily for target acquisitions, and therefore, only a small number of filters are available. Nevertheless, STIS CCD imaging has scientific utility of its own due to the high throughput and relatively low read noise of the CCD detector. STIS CCD imaging can be obtained as prime pointings or in parallel with other instruments.
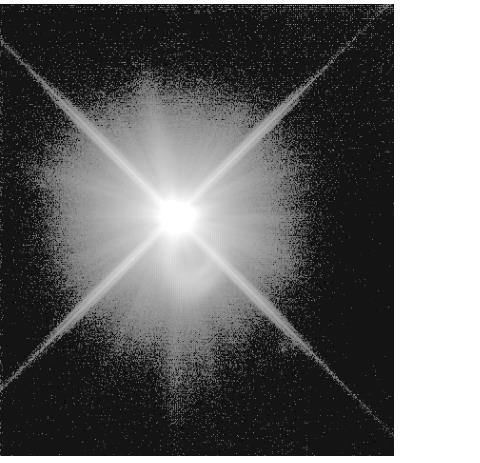
The optical performance of the CCD in imaging mode is good, and the plate scale of the CCD is 0.05078 arcseconds per pixel, providing a good compromise between sampling of the PSF and field of view. There is some degradation of the image quality towards the edge of the field. Observers can assume that 15–20% of the light from a point source falls in a single STIS CCD pixel and that ~80% of the light from a point source is contained within a 5 × 5 pixel region. An image of a typical point source is shown in Figure 5.4. See Chapter 14 for encircled energies at the field center for the different imaging modes and information on the field dependence of the PSF. For a discussion of the coronagraphic mask, see Section 12.11.
5.2.1 Effect of the Optical Baffles on STIS CCD Imaging
Calibration observations were taken to investigate whether the baffle structures around the CCD detector scatter light from the stars outside the CCD detector into its field of view, and if so, by how much. Images were taken with a bright star placed at 12 different positions, 10 arcseconds and 37 arcseconds away from the edge of the detector. The analysis of the images showed that there are no measurable scattering components by the baffle structures around the detector. Placing the bright star beyond the edge of the detector thus acts as an effective coronagraph for the STIS CCD detector (see Proffitt et al. 2004, ApJ, 612, 481 for more details).
5.2.2 Unfiltered (Clear) CCD Imaging: 50CCD and 50CORON
The 50CCD aperture is a clear, unvignetted aperture which provides maximum sensitivity over the full 52 × 52 arcsecond field of view. The shape of the bandpass is governed by the detector, which has sensitivity from ~2000 to 10,300 Å. Figure 5.1 shows the throughput as a function of wavelength for this imaging mode (see also Chapter 14 for sensitivities, signal-to-noise plots, and saturation plots).
The coronagraphic aperture 50CORON contains two wedges and a bar which can be used to occult a bright object. The unocculted parts of the aperture are clear, and so the throughput as a function of wavelength is the same as for the 50CCD aperture. Further details about this aperture as well as advice for conducting STIS coronagraphic observations are given in Section 12.11.
5.2.3 Optical Longpass: F28X50LP
The STIS longpass filter cuts off at λ < 5500 Å. It images a 28 × 52 arcsecond field of view. The F28X50LP filter is the principal target acquisition aperture (see Selecting the Imaging Aperture). The integrated system throughput for this filter is given in Figure 5.1 (see also Section 14.3 CCD Long-Pass Imaging F28X50LP for sensitivities, signal-to-noise plots, and saturation plots).
5.2.4 [OIII]: F28X50OIII
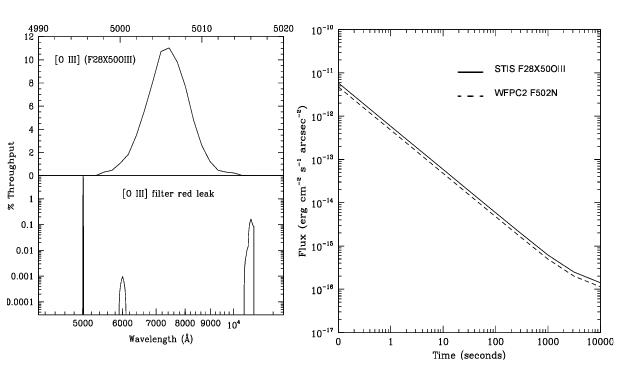
This filter images a 28 × 50 arcsecond field of view and can be used in target acquisitions or for direct imaging in the light of [O III]. The [O III] filter integrated system throughput and a signal-to-noise comparison with the WFPC2 [O III] filter are shown in Figure 5.5 (see also Section 14.3 F28X50OIII - CCD for sensitivities, signal-to-noise plots, and saturation plots). The STIS [O III] filter is very narrow: only 6.2 Å wide, compared to the WFC3 [O III] filter which is roughly 65 Å wide. The STIS [O III] filter has a substantial red leak that begins at 10,600 Å and continues to at least 12,000 Å. In the case of a very red star (K0 spectral type), the red leak will contribute approximately one-third of the detected counts. The red leak for this filter is included in the passbands used by the STIS ETC and synphot. Observers are encouraged to use these tools to predict source and background count rates carefully.
F28X50OIII Throughput and Flux vs. Exposure Time.5.2.5 [O II]: F28X50OII
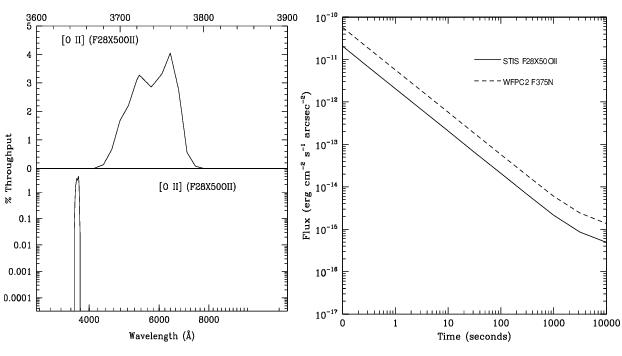
The [O II] filter images a 28 × 52 arcsecond field of view and can be used in target acquisitions or for direct imaging in the light of [O II]. The [O II] filter integrated system throughput and a signal-to-noise ratio comparison with WFPC2's [O II] filter are shown in Figure 5.6. See Section 14.3 F28X50OII - CCD for sensitivities, signal-to-noise and saturation plots.
F28X50OII: Throughput and Flux vs. Exposure Time.
-
STIS Instrument Handbook
- • Acknowledgments
- Chapter 1: Introduction
-
Chapter 2: Special Considerations for Cycle 33
- • 2.1 Impacts of Reduced Gyro Mode on Planning Observations
- • 2.2 STIS Performance Changes Pre- and Post-SM4
- • 2.3 New Capabilities for Cycle 33
- • 2.4 Use of Available-but-Unsupported Capabilities
- • 2.5 Choosing Between COS and STIS
- • 2.6 Scheduling Efficiency and Visit Orbit Limits
- • 2.7 MAMA Scheduling Policies
- • 2.8 Prime and Parallel Observing: MAMA Bright-Object Constraints
- • 2.9 STIS Snapshot Program Policies
- Chapter 3: STIS Capabilities, Design, Operations, and Observations
- Chapter 4: Spectroscopy
- Chapter 5: Imaging
- Chapter 6: Exposure Time Calculations
- Chapter 7: Feasibility and Detector Performance
-
Chapter 8: Target Acquisition
- • 8.1 Introduction
- • 8.2 STIS Onboard CCD Target Acquisitions - ACQ
- • 8.3 Onboard Target Acquisition Peakups - ACQ PEAK
- • 8.4 Determining Coordinates in the International Celestial Reference System (ICRS) Reference Frame
- • 8.5 Acquisition Examples
- • 8.6 STIS Post-Observation Target Acquisition Analysis
- Chapter 9: Overheads and Orbit-Time Determination
- Chapter 10: Summary and Checklist
- Chapter 11: Data Taking
-
Chapter 12: Special Uses of STIS
- • 12.1 Slitless First-Order Spectroscopy
- • 12.2 Long-Slit Echelle Spectroscopy
- • 12.3 Time-Resolved Observations
- • 12.4 Observing Too-Bright Objects with STIS
- • 12.5 High Signal-to-Noise Ratio Observations
- • 12.6 Improving the Sampling of the Line Spread Function
- • 12.7 Considerations for Observing Planetary Targets
- • 12.8 Special Considerations for Extended Targets
- • 12.9 Parallel Observing with STIS
- • 12.10 Coronagraphic Spectroscopy
- • 12.11 Coronagraphic Imaging - 50CORON
- • 12.12 Spatial Scans with the STIS CCD
-
Chapter 13: Spectroscopic Reference Material
- • 13.1 Introduction
- • 13.2 Using the Information in this Chapter
-
13.3 Gratings
- • First-Order Grating G750L
- • First-Order Grating G750M
- • First-Order Grating G430L
- • First-Order Grating G430M
- • First-Order Grating G230LB
- • Comparison of G230LB and G230L
- • First-Order Grating G230MB
- • Comparison of G230MB and G230M
- • First-Order Grating G230L
- • First-Order Grating G230M
- • First-Order Grating G140L
- • First-Order Grating G140M
- • Echelle Grating E230M
- • Echelle Grating E230H
- • Echelle Grating E140M
- • Echelle Grating E140H
- • PRISM
- • PRISM Wavelength Relationship
-
13.4 Apertures
- • 52X0.05 Aperture
- • 52X0.05E1 and 52X0.05D1 Pseudo-Apertures
- • 52X0.1 Aperture
- • 52X0.1E1 and 52X0.1D1 Pseudo-Apertures
- • 52X0.2 Aperture
- • 52X0.2E1, 52X0.2E2, and 52X0.2D1 Pseudo-Apertures
- • 52X0.5 Aperture
- • 52X0.5E1, 52X0.5E2, and 52X0.5D1 Pseudo-Apertures
- • 52X2 Aperture
- • 52X2E1, 52X2E2, and 52X2D1 Pseudo-Apertures
- • 52X0.2F1 Aperture
- • 0.2X0.06 Aperture
- • 0.2X0.2 Aperture
- • 0.2X0.09 Aperture
- • 6X0.2 Aperture
- • 0.1X0.03 Aperture
- • FP-SPLIT Slits 0.2X0.06FP(A-E) Apertures
- • FP-SPLIT Slits 0.2X0.2FP(A-E) Apertures
- • 31X0.05ND(A-C) Apertures
- • 0.2X0.05ND Aperture
- • 0.3X0.05ND Aperture
- • F25NDQ Aperture
- 13.5 Spatial Profiles
- 13.6 Line Spread Functions
- • 13.7 Spectral Purity, Order Confusion, and Peculiarities
- • 13.8 MAMA Spectroscopic Bright Object Limits
-
Chapter 14: Imaging Reference Material
- • 14.1 Introduction
- • 14.2 Using the Information in this Chapter
- 14.3 CCD
- 14.4 NUV-MAMA
-
14.5 FUV-MAMA
- • 25MAMA - FUV-MAMA, Clear
- • 25MAMAD1 - FUV-MAMA Pseudo-Aperture
- • F25ND3 - FUV-MAMA
- • F25ND5 - FUV-MAMA
- • F25NDQ - FUV-MAMA
- • F25QTZ - FUV-MAMA, Longpass
- • F25QTZD1 - FUV-MAMA, Longpass Pseudo-Aperture
- • F25SRF2 - FUV-MAMA, Longpass
- • F25SRF2D1 - FUV-MAMA, Longpass Pseudo-Aperture
- • F25LYA - FUV-MAMA, Lyman-alpha
- • 14.6 Image Mode Geometric Distortion
- • 14.7 Spatial Dependence of the STIS PSF
- • 14.8 MAMA Imaging Bright Object Limits
- Chapter 15: Overview of Pipeline Calibration
- Chapter 16: Accuracies
-
Chapter 17: Calibration Status and Plans
- • 17.1 Introduction
- • 17.2 Ground Testing and Calibration
- • 17.3 STIS Installation and Verification (SMOV2)
- • 17.4 Cycle 7 Calibration
- • 17.5 Cycle 8 Calibration
- • 17.6 Cycle 9 Calibration
- • 17.7 Cycle 10 Calibration
- • 17.8 Cycle 11 Calibration
- • 17.9 Cycle 12 Calibration
- • 17.10 SM4 and SMOV4 Calibration
- • 17.11 Cycle 17 Calibration Plan
- • 17.12 Cycle 18 Calibration Plan
- • 17.13 Cycle 19 Calibration Plan
- • 17.14 Cycle 20 Calibration Plan
- • 17.15 Cycle 21 Calibration Plan
- • 17.16 Cycle 22 Calibration Plan
- • 17.17 Cycle 23 Calibration Plan
- • 17.18 Cycle 24 Calibration Plan
- • 17.19 Cycle 25 Calibration Plan
- • 17.20 Cycle 26 Calibration Plan
- • 17.21 Cycle 27 Calibration Plan
- • 17.22 Cycle 28 Calibration Plan
- • 17.23 Cycle 29 Calibration Plan
- • 17.24 Cycle 30 Calibration Plan
- • 17.25 Cycle 31 Calibration Plan
- • 17.26 Cycle 32 Calibration Plan
- Appendix A: Available-But-Unsupported Spectroscopic Capabilities
- • Glossary


