3.3 Comparison of WFC3 with Other Imaging Instruments
3.3.1 Wavelength Coverage
The WFC3 UVIS channel is similar in design to the Wide Field Channel (WFC) of the ACS. There are, however, a few differences. While ACS/WFC is unable to detect wavelengths shorter than about 370 nm (i.e., shortward of the B band), WFC3/UVIS has excellent sensitivity extending down to 200 nm. The design trade-offs adopted to achieve this extended UV wavelength coverage (primarily the CCD coating and the use of aluminum coatings for the reflective optics) lead to a reduced sensitivity of WFC3 at longer optical wavelengths compared to that of ACS/WFC. WFC3/UVIS has no sensitivity in the far-UV region below 200 nm. The far-UV is covered by three MAMA detectors in ACS and STIS.
As discussed in Section 3.3.5, both the UVIS and IR detectors have significant wavelength overlap with JWST's Near Infrared Camera (NIRCam) instrument. In Section 3.3.6, we discuss wavelength overlap with the Roman Space Telescope Wide Field Instrument (WFI).
3.3.2 Field of View
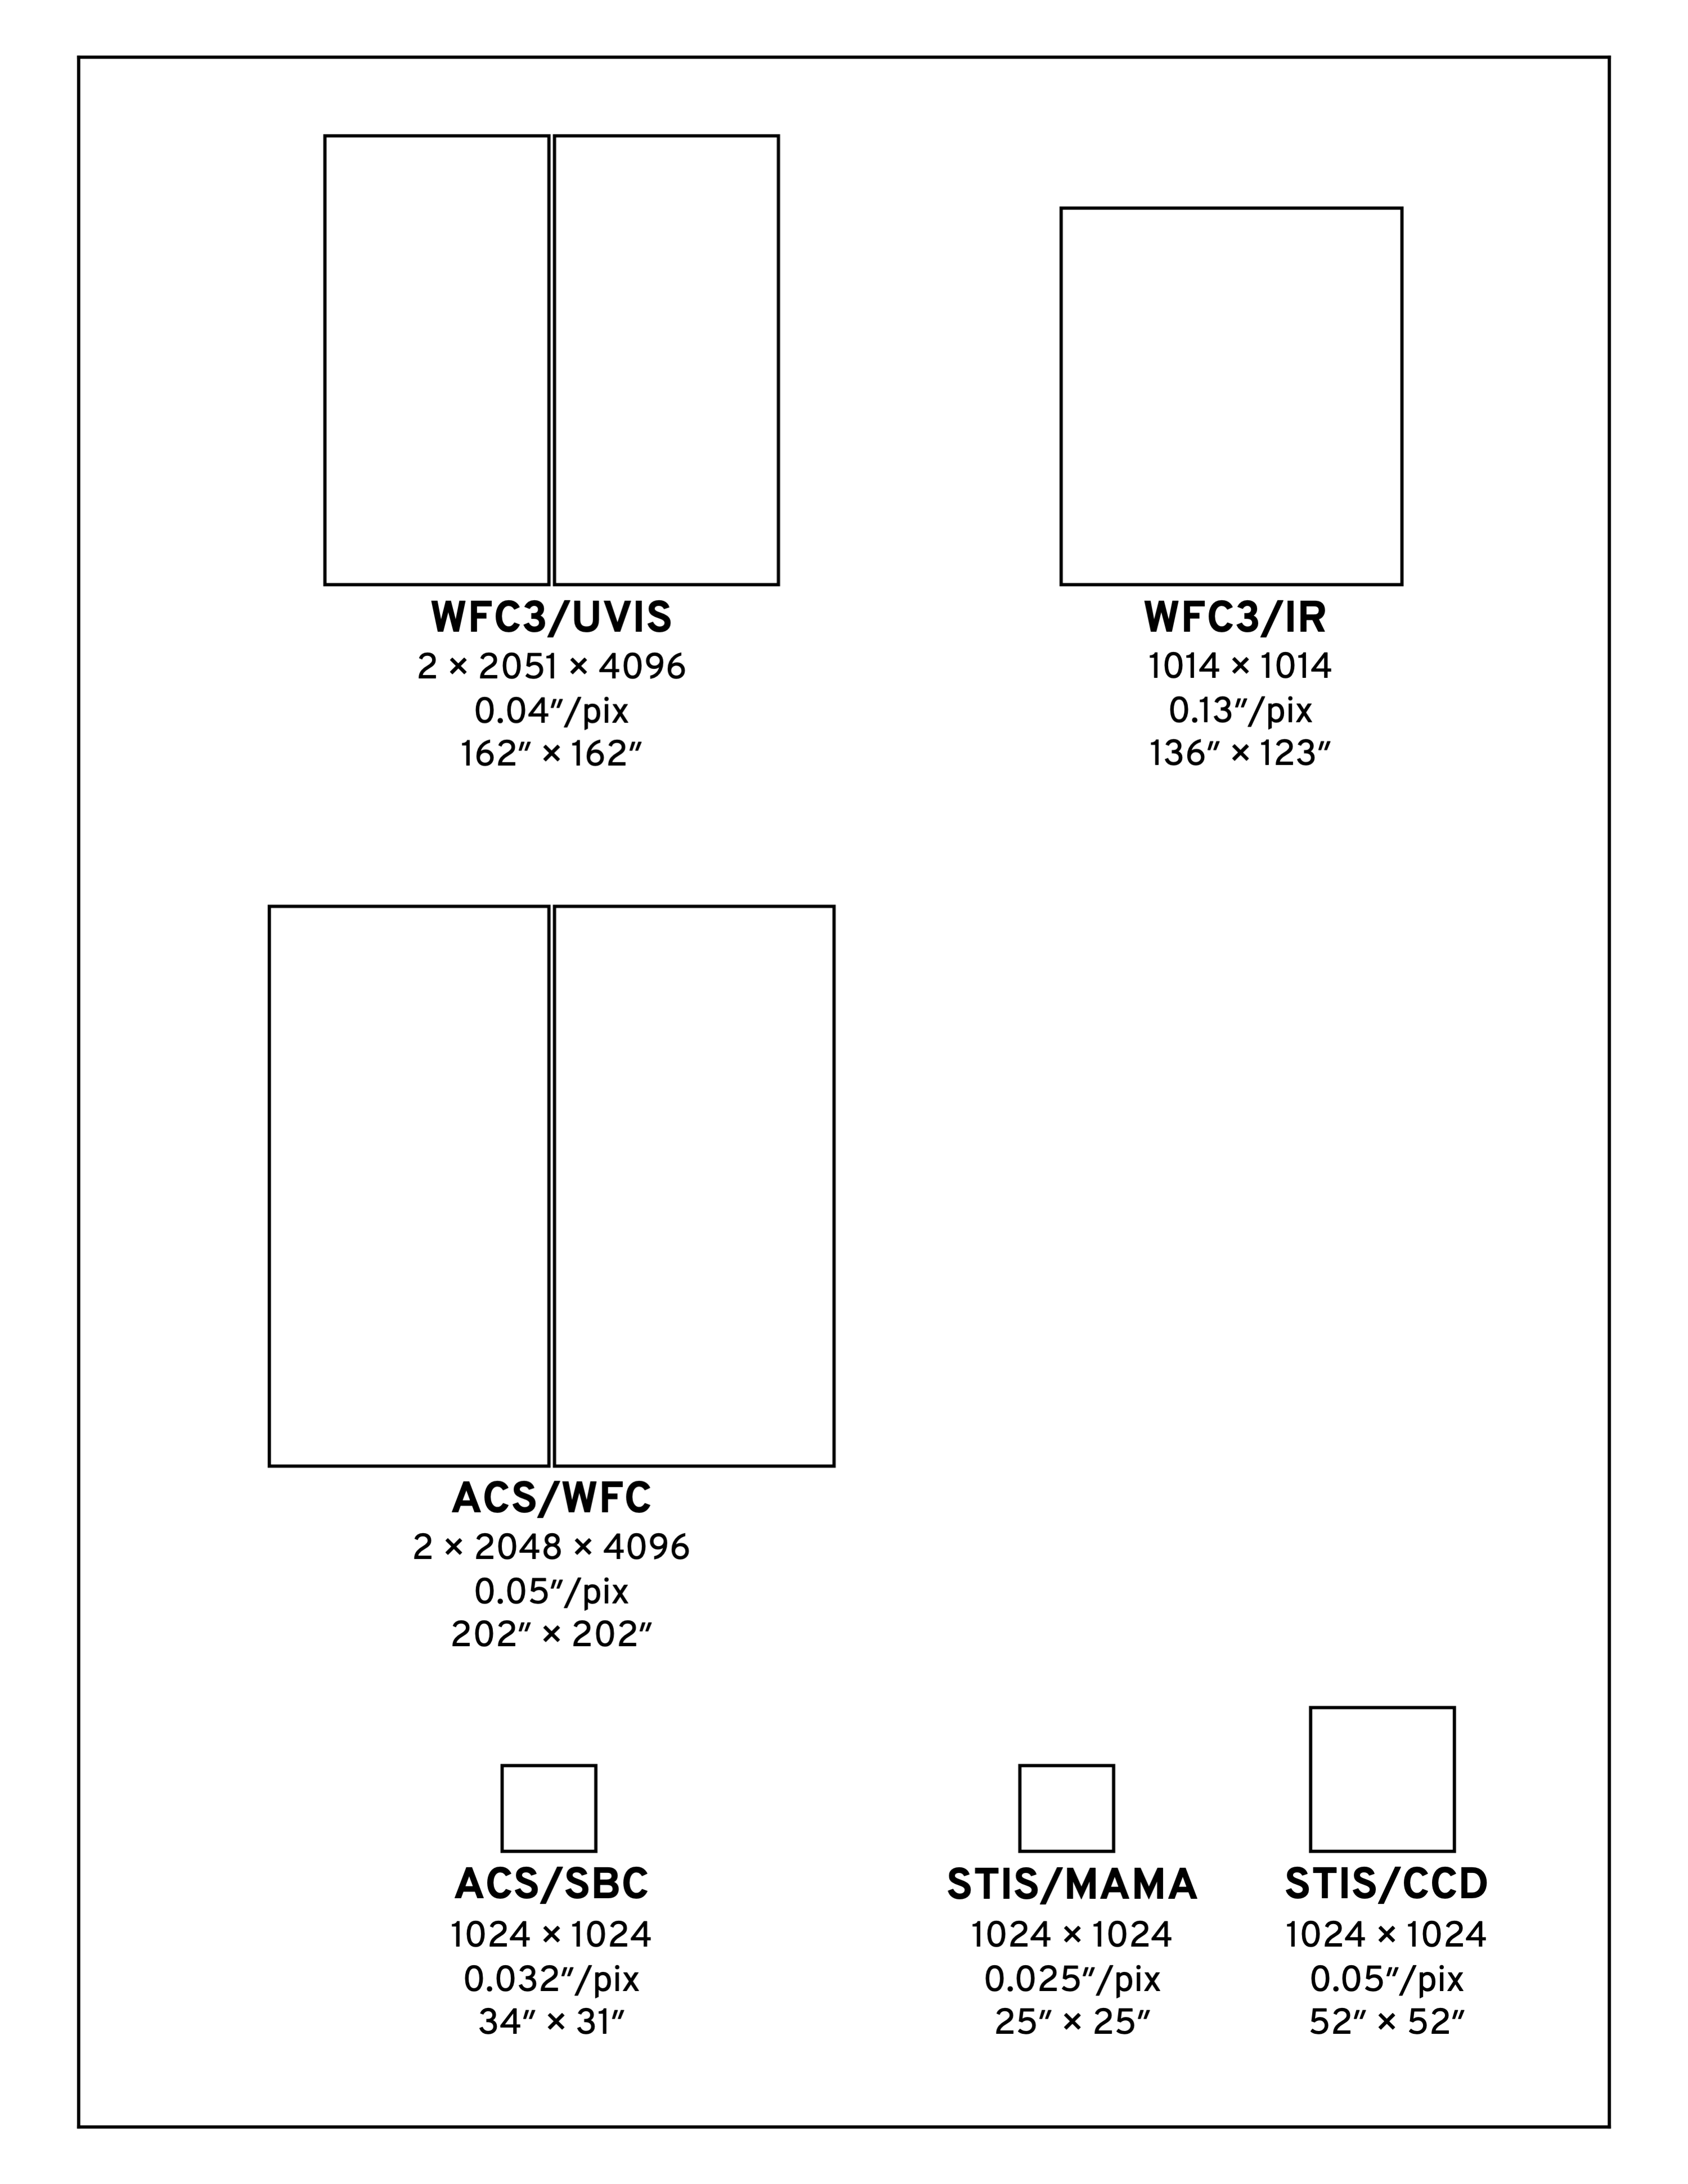
Figure 3.1 illustrates the fields of view, at the same scale, for the HST imaging instruments onboard HST in 2024. Note that the pixel scale of the WFC3 UVIS channel is 20% finer in comparison to the ACS/WFC, obtained at the cost of covering only about 64% of the area of the ACS field of view.
Figure 3.1: Schematic diagram comparing relative sizes of the fields of view for HST imaging instruments. Successive lines of text underneath each field of view give the field size in pixels, the pixel scale in arcsec/pixel, and the field size in arcsec. Detector footprints are rendered as rectangular in the diagram and thus do not include the effects of geometric distortion. For a more accurate depiction of detector footprints including geometric distortions and relative HST focal plane locations, see Figure 2.2.
Warning: ACS/WFC (as well as WFC3/IR) may not be offered for new programs in Cycle 34; please refer to the Cycle 34 Call for Proposals for the most up-to-date information.
3.3.3 Detector Performance
Table 3.2 summarizes the on-orbit measurements of read-out noise and dark current for the WFC3 detectors, and compares them with the parameters for the other currently available HST imaging detectors. Chapter 5 gives more detailed information about the detectors in both channels. Chapter 9 discusses sensitivities, limiting magnitudes, and exposure times.
Table 3.2: Characteristics of HST CCD and HgCdTe imaging detectors currently available.
Detector | Read-out noise | Dark current (e–/pix/s) | Mean well Depth |
WFC3/UVIS | 3.1–3.2 | 0.003 | 63,000-72,000 |
ACS/WFC | 3.7-5.6 | 0.014 | 72,000-84,000 |
STIS/CCD | 5.4 (gain=1), | 0.009 | 114,000 |
WFC3/IR | ~12.01 | 0.05 | 77,900 |
1 WFC3/IR read noise is for a 16-read linear fit. WFC3/IR double sampling read noise is 20.2–21.4 e–.
3.3.4 System Throughputs and Discovery Efficiencies
Figure 3.2 plots the measured on-orbit system throughputs of the two WFC3 channels as functions of wavelength, compared to those of ACS, NICMOS, and WFPC2. These curves include the throughput of the OTA, all of the optical elements of the instruments themselves, and the sensitivities of the detectors. Throughputs were calculated at the central wavelength (the “pivot wavelength”; see footnote 3 in Table 6.2) of each wide-band filter of each instrument.
As Figure 3.2 shows, WFC3 offers a unique combination of high sensitivity and wide spectral coverage ranging from the UV to the near-IR. WFC3 extends and complements, over a large field of view, the optical performance of ACS/WFC at wavelengths shorter than ~400 nm and longer than 1000 nm. The good degree of functional redundancy with ACS will help ensure that the unique scientific capabilities of HST, at optical wavelengths, will remain available until the end of its mission.
Figure 3.2: System throughputs of optical/infrared imaging instruments on HST as functions of wavelength. The plotted quantities are end-to-end throughputs, including filter transmissions, calculated at the pivot wavelength of each wide-band filter of each camera. Plot reproduced from Figure 2.1 of the Cycle 33 ACS Instrument Handbook (Stark, et al. 2024).
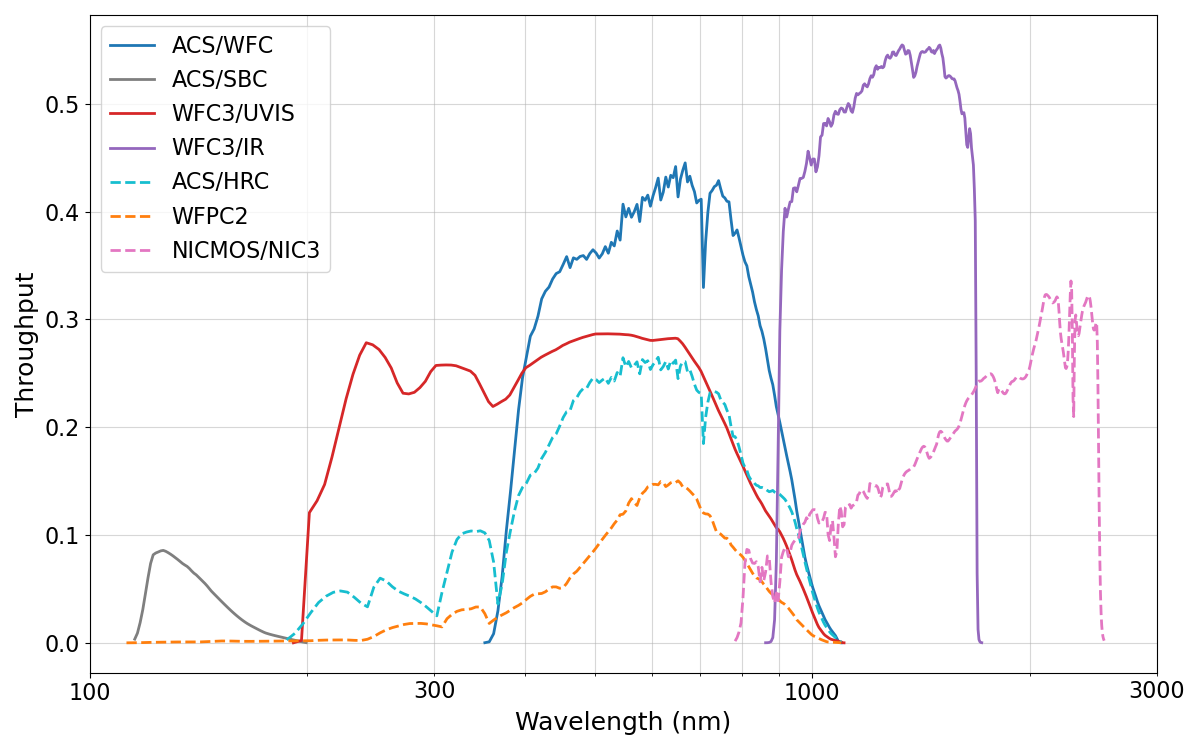
Figure 3.3: Discovery efficiencies of optical/infrared HST imaging instruments, including those verified on-orbit for WFC3. Discovery efficiency is defined as the system throughput (plotted in Figure 3.2) multiplied by the area of the field of view. Note that the y-axis is now logarithmic. Plot reproduced from Figure 2.2 of the Cycle 33 ACS Instrument Handbook (Stark, et al. 2024).
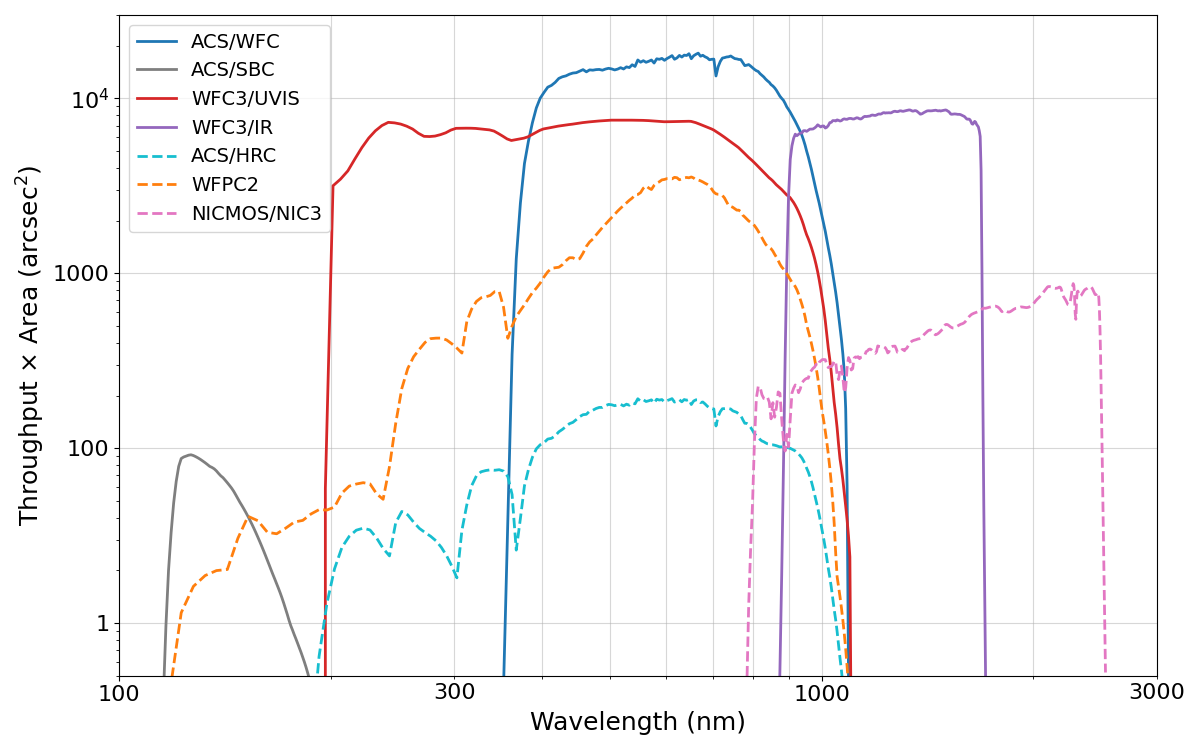
Figure 3.4: Limiting point-source magnitudes reached by optical/infrared HST imaging instruments in 10 hours. (Performance of WFC3/UVIS, as well as ACS/WFC, has declined from the early on-orbit level shown here due to increasing CTE losses.)
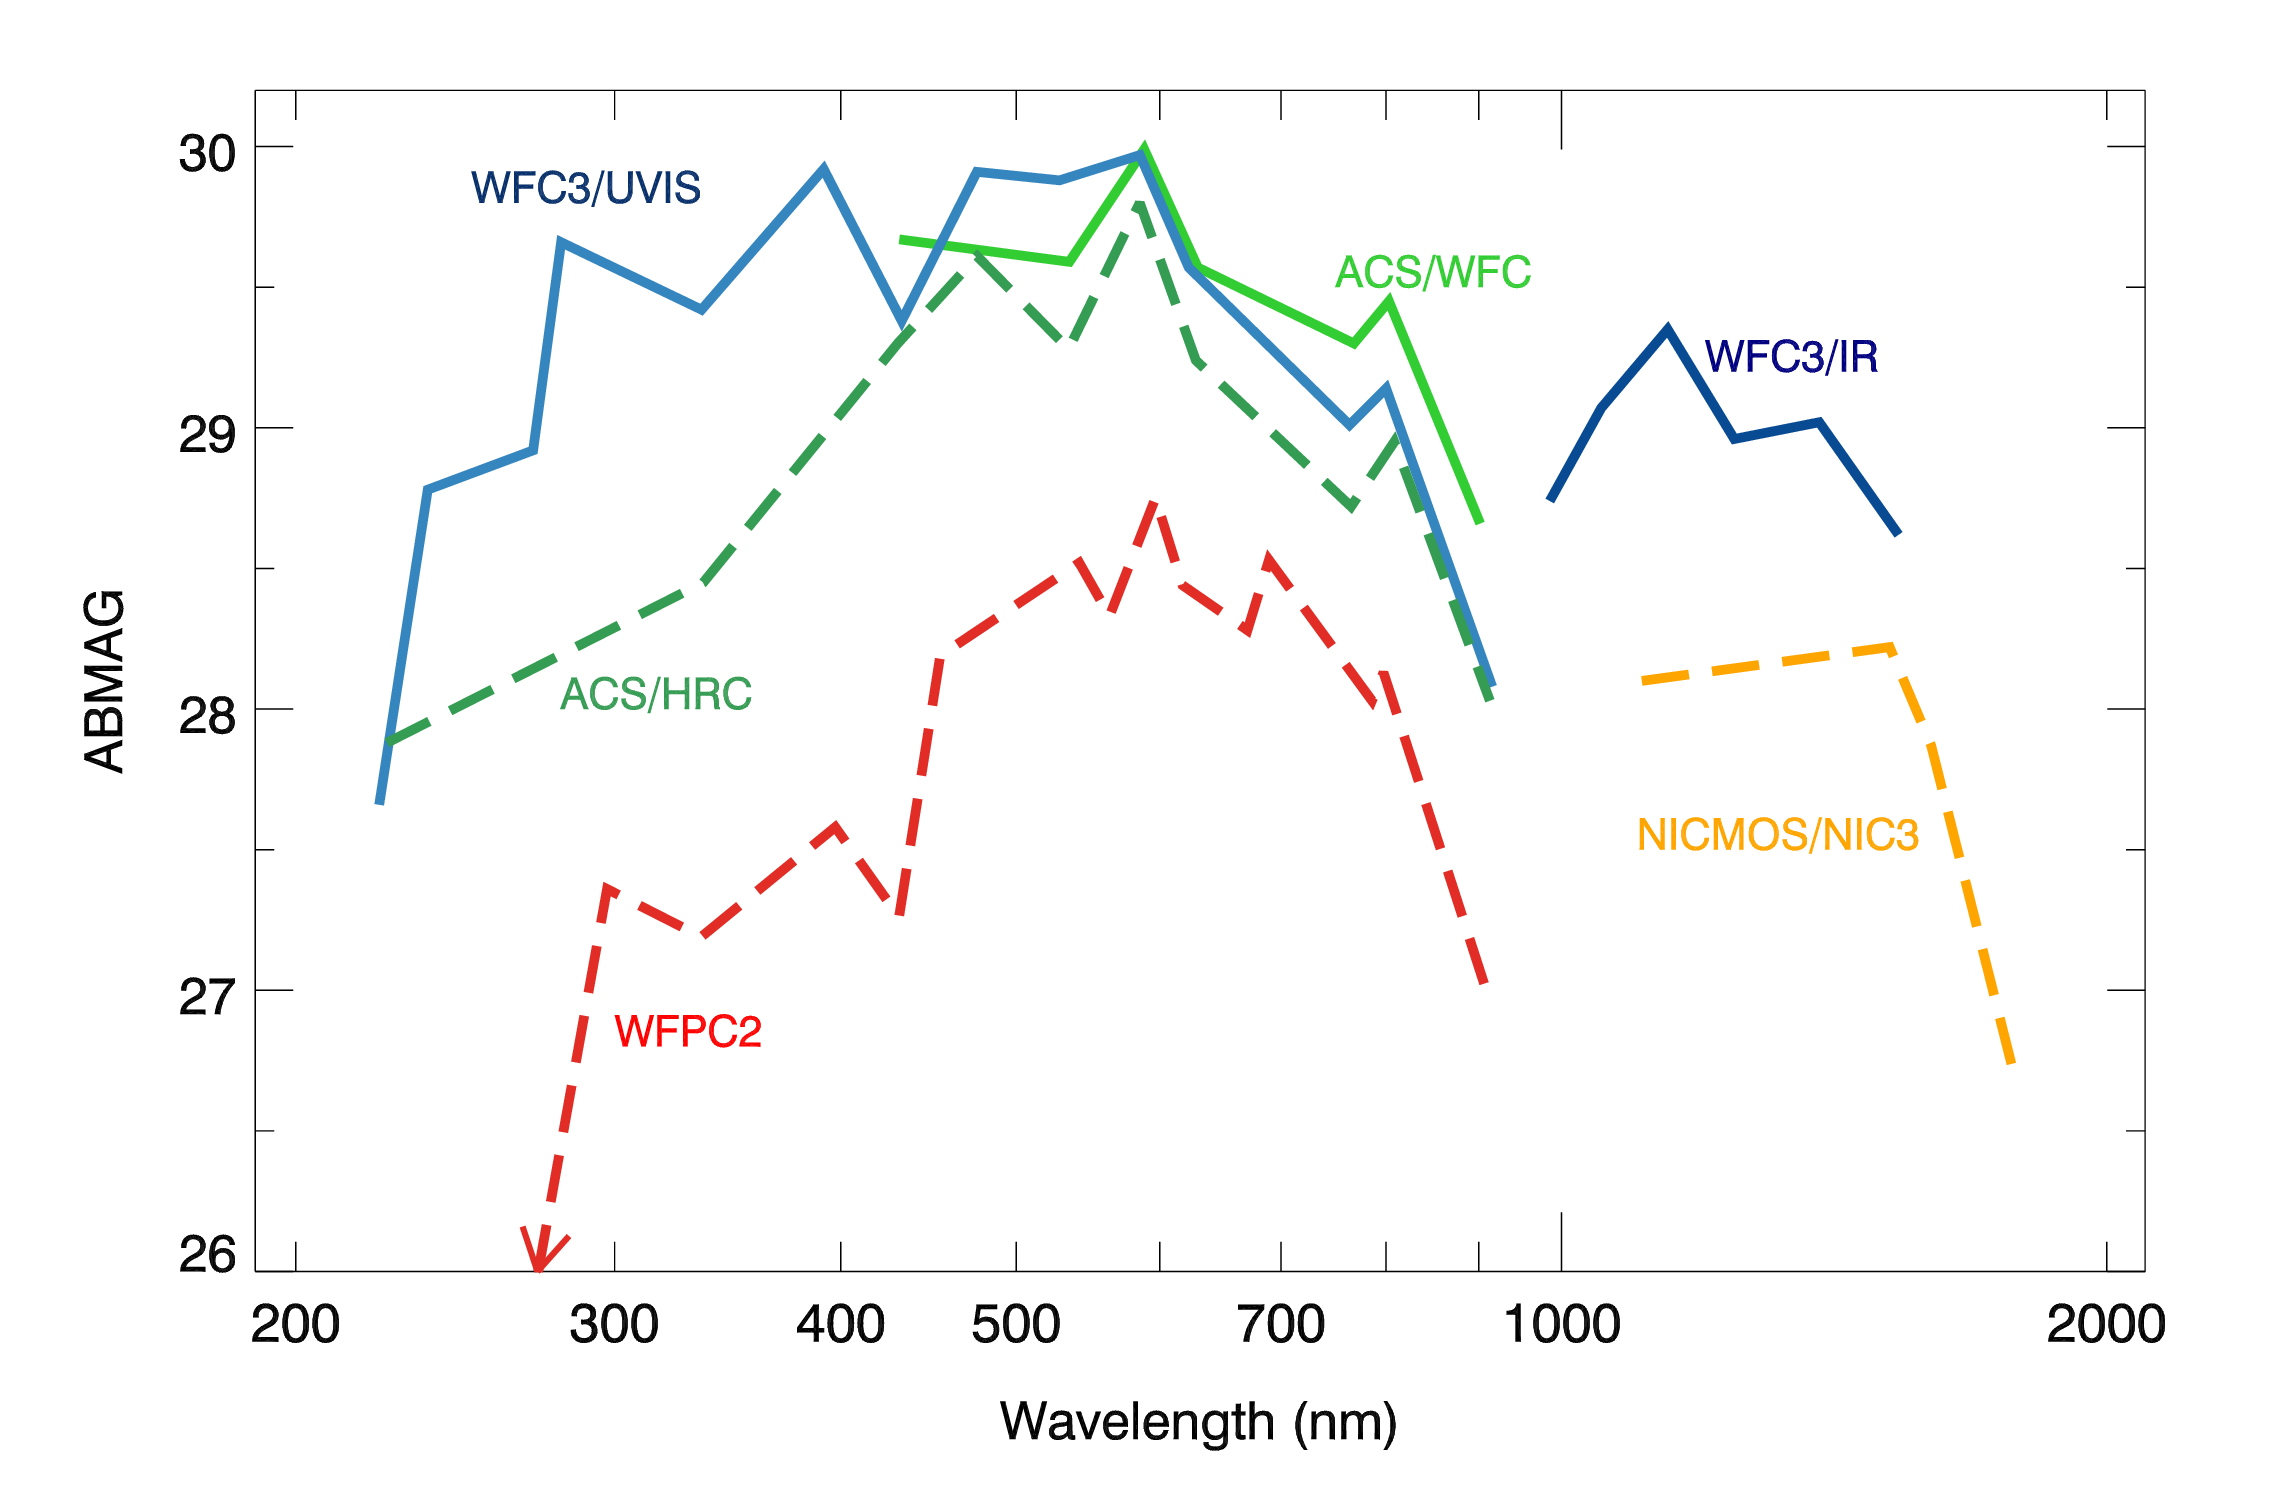
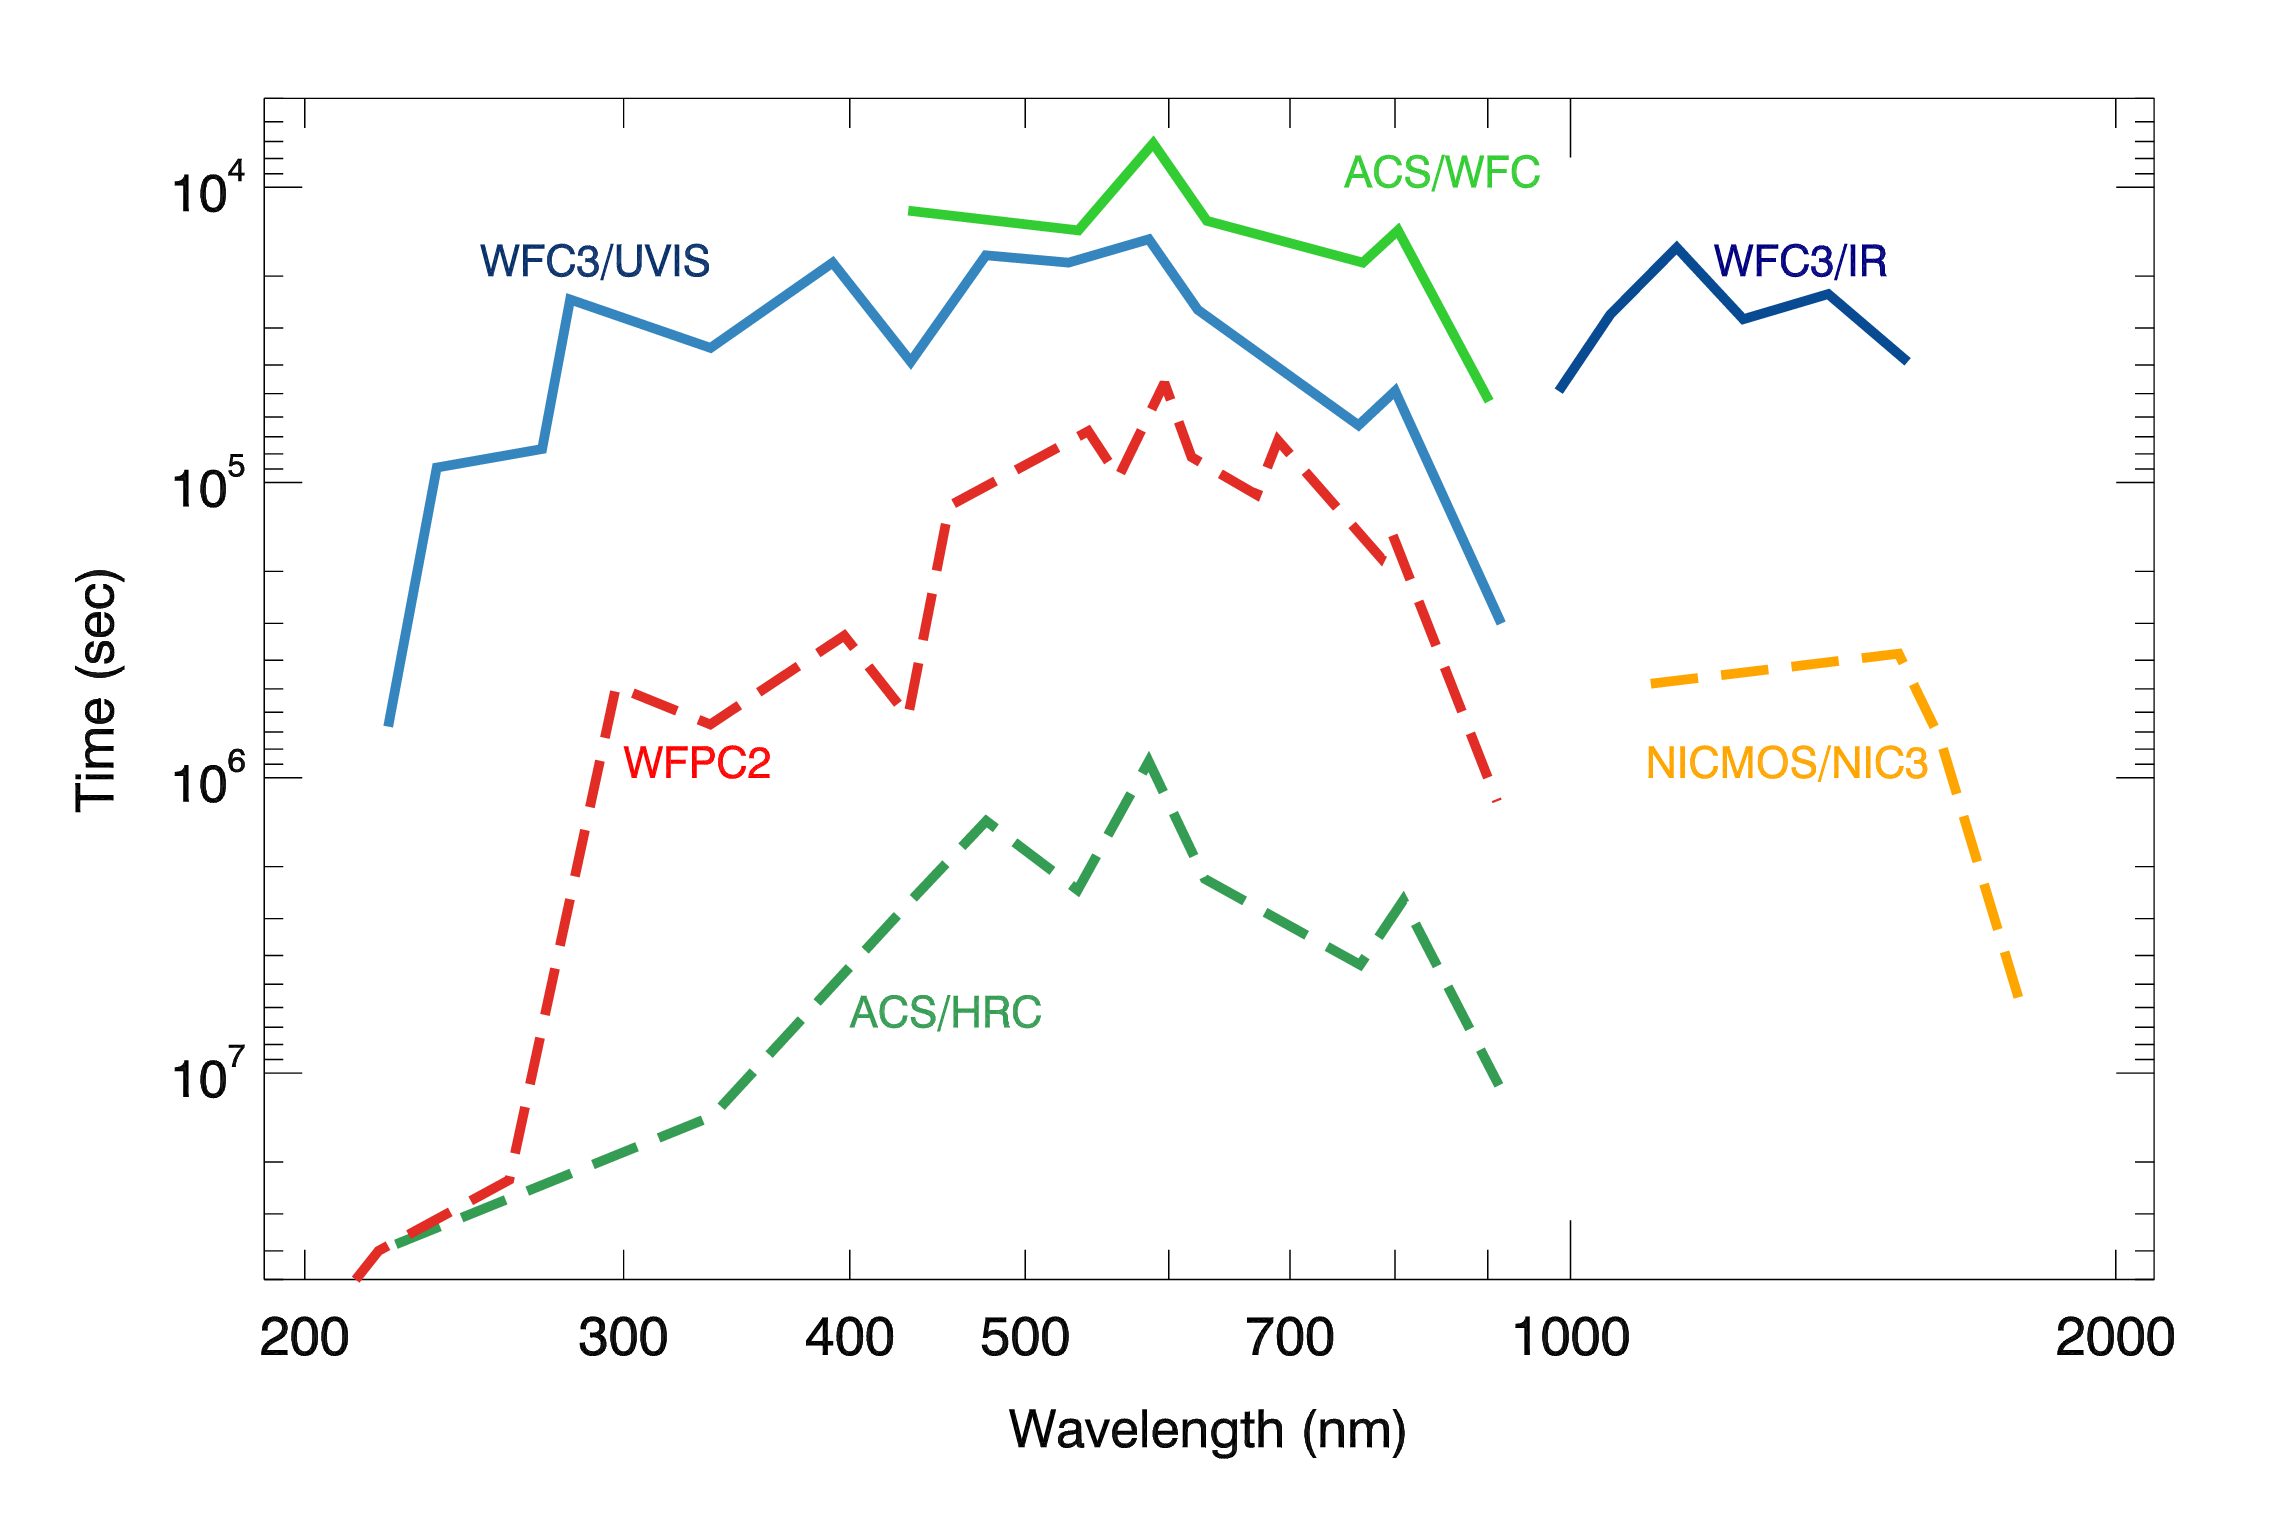
Figure 3.5: Time needed for optical/infrared HST imaging instruments to survey a wide sky area to a limiting extended (1 arcsec2) ABMAG of 26. (WFC3/UVIS performance has declined from the early on-orbit level shown here due to increasing CTE losses.)
3.3.5 In Comparison with JWST/NIRCam
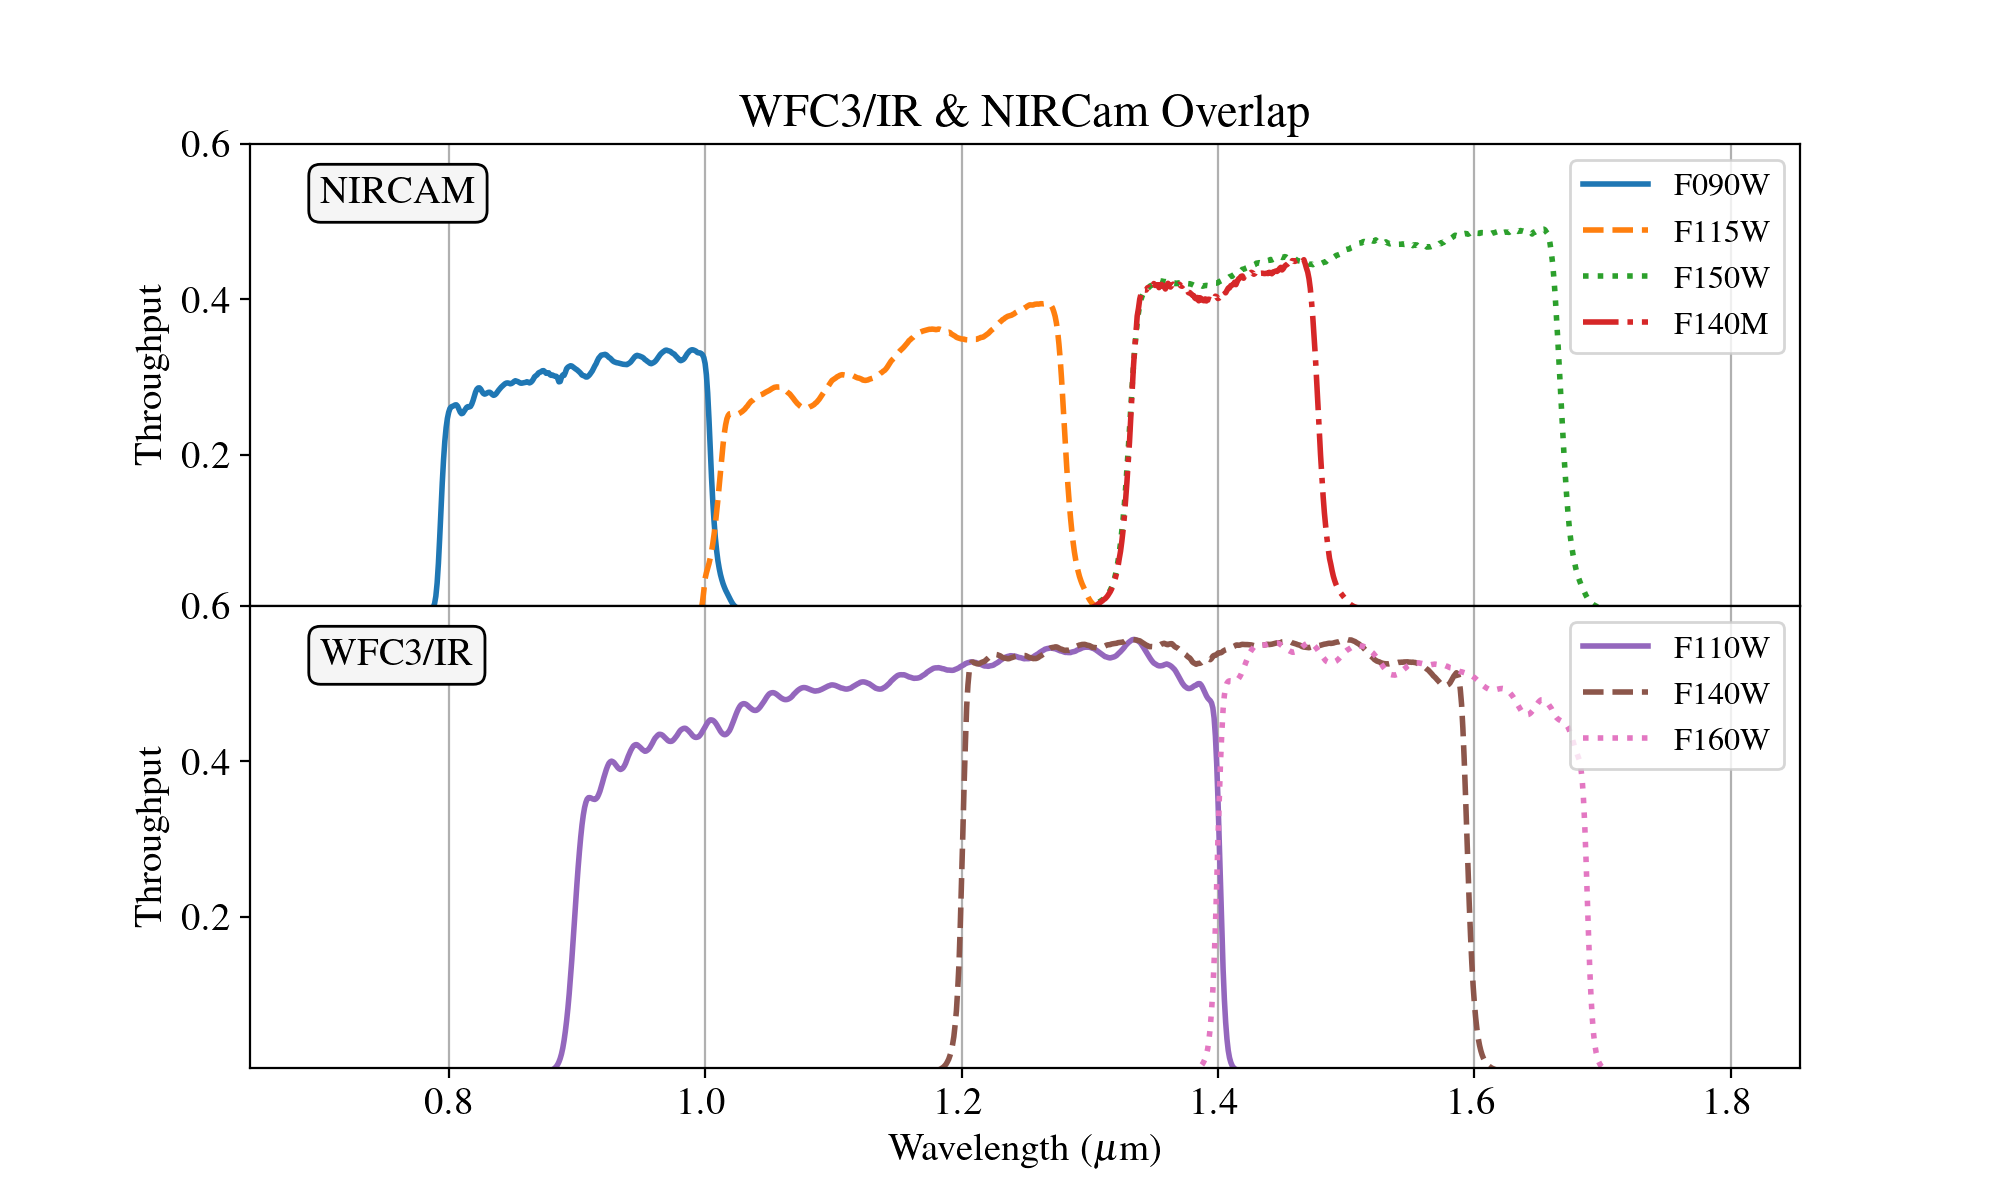
Although they have different capabilities, JWST/NIRCam has significant wavelength overlap with WFC3 in both UVIS and IR bandpasses. Here we compare the filter coverage of the two observatory instruments. Figure 3.6 plots the measured on-orbit system throughputs of the wide-band/long-pass filters for WFC3/UVIS channels as functions of wavelength, compared with two wide-band filters on NIRCam. UVIS works at shorter wavelengths than NIRCam but has less throughput at longer wavelengths. Their respective filter bandpasses are different in the central wavelength and span. Figure 3.7 plots the measured on-orbit system throughputs of the wide-band/long-pass filters for WFC3/IR channels as functions of wavelength, compared with four wide/medium-band filters on NIRCam. The WFC3/IR filters are generally broader and contain more overlap than the comparable NIRCam filters, except at the longest wavelengths.
Figure 3.6: System throughputs for two wide-band JWST/NIRCam filters (top panel) and five wide-band/long-pass WFC3/UVIS filters (bottom panel), as functions of wavelength.
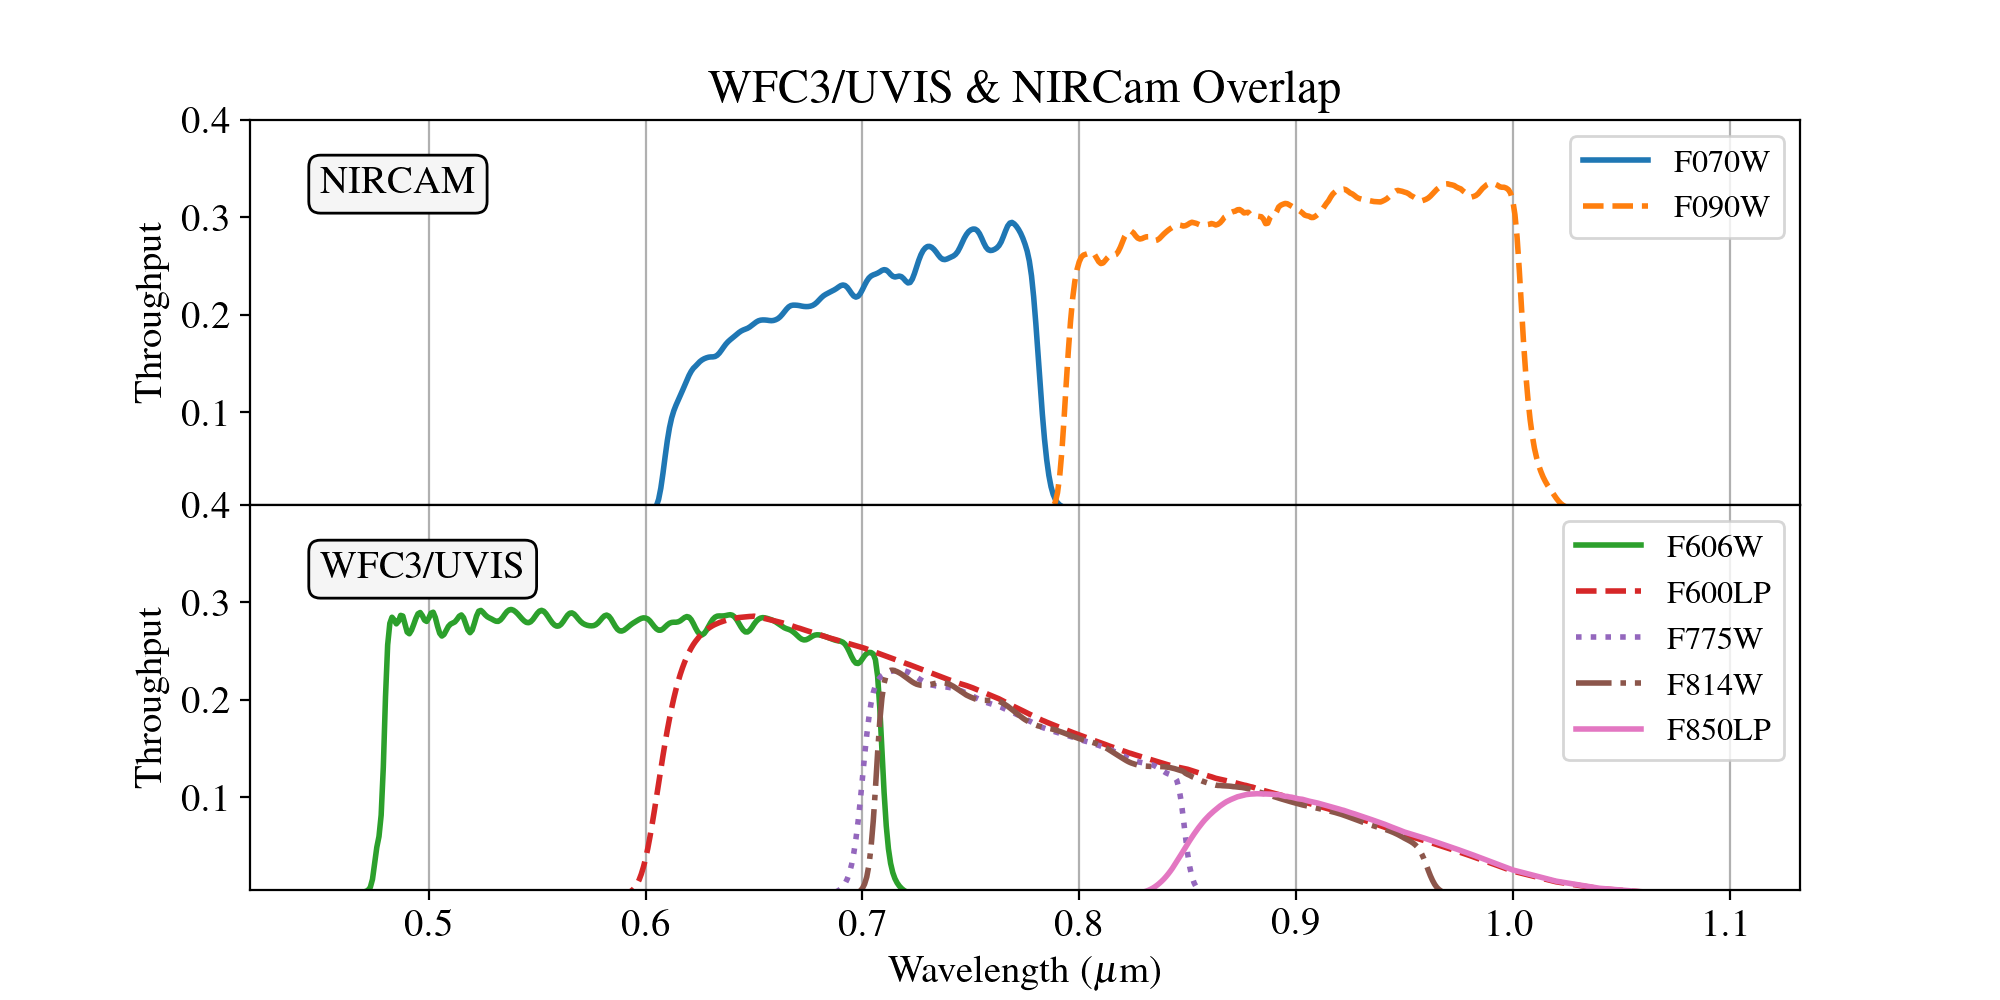
Figure 3.7: System throughputs for four wide/medium-band JWST/NIRCam filters (top panel) and three wide-band WFC3/IR filters (bottom panel), as functions of wavelength.
3.3.6 In Comparison with Roman/WFI
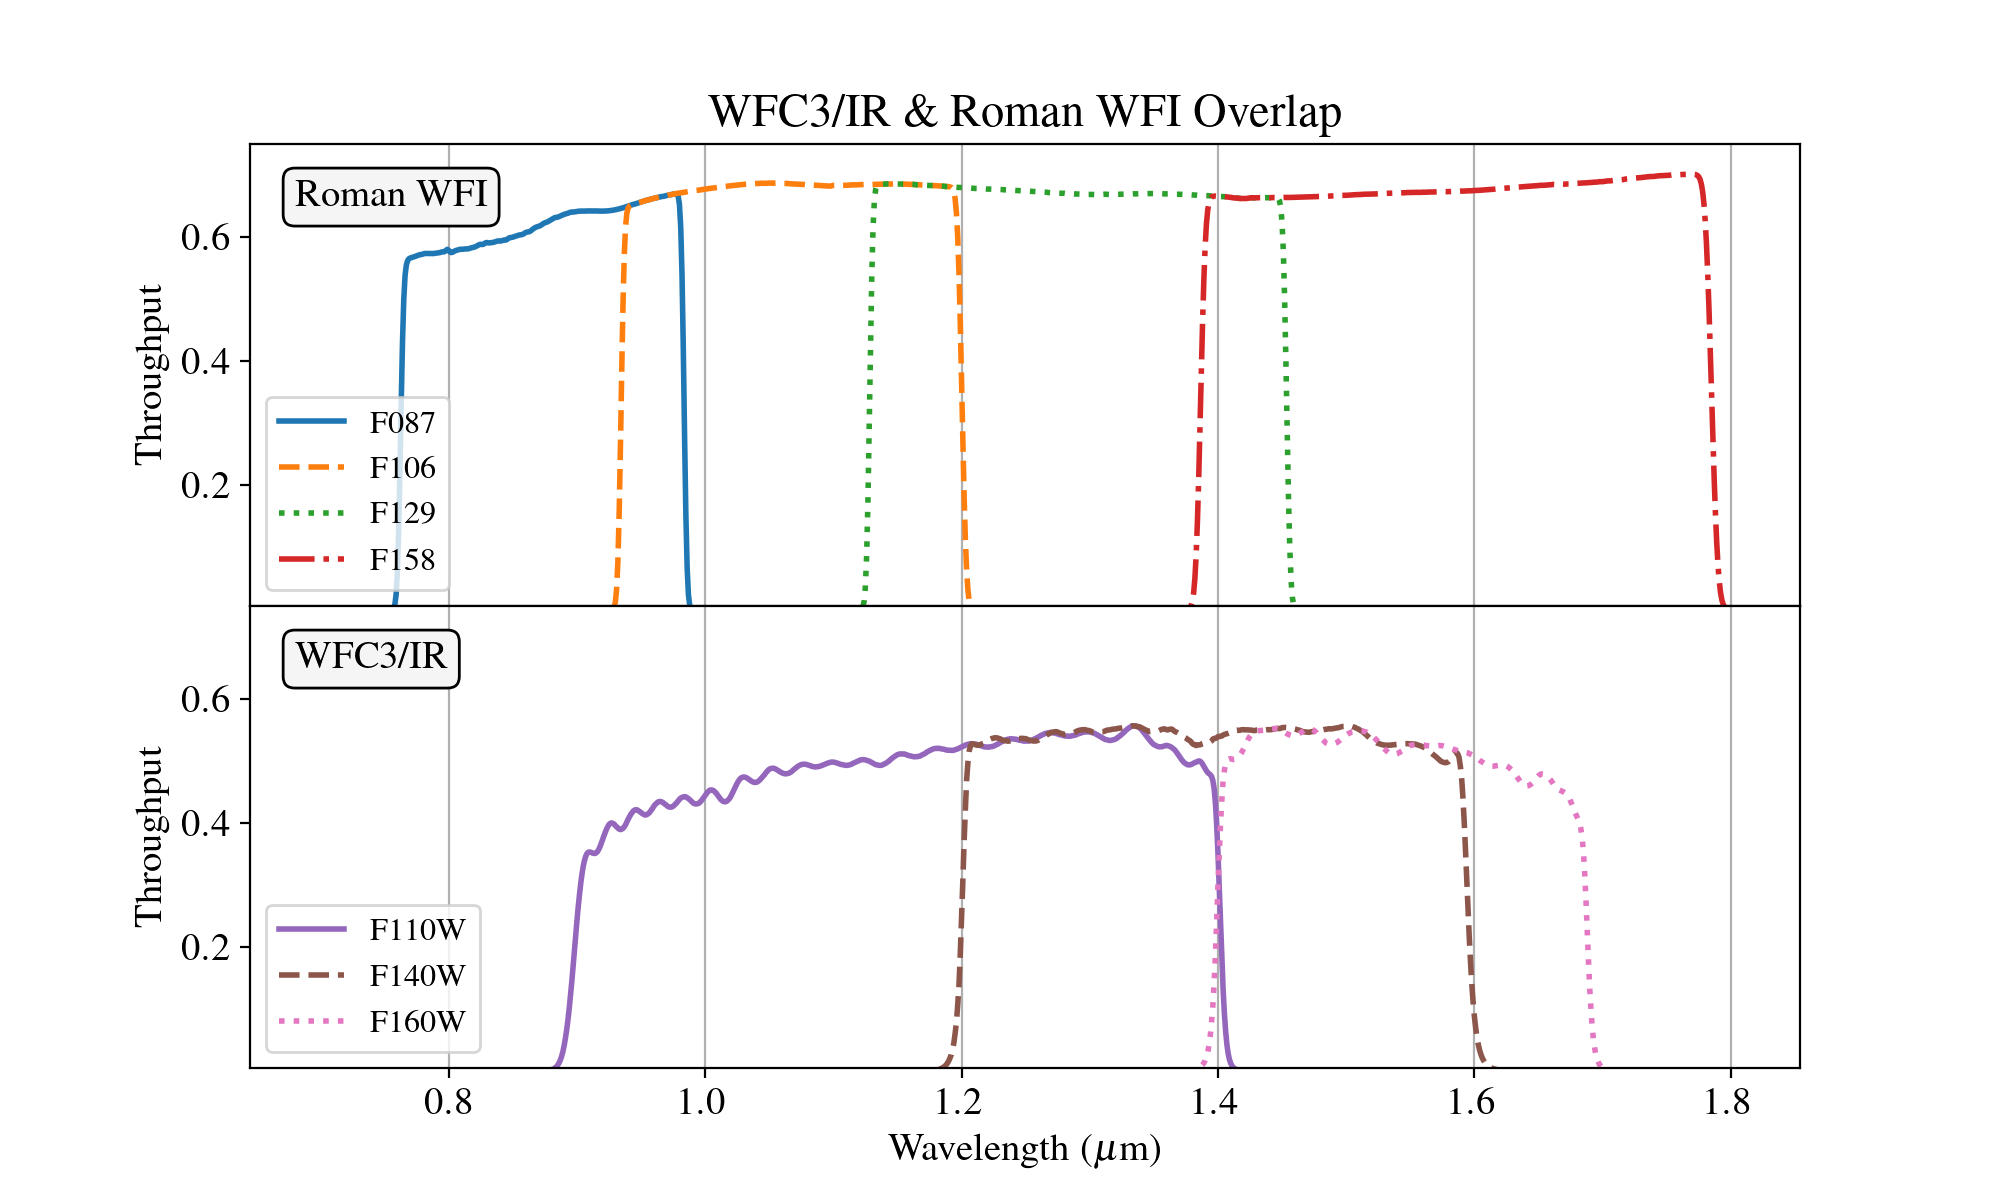
The Roman Space Telescope's Wide Field Instrument (WFI) is an imaging camera and slitless spectrometer with sensitivity from visible to near-infrared wavelengths. It has eight imaging filters with overlapping bandpasses spanning 0.48 to 2.3 µm. Figure 3.8 plots the measured on-orbit system throughputs of four wide-band/long-pass filters for WFC3/UVIS channels as functions of wavelength, compared with the F062 and F087 Roman/WFI filters. Meanwhile, Figure 3.9 plots the measured on-orbit system throughputs of three wide-band/long-pass filters for WFC3/IR channels as functions of wavelength, compared with four Roman/WFI filters: F087, F106, F129, and F158.
Figure 3.8: System throughputs for two Roman/WFI filters (top panel) and four wide-band/long-pass WFC3/UVIS filters (bottom panel), as functions of wavelength.
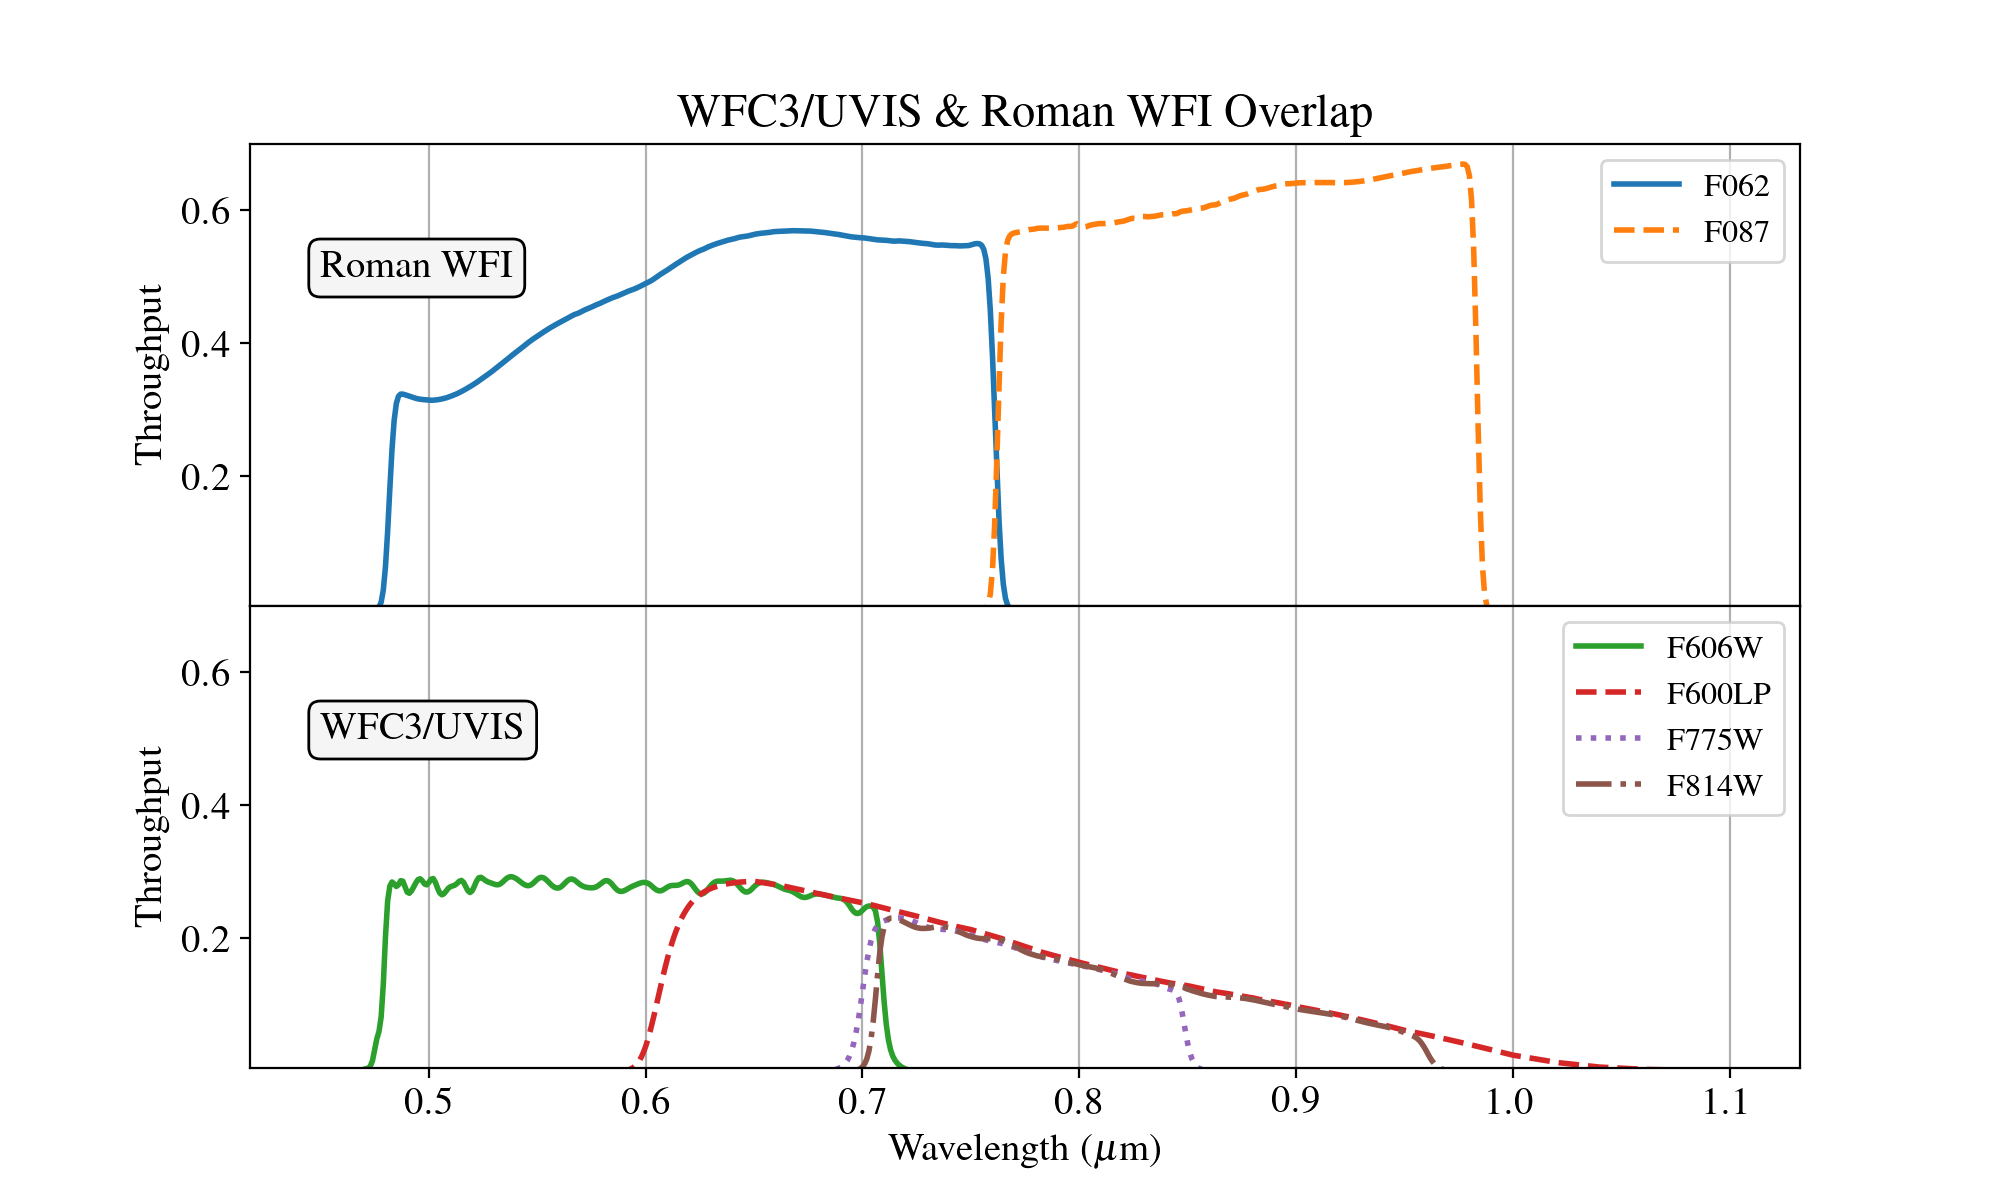
Figure 3.9: System throughputs for four Roman/WFI filters (top panel) and three wide-band WFC3/IR filters (bottom panel), as functions of wavelength.
-
WFC3 Instrument Handbook
- • Acknowledgments
- Chapter 1: Introduction to WFC3
- Chapter 2: WFC3 Instrument Description
- Chapter 3: Choosing the Optimum HST Instrument
- Chapter 4: Designing a Phase I WFC3 Proposal
- Chapter 5: WFC3 Detector Characteristics and Performance
-
Chapter 6: UVIS Imaging with WFC3
- • 6.1 WFC3 UVIS Imaging
- • 6.2 Specifying a UVIS Observation
- • 6.3 UVIS Channel Characteristics
- • 6.4 UVIS Field Geometry
- • 6.5 UVIS Spectral Elements
- • 6.6 UVIS Optical Performance
- • 6.7 UVIS Exposure and Readout
- • 6.8 UVIS Sensitivity
- • 6.9 Charge Transfer Efficiency
- • 6.10 Other Considerations for UVIS Imaging
- • 6.11 UVIS Observing Strategies
- Chapter 7: IR Imaging with WFC3
- Chapter 8: Slitless Spectroscopy with WFC3
-
Chapter 9: WFC3 Exposure-Time Calculation
- • 9.1 Overview
- • 9.2 The WFC3 Exposure Time Calculator - ETC
- • 9.3 Calculating Sensitivities from Tabulated Data
- • 9.4 Count Rates: Imaging
- • 9.5 Count Rates: Slitless Spectroscopy
- • 9.6 Estimating Exposure Times
- • 9.7 Sky Background
- • 9.8 Interstellar Extinction
- • 9.9 Exposure-Time Calculation Examples
- Chapter 10: Overheads and Orbit Time Determinations
-
Appendix A: WFC3 Filter Throughputs
- • A.1 Introduction
-
A.2 Throughputs and Signal-to-Noise Ratio Data
- • UVIS F200LP
- • UVIS F218W
- • UVIS F225W
- • UVIS F275W
- • UVIS F280N
- • UVIS F300X
- • UVIS F336W
- • UVIS F343N
- • UVIS F350LP
- • UVIS F373N
- • UVIS F390M
- • UVIS F390W
- • UVIS F395N
- • UVIS F410M
- • UVIS F438W
- • UVIS F467M
- • UVIS F469N
- • UVIS F475W
- • UVIS F475X
- • UVIS F487N
- • UVIS F502N
- • UVIS F547M
- • UVIS F555W
- • UVIS F600LP
- • UVIS F606W
- • UVIS F621M
- • UVIS F625W
- • UVIS F631N
- • UVIS F645N
- • UVIS F656N
- • UVIS F657N
- • UVIS F658N
- • UVIS F665N
- • UVIS F673N
- • UVIS F680N
- • UVIS F689M
- • UVIS F763M
- • UVIS F775W
- • UVIS F814W
- • UVIS F845M
- • UVIS F850LP
- • UVIS F953N
- • UVIS FQ232N
- • UVIS FQ243N
- • UVIS FQ378N
- • UVIS FQ387N
- • UVIS FQ422M
- • UVIS FQ436N
- • UVIS FQ437N
- • UVIS FQ492N
- • UVIS FQ508N
- • UVIS FQ575N
- • UVIS FQ619N
- • UVIS FQ634N
- • UVIS FQ672N
- • UVIS FQ674N
- • UVIS FQ727N
- • UVIS FQ750N
- • UVIS FQ889N
- • UVIS FQ906N
- • UVIS FQ924N
- • UVIS FQ937N
- • IR F098M
- • IR F105W
- • IR F110W
- • IR F125W
- • IR F126N
- • IR F127M
- • IR F128N
- • IR F130N
- • IR F132N
- • IR F139M
- • IR F140W
- • IR F153M
- • IR F160W
- • IR F164N
- • IR F167N
- Appendix B: Geometric Distortion
- Appendix C: Dithering and Mosaicking
- Appendix D: Bright-Object Constraints and Image Persistence
-
Appendix E: Reduction and Calibration of WFC3 Data
- • E.1 Overview
- • E.2 The STScI Reduction and Calibration Pipeline
- • E.3 The SMOV Calibration Plan
- • E.4 The Cycle 17 Calibration Plan
- • E.5 The Cycle 18 Calibration Plan
- • E.6 The Cycle 19 Calibration Plan
- • E.7 The Cycle 20 Calibration Plan
- • E.8 The Cycle 21 Calibration Plan
- • E.9 The Cycle 22 Calibration Plan
- • E.10 The Cycle 23 Calibration Plan
- • E.11 The Cycle 24 Calibration Plan
- • E.12 The Cycle 25 Calibration Plan
- • E.13 The Cycle 26 Calibration Plan
- • E.14 The Cycle 27 Calibration Plan
- • E.15 The Cycle 28 Calibration Plan
- • E.16 The Cycle 29 Calibration Plan
- • E.17 The Cycle 30 Calibration Plan
- • E.18 The Cycle 31 Calibration Plan
- • E.19 The Cycle 32 Calibration Plan
- • E.20 The Cycle 33 Calibration Plan
- • Glossary