8.3 Slitless Spectroscopy with the IR G102 and G141 Grisms
IR grism observations can be obtained using either full-frame or subarray apertures. Subarrays are useful for reducing exposure times for bright objects and for reducing data volume to avoid time lost to serial buffer dumps. First-order spectra for both the G102 and G141 grisms comfortably fit within 512 × 512 and 256 × 256 pixel subarrays.
Grism observations of a given target field should always be accompanied by a direct image, which is used to locate sources and determine source sizes. The locations of sources in the direct image are then used to guide the placement of extraction apertures in dispersed images, and to tune the size of the extraction apertures to the source size. The location of sources in direct images is also used to establish the wavelength zero-point for extracted spectra by using offsets from the direct image. Appropriate filters to use for direct images are discussed in the following sections for each IR grism. As with normal imaging observations, grism observations should be dithered to aid in the removal of bad pixels. Accompanying direct images can be obtained at each of the same grism dither positions, but this is not strictly necessary. It is usually sufficient to obtain a direct image at just 1 or 2 of the dither positions. Direct imaging is best taken at the beginning and/or end of a visit so that the grism observations are less likely to be impacted by temporal variations in the background from the bright Earth limb and scattered light. The user must specify the filter to be used for the accompanying direct image in the Phase 1.
While a direct image is required for identifying the full complex of overlapping orders in spectral images, wavelength assignments for sources with known coordinates can be derived using the offsets from the zero order grism images (see WFC3 ISR 2015-10). The inaccuracy caused by any non-linearity in the dispersion is estimated at ~0.1 pixel or ~2.5 Å for G102 and ~5 Å for G141. The rms precision of the assigned wavelengths for individual spectra is better than 0.2 pixel. For the same or very similar POSTARGs, the separation from direct image to zero order varies by up to 0.5 pixels in both x and y directions, corresponding to an uncertainty of about ~12Å (G102) and ~23Å (G141).
The GRISM apertures (given at the bottom of Table 7.1) are designed to be used for both the grism exposure and the associated direct image. At a given telescope pointing, the first order spectrum and the location of the target in the direct image are roughly aligned in the x direction. The G102 spectrum starts at about 55 pixels to the right of the target image location and extends about 155 pixels; the G141 spectrum starts at about 35 pixels to the right of the target image location and extends about 135 pixels. For either grism, the same pointing can thus be used to place the target image and the first order spectrum on an array with dimensions greater than about 210 pixels. The apertures GRISM1024, GRISM512, and GRISM256 have been designed to take advantage of this, with the placement of the target optimized for the dimensions of the array, which is indicated by the number in the aperture name. For the smaller apertures, GRISM128 and GRISM64, different pointings are automatically used for the direct image and the grism exposure so that the target is within the aperture in the direct image and the target’s spectrum is also inside the aperture in the grism image. See WFC3 Grism Resources webpage for details on selecting GRISM apertures and using combinations of these apertures.
Objects that are off the edges of the detector will still produce dispersed spectra since the detector field of view is smaller than the rest of the WFC3 optics. Any object that is within -183 pixels (-22 arcsec) of the left edge, or +85 pixels (+10 arcsec) of the right edge of the detector will result in positive or negative orders spectra, respectively. This is described in WFC3 ISR 2016-15.
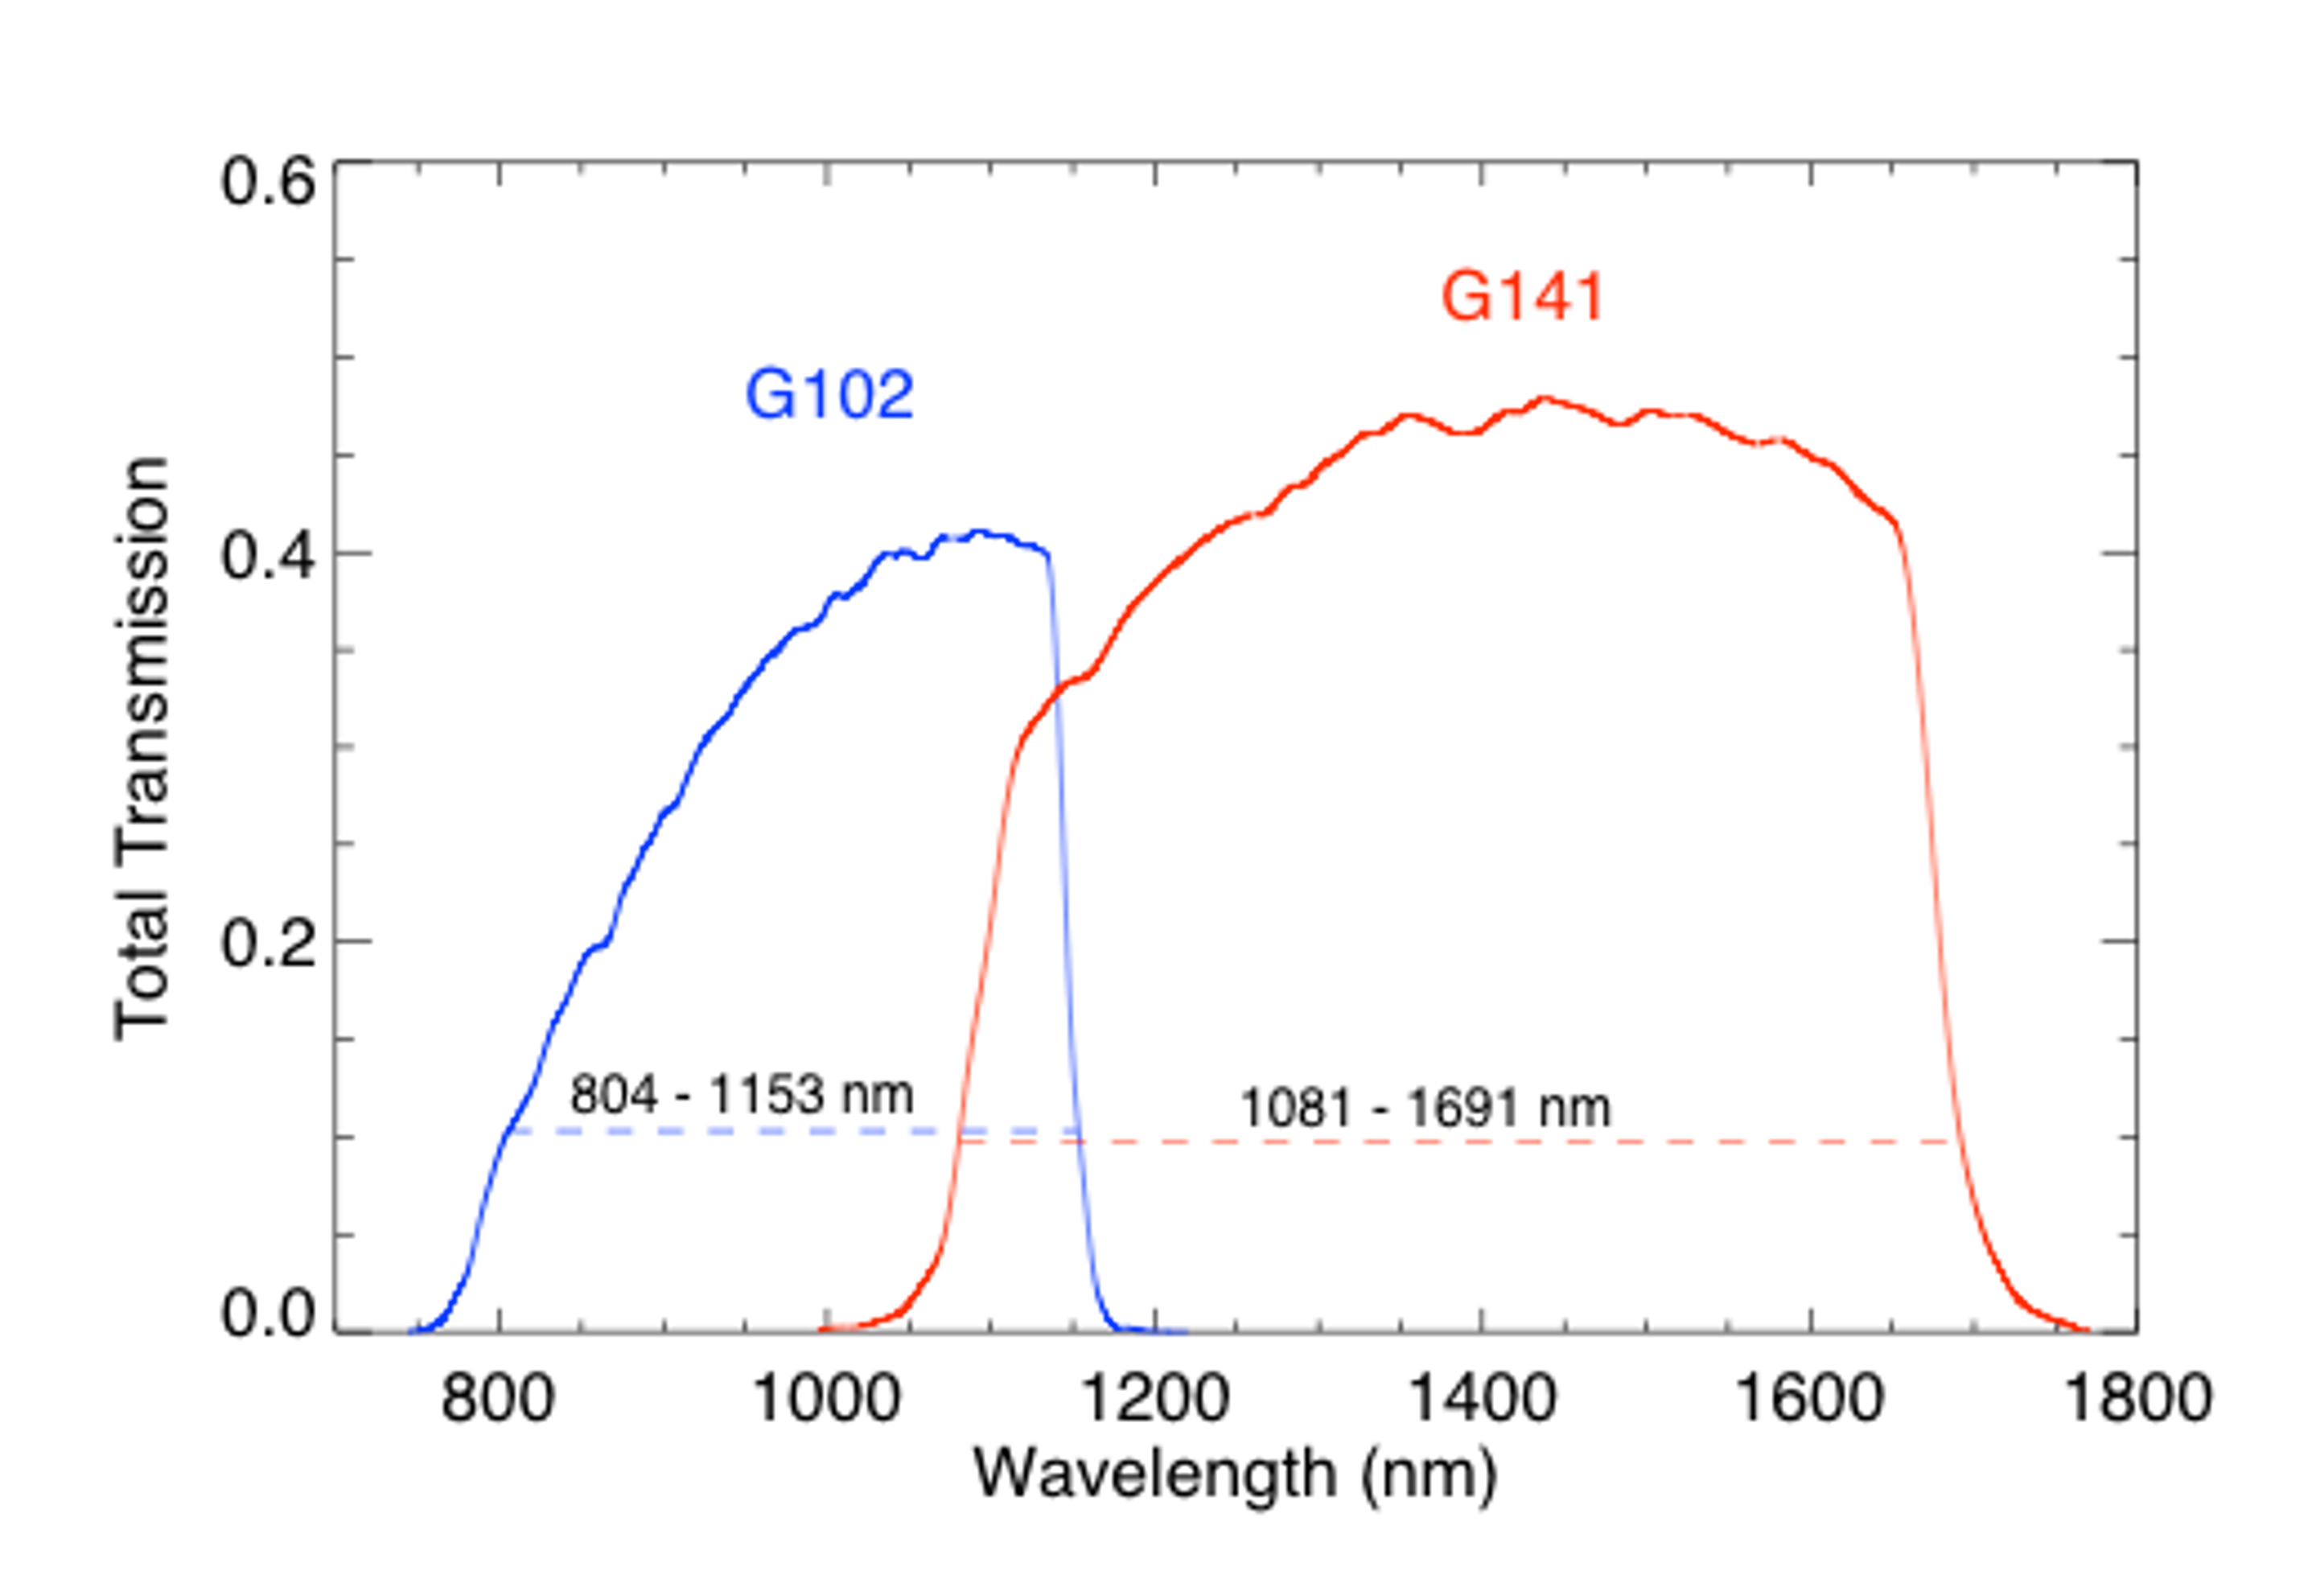
Figure 8.4: Overview of total transmission for the G102 and G141 grisms (from WFC3 ISR 2011-05). The spectral ranges with more than 10% throughput are indicated.
The wavelength calibration of the +1, -1, and +2 G102 and G141 orders were re-derived using all of the available multi-cycle calibration data (WFC3 ISR 2016-15). The accuracy of this new calibration is estimated to be better than 0.1 pixel for the trace description and better than 0.5 pixel (~10A and 20A for the G102 and G141 grisms, respectively) for the wavelength calibration. Previous calibration assumed that grism observations would be paired with F098M and F140W direct images for the G102 and G141 grisms, respectively. Calibration solutions that include the effect of the filter wedge offset (WFC3 ISR 2010-12) are now also available.
Please see the G102 Calibrations and G141 Calibrations webpages for the most up to date software and calibration reference files, as well as a full calibration history. |
8.3.1 IR G102
The G102 grism provides first-order spectra over the wavelength range from the grism short-wavelength cutoff at about 800 nm up to 1150 nm. The dispersion is high enough that only the positive first and second-order spectra, as well as the zeroth-order image, are visible on the detector when the positive first-order spectrum is centered in the field of view.
Figure 8.5 shows the position of the zeroth-order image and +1st-order spectrum (which has much higher sensitivity than the –1st order due to the grating blaze) for the G102 grism. The location of the direct image (superposed from an F098M undispersed exposure) is indicated in the figure.
Figure 8.5: G102 grism observation of the flux standard star GD153 (program 11552) with a F098M direct image (circled) superimposed to illustrate the relative positions. Spectral orders 0, +1, and +2 can be seen on the image. The image shows the full extent of the detector in the x-axis (1024 pixels) and about 200 pixels in the y-axis.
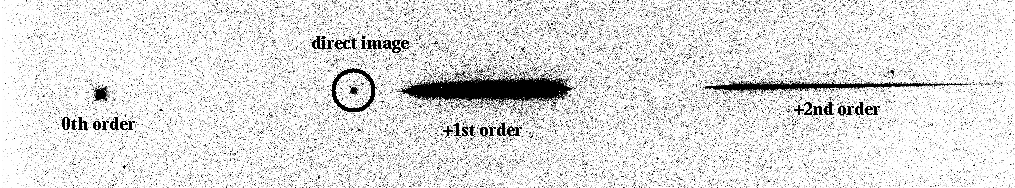
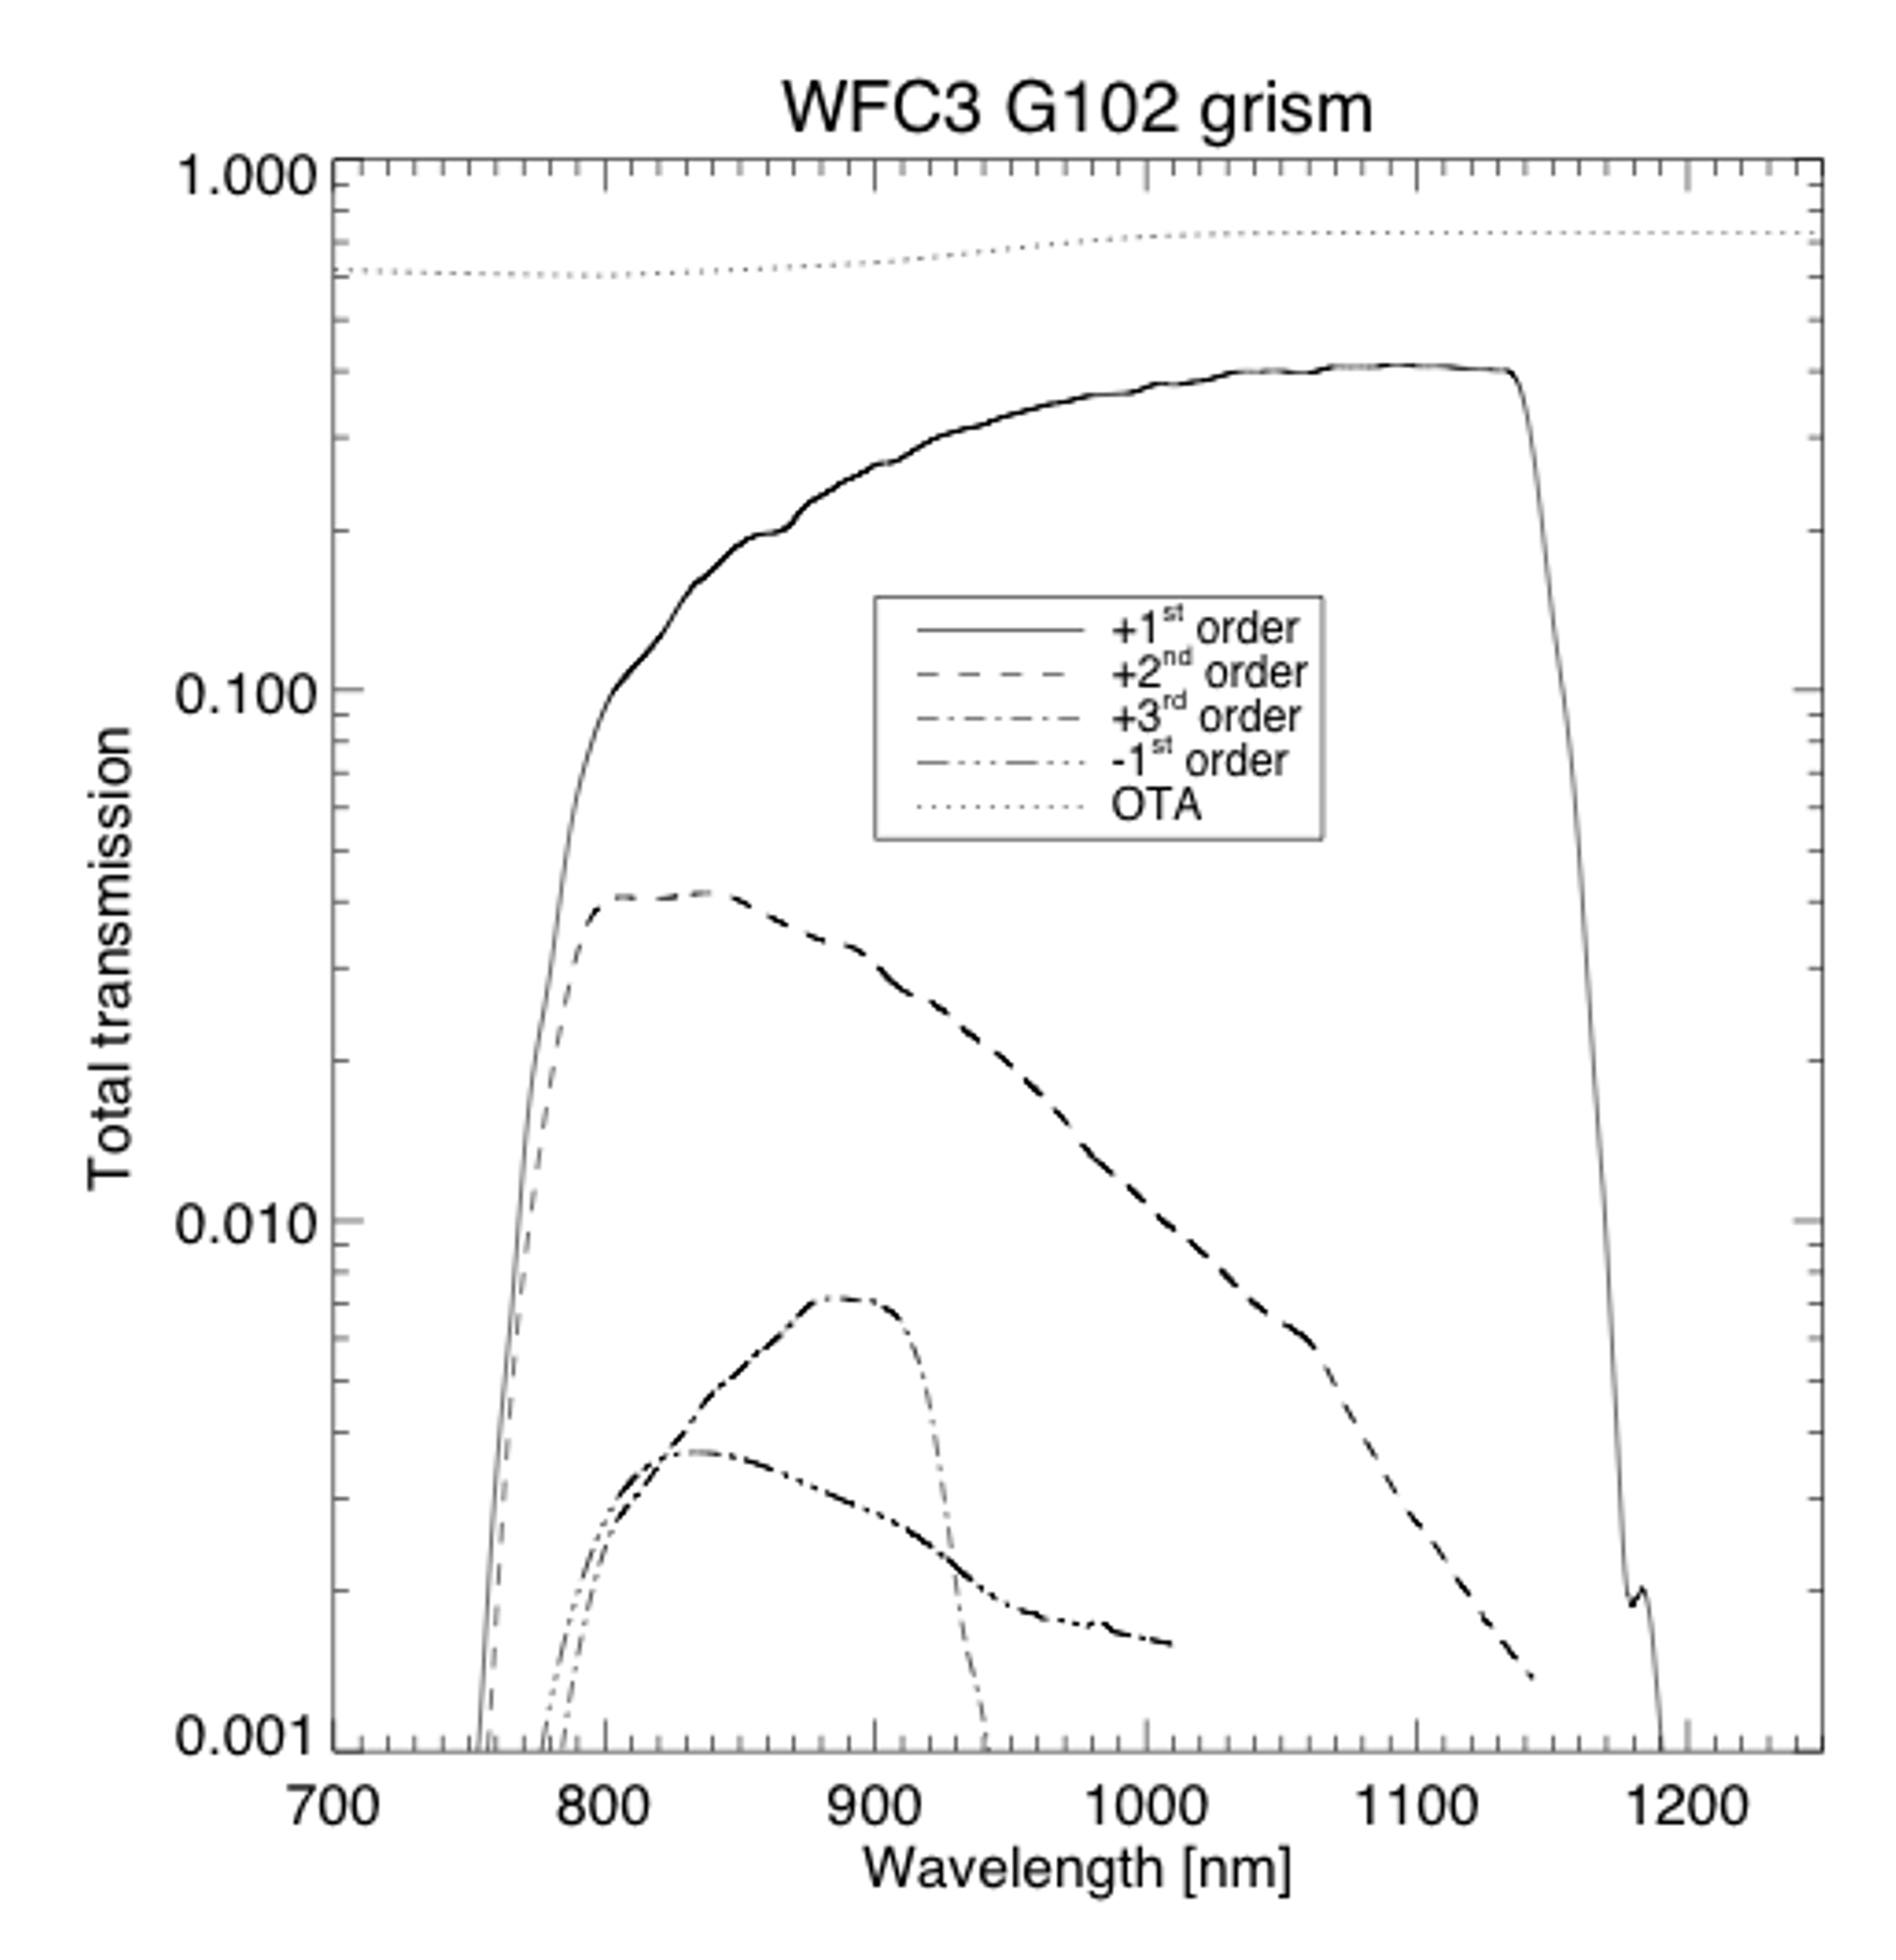
Figure 8.6: The absolute throughput (log-scaled) of the G102 grism as a function of wavelength for the +1st, +2nd, +3rd, and -1st orders (from WFC3 ISR 2011-15).
8.3.2 IR G141
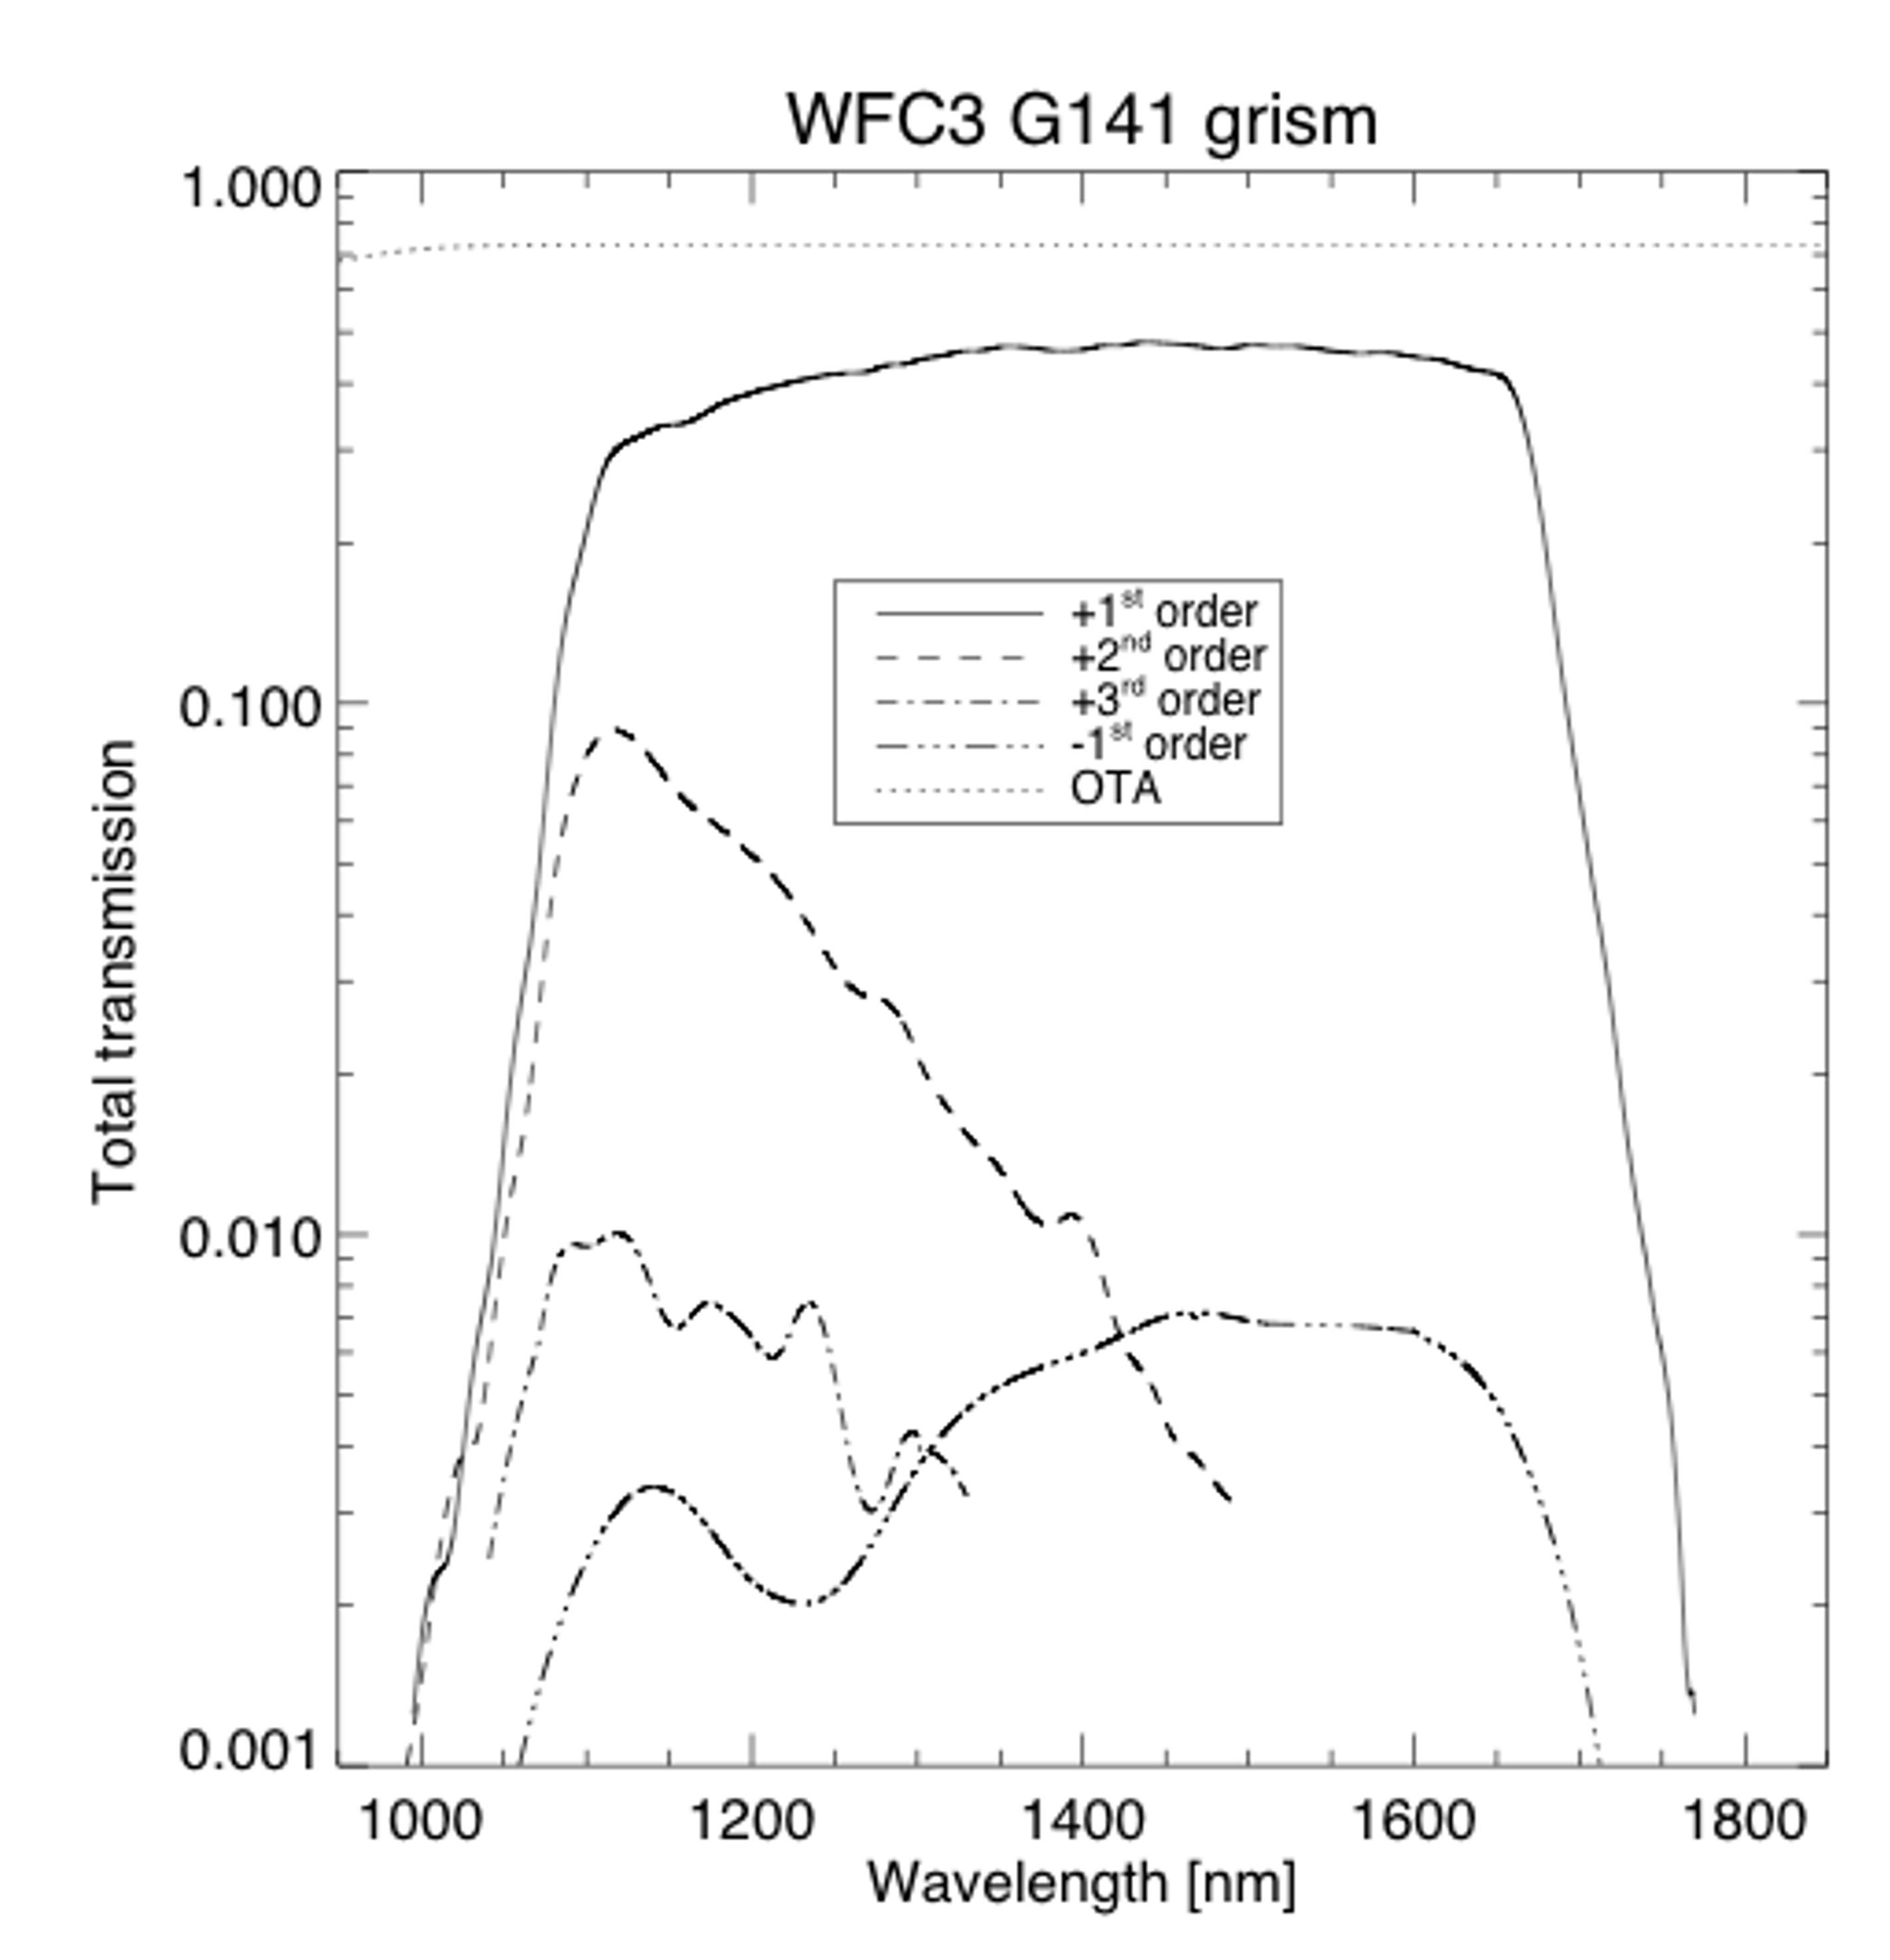
For the lower-dispersion G141 grism, the 0th-, 1st-, 2nd-, and 3rd-order spectra all lie within the field of view when the positive first-order is roughly centered. Figure 8.7 shows the appearance of the spectra on the detector, with the superposed direct image, for the G141 grism. The useful spectral range is from 1075 nm to about 1700 nm, limited in the red by the grism bandpass. Over most of the spectral range, more than 80% of the throughput is in the +1st-order spectrum. The trace of the first-order spectrum is well described by a first-order polynomial. The average tilt of the spectrum is 0.5 degrees with respect to the detector x-axis. The dispersion in the +1st-order varies over the field from 4.47 to 4.78 nm/pixel; this variation has been measured from both ground and on-orbit data to allow absolute wavelength calibration to better than one pixel. The total throughput (including HST optics) of the G141 grism reaches a maximum of 48% at ~1450 nm in the positive first order and is above 10% between 1080 and 1690 nm (see Figure 8.8).
Figure 8.7: G141 grism observation of the flux standard star GD153 (program 11552) with a F140W direct image (circled) superimposed to illustrate the relative positions. Spectral orders 0, +1, +2, and +3 can be seen in the image. The image shows the full extent of the detector in the x-axis (1024 pixels) and about 200 pixels in the y-axis.
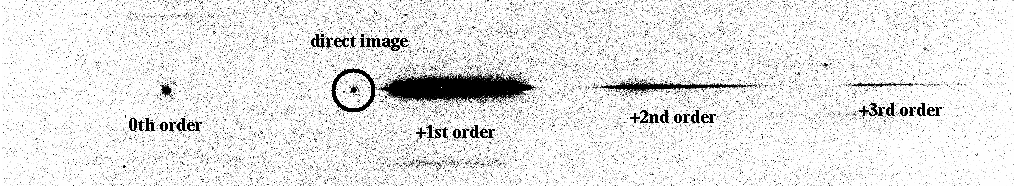
Figure 8.8: The absolute throughput (log-scaled) of the G141 grism as a function of wavelength for the +1st, +2nd, +3rd, and -1st orders (from WFC3 ISR 2011-15).
-
WFC3 Instrument Handbook
- • Acknowledgments
- Chapter 1: Introduction to WFC3
- Chapter 2: WFC3 Instrument Description
- Chapter 3: Choosing the Optimum HST Instrument
- Chapter 4: Designing a Phase I WFC3 Proposal
- Chapter 5: WFC3 Detector Characteristics and Performance
-
Chapter 6: UVIS Imaging with WFC3
- • 6.1 WFC3 UVIS Imaging
- • 6.2 Specifying a UVIS Observation
- • 6.3 UVIS Channel Characteristics
- • 6.4 UVIS Field Geometry
- • 6.5 UVIS Spectral Elements
- • 6.6 UVIS Optical Performance
- • 6.7 UVIS Exposure and Readout
- • 6.8 UVIS Sensitivity
- • 6.9 Charge Transfer Efficiency
- • 6.10 Other Considerations for UVIS Imaging
- • 6.11 UVIS Observing Strategies
- Chapter 7: IR Imaging with WFC3
- Chapter 8: Slitless Spectroscopy with WFC3
-
Chapter 9: WFC3 Exposure-Time Calculation
- • 9.1 Overview
- • 9.2 The WFC3 Exposure Time Calculator - ETC
- • 9.3 Calculating Sensitivities from Tabulated Data
- • 9.4 Count Rates: Imaging
- • 9.5 Count Rates: Slitless Spectroscopy
- • 9.6 Estimating Exposure Times
- • 9.7 Sky Background
- • 9.8 Interstellar Extinction
- • 9.9 Exposure-Time Calculation Examples
- Chapter 10: Overheads and Orbit Time Determinations
-
Appendix A: WFC3 Filter Throughputs
- • A.1 Introduction
-
A.2 Throughputs and Signal-to-Noise Ratio Data
- • UVIS F200LP
- • UVIS F218W
- • UVIS F225W
- • UVIS F275W
- • UVIS F280N
- • UVIS F300X
- • UVIS F336W
- • UVIS F343N
- • UVIS F350LP
- • UVIS F373N
- • UVIS F390M
- • UVIS F390W
- • UVIS F395N
- • UVIS F410M
- • UVIS F438W
- • UVIS F467M
- • UVIS F469N
- • UVIS F475W
- • UVIS F475X
- • UVIS F487N
- • UVIS F502N
- • UVIS F547M
- • UVIS F555W
- • UVIS F600LP
- • UVIS F606W
- • UVIS F621M
- • UVIS F625W
- • UVIS F631N
- • UVIS F645N
- • UVIS F656N
- • UVIS F657N
- • UVIS F658N
- • UVIS F665N
- • UVIS F673N
- • UVIS F680N
- • UVIS F689M
- • UVIS F763M
- • UVIS F775W
- • UVIS F814W
- • UVIS F845M
- • UVIS F850LP
- • UVIS F953N
- • UVIS FQ232N
- • UVIS FQ243N
- • UVIS FQ378N
- • UVIS FQ387N
- • UVIS FQ422M
- • UVIS FQ436N
- • UVIS FQ437N
- • UVIS FQ492N
- • UVIS FQ508N
- • UVIS FQ575N
- • UVIS FQ619N
- • UVIS FQ634N
- • UVIS FQ672N
- • UVIS FQ674N
- • UVIS FQ727N
- • UVIS FQ750N
- • UVIS FQ889N
- • UVIS FQ906N
- • UVIS FQ924N
- • UVIS FQ937N
- • IR F098M
- • IR F105W
- • IR F110W
- • IR F125W
- • IR F126N
- • IR F127M
- • IR F128N
- • IR F130N
- • IR F132N
- • IR F139M
- • IR F140W
- • IR F153M
- • IR F160W
- • IR F164N
- • IR F167N
- Appendix B: Geometric Distortion
- Appendix C: Dithering and Mosaicking
- Appendix D: Bright-Object Constraints and Image Persistence
-
Appendix E: Reduction and Calibration of WFC3 Data
- • E.1 Overview
- • E.2 The STScI Reduction and Calibration Pipeline
- • E.3 The SMOV Calibration Plan
- • E.4 The Cycle 17 Calibration Plan
- • E.5 The Cycle 18 Calibration Plan
- • E.6 The Cycle 19 Calibration Plan
- • E.7 The Cycle 20 Calibration Plan
- • E.8 The Cycle 21 Calibration Plan
- • E.9 The Cycle 22 Calibration Plan
- • E.10 The Cycle 23 Calibration Plan
- • E.11 The Cycle 24 Calibration Plan
- • E.12 The Cycle 25 Calibration Plan
- • E.13 The Cycle 26 Calibration Plan
- • E.14 The Cycle 27 Calibration Plan
- • E.15 The Cycle 28 Calibration Plan
- • E.16 The Cycle 29 Calibration Plan
- • E.17 The Cycle 30 Calibration Plan
- • E.18 The Cycle 31 Calibration Plan
- • E.19 The Cycle 32 Calibration Plan
- • E.20 The Cycle 33 Calibration Plan
- • Glossary