8.6 Slitless Spectroscopy with Spatial Scanning
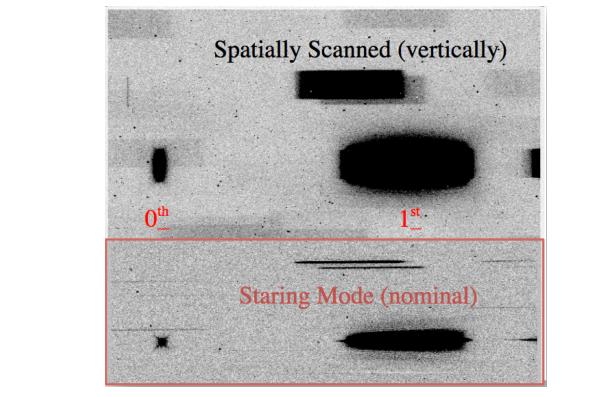
Spatial scanning of stellar spectra using the IR detector creates the potential for spectrophotometry of higher precision than possible via staring mode. By spreading a stellar spectrum perpendicular to its dispersion (Figure 8.11), more photons can be collected per exposure, and the exposure times can be longer without saturating the detector. This strategy results in higher signal-to-noise observations and an increased duty cycle. The most prevalent scientific application is transit spectroscopy, in which a time series of stellar spectra are obtained before, during, and after an exoplanet transit or eclipse; observations of this type with one-sigma precision of ~20 ppm in ~20 nm spectral bins from two transits have been reported (Knutson et al. 2014). Results for exoplanet transit spectroscopy have been published by numerous investigators; recent examples using WFC3 spatial scanning include Alam et al. 2022, Alderson et al. 2022, Barat et al. 2023, and Barclay et al. 2023.
The WFC3 team has introduced and will continue to update the Transiting Exoplanets List of Space Telescope Spectroscopy (TrExoLiSTS, formerly called ExoCat; see WFC3 ISR 2022-09) that summarizes the existing WFC3/IR spatial scanning observations of time series observations acquired during primary transits, secondary eclipses, and phase curves. Information presented includes the observational parameters along with the direct image, white light curve, and the measured drift of the spectrum in the field of view. The goal of presenting this catalog is to facilitate the preparation of WFC3 exoplanet programs by providing observers with information that they can use to optimize their target selection and to prevent target duplications.
In the time series, the integrated flux of a WFC3/IR spectrum exhibits a hook-shaped rise in each HST orbit due to charge trapping within the detector pixels. Mitigation of the “hook” has been attempted in observational techniques (WFC3 ISR 2014-14) and in post-observation modeling (e.g., Zhou et al. 2017).
Figure 8.11: A spatially-scanned IR spectrum, labeled with its 0th and +1st order light, compared to a nominal staring-mode slitless spectrum of the same field (red outlined inset, WFC3 ISR 2012-08). The images are 512 columns wide, centered in the detector’s 1024 columns. The scan was 40 pixels high (4.8 arcsec).
Spatial scanning is available with either WFC3 detector, UVIS or IR. However, overlap of spectral orders and curved spectral traces will compromise scanning’s utility for the UVIS grism. In this section, we assume that for IR spectroscopy, the observer desires the +1st order spectrum. Spatial scans are discussed elsewhere in this handbook (for UVIS imaging in Section 6.11.3, for IR imaging in Section 7.10.4) and in WFC3 ISR 2012-08. The latter is particularly relevant for anyone preparing a Phase II proposal.
Potential benefits of spatial scanning are 1) reducing overhead for time-series of short exposures due to detector operations required before and after each exposure, 2) avoiding saturation for very bright stars, 3) improved spectrophotometry, as collecting more photons per HST orbit improves the signal-to-noise ratio. We note that the main disadvantages are 1) STScI pipelines do not work on spatially-scanned IR data so the observer will need to reduce IR data themselves even to produce simple images, and 2) astronomical sources will overlap more often than with staring-mode observations, especially for spectra.
As of June 2024, allowable single-line scan rates under FGS control can be any value between 0.0 and 4.9 arcsec s-1; serpentine (boustrophedonic) scan rates can be 0.0 and 0.99 arcsec s-1. Scan rates higher than these (as well as gyro pointing control) are no longer possible as HST operation has transitioned to Reduced Gyro Mode. WFC3 ISR 2012-08 provides recommended scan rates for WFC3 IR spectroscopy of bright stars as well as formulae to predict appropriate scan rates.
Python code and web tools are available to assist observers in designing spatial scanning observations for exoplanet transits. The PandExo code (Batalha et al. 2017) was extensively tested using WFC3 observations, and provides realistic noise estimates for simulated time-series observations based on system parameters, an input planetary model, and various observation parameters (e.g., number of transits/eclipses, number of spectrophotometric channels, size of the observation start window) and various WFC3 parameters (e.g., disperser, subarray size, N_SAMP, SAMP_SEQ, scan direction). The simulations can also account for the WFC3 ramp effects described above. The GUI for PandExo is integrated into ExoCTK (Exoplanet Characterization Toolkit) and can be used to make one-off calculations in a web form. PandExo_HST can be locally installed to perform more detailed calculations on one's own computer.
The sample sequence SPARS5, introduced during Cycle 23, has time steps intermediate between those of RAPID and SPARS10. As for all WFC3/IR sample sequences, the time intervals depend on the size of the aperture (see Sections 7.7.3 and 7.7.4). SPARS5 was designed to allow the efficiency and uninterrupted time series of SPARS10 and yet be short enough in cadence to better isolate a target exoplanet-host star from a nearby stellar companion in spatially-scanned observations using an IR grism. Better isolation may enable the observer to specify wider orient ranges, which may increase scheduling opportunities, which are often rare for these time-constrained observations. We expect that SPARS5 will be advantageous especially for G141 or G102 grism observations of stars brighter than approximately 7th magnitude in H band, scanned at approximately 1 arcsec per second or faster. The subarray apertures are especially useful for IR grism observations of bright stars with the sample sequences RAPID, SPARS5, and SPARS10 because of their short time steps and efficient orbit packing. The combination of SPARS10 with a 512 × 512 aperture is not currently supported (and therefore has a lower quality dark reference file), but spectroscopic spatial scan observers who need it for improved observing efficiency and consequent increases in signal-to-noise may send a justification for available mode use to the Contact Scientist or the Program Coordinator.
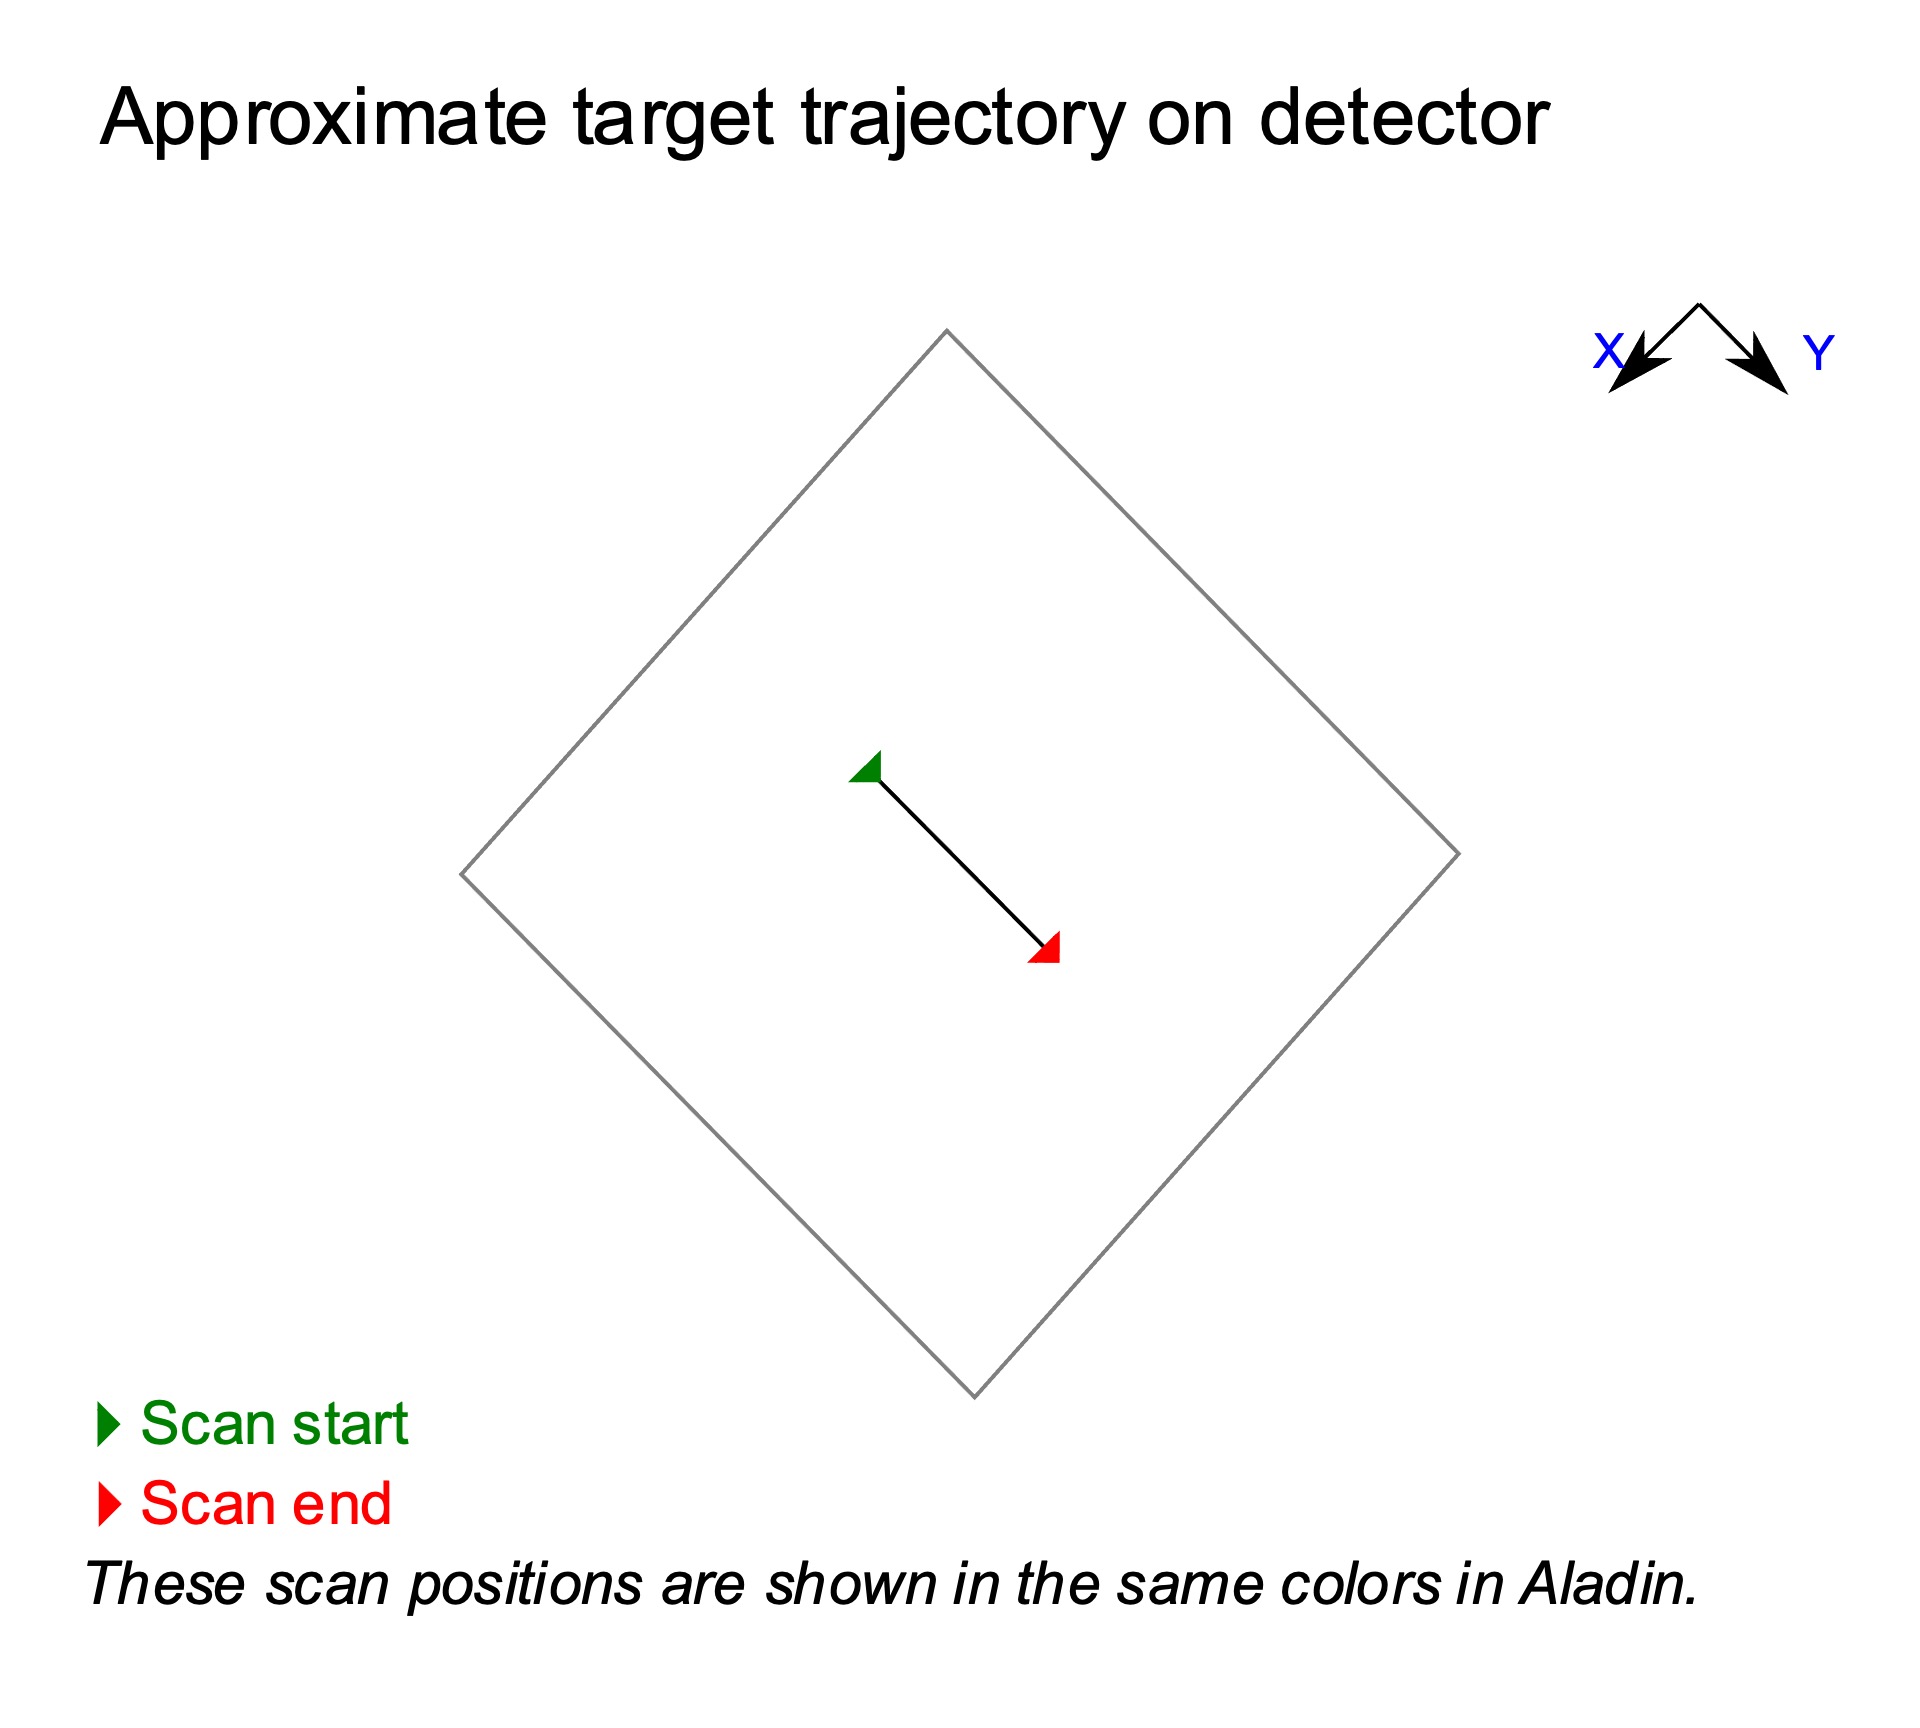
APT provides a diagram to assist observers planning spatial scan observations as shown in Figure 8.12. The line connecting the green and red arrows corresponds to where the target’s direct image would appear. In grism observations, the first order spectrum appears at larger X coordinate values than the direct image (see Figures 8.5 and 8.7). By design of the GRISM128, GRISM256 and GRISM512 subarrays, a POSTARGX = 0 centers the first order spectrum in each subarray in the X coordinate. Because the diagram is only approximate and because of on-going developments in APT and spacecraft operations, users of fast spatial scans (~1 arcsec/sec or faster) should consult with their contact scientist to optimize the POSTARGY value.
Figure 8.12: Diagram provided in APT to assist planning of spatial scan observations.
-
WFC3 Instrument Handbook
- • Acknowledgments
- Chapter 1: Introduction to WFC3
- Chapter 2: WFC3 Instrument Description
- Chapter 3: Choosing the Optimum HST Instrument
- Chapter 4: Designing a Phase I WFC3 Proposal
- Chapter 5: WFC3 Detector Characteristics and Performance
-
Chapter 6: UVIS Imaging with WFC3
- • 6.1 WFC3 UVIS Imaging
- • 6.2 Specifying a UVIS Observation
- • 6.3 UVIS Channel Characteristics
- • 6.4 UVIS Field Geometry
- • 6.5 UVIS Spectral Elements
- • 6.6 UVIS Optical Performance
- • 6.7 UVIS Exposure and Readout
- • 6.8 UVIS Sensitivity
- • 6.9 Charge Transfer Efficiency
- • 6.10 Other Considerations for UVIS Imaging
- • 6.11 UVIS Observing Strategies
- Chapter 7: IR Imaging with WFC3
- Chapter 8: Slitless Spectroscopy with WFC3
-
Chapter 9: WFC3 Exposure-Time Calculation
- • 9.1 Overview
- • 9.2 The WFC3 Exposure Time Calculator - ETC
- • 9.3 Calculating Sensitivities from Tabulated Data
- • 9.4 Count Rates: Imaging
- • 9.5 Count Rates: Slitless Spectroscopy
- • 9.6 Estimating Exposure Times
- • 9.7 Sky Background
- • 9.8 Interstellar Extinction
- • 9.9 Exposure-Time Calculation Examples
- Chapter 10: Overheads and Orbit Time Determinations
-
Appendix A: WFC3 Filter Throughputs
- • A.1 Introduction
-
A.2 Throughputs and Signal-to-Noise Ratio Data
- • UVIS F200LP
- • UVIS F218W
- • UVIS F225W
- • UVIS F275W
- • UVIS F280N
- • UVIS F300X
- • UVIS F336W
- • UVIS F343N
- • UVIS F350LP
- • UVIS F373N
- • UVIS F390M
- • UVIS F390W
- • UVIS F395N
- • UVIS F410M
- • UVIS F438W
- • UVIS F467M
- • UVIS F469N
- • UVIS F475W
- • UVIS F475X
- • UVIS F487N
- • UVIS F502N
- • UVIS F547M
- • UVIS F555W
- • UVIS F600LP
- • UVIS F606W
- • UVIS F621M
- • UVIS F625W
- • UVIS F631N
- • UVIS F645N
- • UVIS F656N
- • UVIS F657N
- • UVIS F658N
- • UVIS F665N
- • UVIS F673N
- • UVIS F680N
- • UVIS F689M
- • UVIS F763M
- • UVIS F775W
- • UVIS F814W
- • UVIS F845M
- • UVIS F850LP
- • UVIS F953N
- • UVIS FQ232N
- • UVIS FQ243N
- • UVIS FQ378N
- • UVIS FQ387N
- • UVIS FQ422M
- • UVIS FQ436N
- • UVIS FQ437N
- • UVIS FQ492N
- • UVIS FQ508N
- • UVIS FQ575N
- • UVIS FQ619N
- • UVIS FQ634N
- • UVIS FQ672N
- • UVIS FQ674N
- • UVIS FQ727N
- • UVIS FQ750N
- • UVIS FQ889N
- • UVIS FQ906N
- • UVIS FQ924N
- • UVIS FQ937N
- • IR F098M
- • IR F105W
- • IR F110W
- • IR F125W
- • IR F126N
- • IR F127M
- • IR F128N
- • IR F130N
- • IR F132N
- • IR F139M
- • IR F140W
- • IR F153M
- • IR F160W
- • IR F164N
- • IR F167N
- Appendix B: Geometric Distortion
- Appendix C: Dithering and Mosaicking
- Appendix D: Bright-Object Constraints and Image Persistence
-
Appendix E: Reduction and Calibration of WFC3 Data
- • E.1 Overview
- • E.2 The STScI Reduction and Calibration Pipeline
- • E.3 The SMOV Calibration Plan
- • E.4 The Cycle 17 Calibration Plan
- • E.5 The Cycle 18 Calibration Plan
- • E.6 The Cycle 19 Calibration Plan
- • E.7 The Cycle 20 Calibration Plan
- • E.8 The Cycle 21 Calibration Plan
- • E.9 The Cycle 22 Calibration Plan
- • E.10 The Cycle 23 Calibration Plan
- • E.11 The Cycle 24 Calibration Plan
- • E.12 The Cycle 25 Calibration Plan
- • E.13 The Cycle 26 Calibration Plan
- • E.14 The Cycle 27 Calibration Plan
- • E.15 The Cycle 28 Calibration Plan
- • E.16 The Cycle 29 Calibration Plan
- • E.17 The Cycle 30 Calibration Plan
- • E.18 The Cycle 31 Calibration Plan
- • E.19 The Cycle 32 Calibration Plan
- • E.20 The Cycle 33 Calibration Plan
- • Glossary